Location: Home >> Detail
Pharm Front. 2019;1:e190002. https://doi.org/10.20900/pf20190002

1 Fraunhofer-Institute for Molecular Biology and Applied Ecology, Max-von-Laue-Straße 9, Frankfurt, Germany
2 Institute of Pharmacy, Martin Luther University Halle-Wittenberg, Wolfgang-Langenbeck-Str. 4, Halle (Saale), Germany
3 Eurofins-PHAST Development GmbH & Co. KG, Byk-Gulden-Straße 2, Konstanz, Germany
4 Max Planck Institute for Polymer Research, Ackermannweg 10, Mainz, Germany
5 Cellnetworks and Department of Infectious Diseases, Heidelberg University Hospital, Im Neuenheimer Feld 344, Heidelberg, Germany
6 Institute of Pharmaceutical Technology, Goethe University, Max-von-Laue-Straße 9, Frankfurt, Germany
7 NETZSCH-Feinmahltechnik GmbH, Sedanstraße 70, 95100 Selb, Germany
8 NETZSCH Gerätebau GmbH, Wittelsbacherstraße 42, 95100 Selb, Germany
9 Malvern Panalytical Ltd., Grovewood Road, Malvern, Germany
Correspondence: Matthias G. Wacker
The workshop “Particle Characterization in Medicine and Biology” jointly organized by the LOEWE research center for Translational Medicine and Pharmacology and Malvern Panalytical Ltd. was held at the University Hospital, Goethe University in Frankfurt/Main on September 20th 2018. Speakers from academia and industry gave insights into particle manufacture and characterization in various environments. Further, the implications for drug delivery and clinical translation of micro and nanotherapeutics were discussed.
AC
API
AUC
DLS
SLS
US-FDA
NS300
PDA
PEG
PLGA
SEM
TGA
TEM
UUKV
EMA
CQA
NTA
FBS
The workshop Particle Characterization in Medicine and Biology of the LOEWE research center for Translational Medicine and Pharmacology was held in University Hospital, Goethe University, Frankfurt/Main on September 20th 2018 and was cosponsored by the House of Pharma e.V. and Malvern Panalytical Ltd.
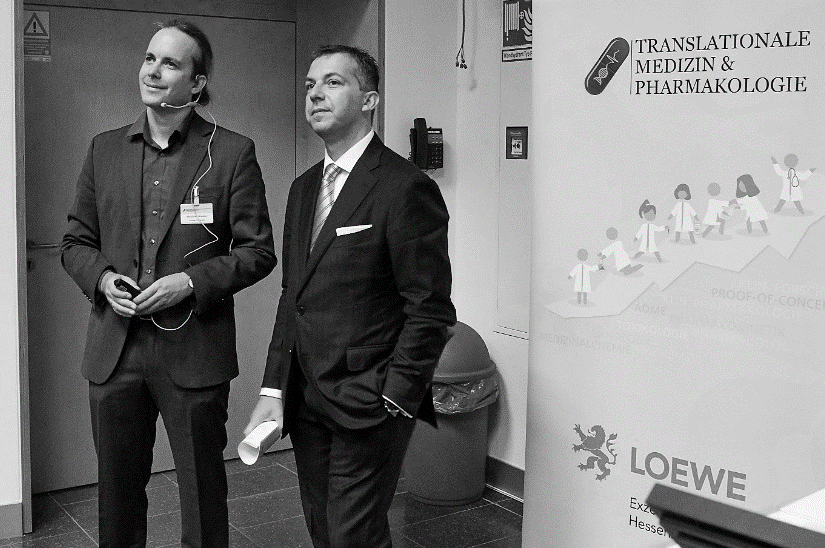 Figure 1. Opening of the LOEWE workshop by Dr. Matthias G. Wacker (Fraunhofer IME/Goethe University) and Dr. Marco Marenchino (Malvern Panalytical Ltd.).
Attendees of the workshop were introduced to a wide range of applications, where particle characterization plays a dominant role for the translation of nanotechnologies from bench to bedside. The aim of the workshop was to provide some practical advice on how to characterize nanotherapeutics and nanomaterials after synthesis, in presence of biological fluids and how to use this data in medical applications. The event was organized by Marco Marenchino (Malvern Panalytical Ltd.) and Matthias G. Wacker (Fraunhofer IME/Goethe University).
The opening remarks were given by Marco Marenchino (Malvern Panalytical) who welcomed an international audience to the workshop.
In the first talk, given by Matthias G. Wacker (Fraunhofer IME/Goethe University), titled “Particle characterization in Medicine and Biology”, participants were introduced to the LOEWE research center for Translational Medicine and Pharmacology. Further, he reiterated the aims of the workshop and highlighted the difficulties associated with particle characterization in different areas of medical and biological research. After explaining the use of nanotechnology for drug delivery, he presented the example of iron oxide particles which exhibit a significant variability in particle size when measured by dynamic light scattering (DLS, approx. diameter 60 nm) and transmission electron microscopy (TEM, approx. diameter 6 nm). This difference has been explained with the difference between the actual diameter of particles measured by TEM and the hydrodynamic diameter calculated from particle diffusivity when using the DLS method [1].
In the second case study, particle size and size distribution of a particle system was measured by a combination of DLS, TEM, scanning electron microscopy (SEM), and analytical ultracentrifugation [2]. For two formulations using two different excipients, DLS detected comparable particle size and size distribution [2]. Electron microscopy revealed a smaller particle size for one of these two formulations [2]. To calculate the particle diameter, DLS uses the intensity fluctuations of light scattered by the particles, assuming a spherical shape [3]. Matthias highlighted the need for combining different techniques and reporting the conditions under which particle size is measured to obtain reliable results.
In the third case study, he introduced the audience to a novel technique for measuring the drug release from nanoparticle formulations which was developed at the Goethe University [4] and is now commercialized in collaboration with Pharma Test Apparatebau AG. As a first step, he illustrated the importance of drug release testing for drug delivery applications. He presented a study of particle uptake in Caco2 and T-84 cells [5]. The delivery system effectively permeated the artificial mucus barrier and entered the cells but released 100% of its payload after few minutes within the gastrointestinal tract [5]. He also highlighted the implications for in vitro-in vivo correlation and explained how insensitive in vitro measurements impair the predictions made with in silico methods [6,7]. The dispersion releaser technology was more sensitive compared to other commonly used techniques and provided reliable prediction of bioavailability for orally applied drug formulations [6]. Furthermore, the device is used in combination with a compendial dissolution apparatus and allows application in quality control.
Finally, he summarized that an accurate detection of particle size as well as a sensitive measurement of drug release are required to improve current formulations. It was also concluded that in vitro findings must be justified by establishing in vitro-in vivo correlations.
The next talk, given by Karsten Mäder (Martin Luther University Halle-Wittenberg), was titled “Micro- and nanosized particles—How much control do we have in drug delivery?”
Controlled release implies the control of location and the release rate. After discussing the most commonly used mechanisms of control, Karsten compared the micron- and nanosized systems. He pointed out, that nanosized systems are very difficult to control by diffusion, but micron sized not. This statement is based on known diffusion coefficients [8,9] and diffusion laws. A factor of 1000 in size translates into a factor of 1,000,000 in diffusion time. Therefore, with a typical diffusion coefficient of 2.1012 cm2s-1 in a poly-lactic-co glycolic acid (PLGA) matrix, drugs will diffuse 20 nm in 1 second and 200 nm in 20 seconds, but it will take them almost 12 days to diffuse 20 microns. Enzymatic degradation might be important for the biofate of lipid and polymeric nanoparticles. It has been found, that the lipase dependent degradation of PLGA nanoparticles is strongly surfactant dependent [10]. High degradation was seen for poloxamer or tween stabilized particles, but nor for nanoparticles stabilized with polyvinyl alcohol.
In the following, some aspects of clinically used PLGA systems were discussed. The autocatalytic behavior and the possible formation of a highly acidic microenvironment was discussed with respect to release kinetics and drug stability. It was shown on several examples, that some products have undesirable characteristics including a high burst release or—on the contrary—a lag time of two weeks.
In the last part of his talk, Karsten discussed the size dependent accumulation of nanoparticles in tumor tissue. He also presented data on stimulus sensitive drug delivery and demonstrated that it is possible to achieve very high drug concentrations in the tumor and to cure drug resistance in a tumor model [11]. In the final part, a study showing an unintended accumulation of several nanocarriers in ovarian and adrenal tissue was shown [12]. Ovarian and adrenal accumulation has been observed by several groups for lipid and polymer based nanocarriers using multiple labeling techniques. Therefore, it seems that this phenomenon is not uncommon and further research is needed to understand the mechanisms and the effects of the accumulations.
Afterwards, Martin Klein (Eurofins-PHAST Development GmbH & Co. KG) spoke on ‘Analysis of drug release from nanoparticulate dosage forms without phase separation’ where he highlighted the drawbacks of in vitro release testing of nanoparticles in quality control. While solid, semi-solid or liquid dosage forms are routinely tested for their in vitro release or dissolution, using methods and devices described in pharmacopoeias, no such procedures are currently present for nanosized drug delivery systems.
At the beginning of his talk, Martin pointed out the current opinion of the Food and Drug Administration of the United States of America (US-FDA), which encourages the development of novel release/dissolution methods for individual products containing nanomaterials. Furthermore conventionally used separation methods (e.g., filtration) should be revised [13]. Later, he focused on the sources of variability and error that can arise, when adapting methods, routinely used in quality control of conventional dosage forms to nanoparticulate formulations. Among those, the most critical ones are the interaction of the active pharmaceutical ingredient (API) with dialysis membranes and filter materials, complex procedures of sample preparation and liquid handling, as well as the interference of nanoparticles with UV-/vis-spectroscopy methods for quantification of released API.
In a following case study, Martin presented a method, developed at Eurofins–PHAST GmbH, which combines the simplicity of a compendial apparatus with in situ quantification of released API via UV-spectroscopy using fiber optic probes. Micro- and nanosized PLGA-particles loaded with budesonide showed a typical interference with UV-spectroscopy during the investigation of their in vitro release characteristics, which could be compensated using derivatives of the spectra [14]. Using this innovative approach, a virtual separation of released budesonide and particulate carrier was possible without using a membrane based method. The validation of this method complied with the standards of good manufacturing practice showing linearity, accuracy and repeatability as well as limits of quantification. The release profiles calculated from the derived spectra revealed the method being capable of indicating formulation and manufacturing changes. Furthermore, the possibility for automation raises potential for the use in the pharmaceutical industry [15].
At the end of his talk, Martin Klein mentioned, that virtual separation methods, using in situ UV absorption spectroscopy are limited to opaque nano- and microcarries as well as API with distinct absorption bands in the desired spectral range. Nevertheless, the presented study gives a good example of the necessity to tailor the analytical method to the pharmaceutical product.
In his presentation entitled “Virus infectivity and further molecular characterization of viral particles”, Pierre-Yves Lozach (University Hospital Heidelberg) addressed the issues encountered by virologists in defining the infectivity of viruses. After a brief introduction into the extreme diversity of viruses in shapes and sizes [16], he presented the virus model system Uukuniemi (UUKV) that is used in his group to study early steps of viral infections [17,18]. He then showed how to label UUKV particles with various fluorophores and how to detect the fluorescently labeled particles by confocal microscopy [19,20]. Using this approach, his group observed that, when 5 infectious particles are bound to one cell, hundreds of particles are actually seen at the plasma membrane. This result indicates that, for one infectious particle, many particles are not infectious in the virus stock. He estimated a ratio of 1 infectious viral particle to 10,000 non-infectious particles (1:10,000) when UUKV is produced from mammalian cells. He explained that this ratio is often used to investigate the infectivity of viruses and provided evidences that the value can vary depending on the cell type from which the virus is derived. For instance, UUKV is transmitted by ticks to mammals [21]. The group of Pierre-Yves found that the ratio of infectivity increases dramatically when UUKV is derived from tick cells, reaching a value of 1:500. Electron micrographs were also shown and supported the view that the structural organization of UUKV varies at large whether the virus is produced from tick or mammalian cells (particle size about 60–70 vs. 110–120 nm respectively). Together this data suggests that UUKV has a higher infectivity when produced from the arthropod vector.
In a second part, Pierre-Yves discussed how to determine the size and number of viral particles using Nanoparticle Tracking Analysis (NTA) with a nanoparticle analyzer NanoSight 300 (Malvern Panalytical, Malvern, UK). Using this method, he could determine the number and size of viral particles in purified UUKV stocks. The results were similar to those obtained with fluorescently labeled particles and confocal microscopy. Using NTA, the infectivity of UUKV produced from tick cells was found at about 1:5,000. Pierre-Yves pointed out the importance of this approach to produce large, pure amounts of viruses in order to avoid any confusion with exosomes in the same range of size.
In the last part of his presentation, Pierre-Yves disclosed the approaches developed in his group to analyze viral particles in more physiologically relevant environments, such as sera or culture media from infected cells. To this end, his group is currently assessing different ways to label single particles with fluorophore-conjugated antibodies against viral proteins at the surface of viruses. The capacity of NTA to detect fluorescence should enable the tracking of single fluorescently labeled viral particles in more complex conditions.
Finally, he concluded that NTA is a fast, non-invasive procedure that has great potential to represent a complementary approach to the classical microscopy techniques in order to study viral infectivity and structural organization of viruses.
In her talk “Characterization of anisotropic particles and micelles by light scattering”, Katrin Wunderlich (Max-Planck-Institute for Polymer Research) illustrated in three examples, how anisotropic nanoparticles and micelles were able to be characterized by dynamic and static light scattering (SLS). In the first example it was shown that polycyclic aromatic compounds functionalized with polyethylene glycol (PEG) chains result in bundles of fibers. The water content in the hydrogel fibers could be controlled by the substitution pattern of the amphiphilic molecule and by the length of the PEG chains. Similar to nature, the self-assembly of the polycyclic aromatic compounds was controlled by different molecular interactions such as hydrogen bonding and π-π interactions [22,23].
In a second example, very small polydopamine (PDA) poly(ethylene glycol) (PEG) crosslinked copolymer (PDA-PEG) nanoparticles were presented. Particle sizes and colloidal stabilities were optimized by varying the chain length and end group functionalities of PEG. In particular, amine-terminated PEG3000 (PEG3000(NH2)2) reacted with polydopamine intermediates to form very small, crosslinked PDA-PEG nanoparticles with less than 50 nm in size. The formed PDA-PEG nanoparticles revealed efficient cellular uptake and high cytocompatibility thus rendering them attractive candidates for cell imaging or for drug delivery applications [24]. In a third example, anisotropic brush polymers with a protein backbone and polymer chains as side chains were discussed. A detailed DLS and SLS study in combination with simulation revealed that the grafting density and the length of the polymeric side chains can control the shape of the brushes [25].
In conclusion, dynamic and static light scattering are very powerful techniques to obtain information about size and shape of nanoparticles and micellar structures, which is of importance for various applications.
In the afternoon session, Mukul Ashtikar presented his talk “Particle tracking analysis in complex media—An issue to be solved!” and illustrated the difficulties in characterizing particle size distribution in presence of biorelevant media.
To introduce his presentation, Mukul talked about how blood proteins determine to a major extent the fate of nanoparticles upon injection in blood which he described as the “impenetratable armor” to the “magic bullets” of Paul Ehrlich [26]. There is a host of different particle sizing techniques available and depending on the size range they can be classified under nano (1–1000 nm), subvisible (1–100 mm) and visible range (>100 µm). Mukul explained one of the challenges in particle sizing as no single technique exists which can cover the entire range from nano to visible. Particle characterization is not only important for product characterization but regulatory authorities including US-FDA and EMA have identified particle size distribution as a critical quality attribute (CQA). Although at the moment both US-FDA and EMA do not have draft guidelines for non-biological complex drugs, guidelines for liposomes and iron based colloidal products have identified size distribution and effect of changing pH and salt concentration on the particle integrity as CQAs [27–29]. US-FDA draft guidelines for biological products which contain nanomaterials also demand to examine impact of human plasma on the colloidal stability of nanomaterials [30].
Mukul further elaborated that biggest challenge of measuring particle size in biological and biorelevant media is the high background which manifests from the colloidal nature of these media. Therefore, either a strong contrast in the particle size of nanoformulation and media must be present or size measurements must be conducted in extremely high dilutions which can alter the state of aggregation and result in misleading results. NTA which can track individual particles undergoing Brownian motion and therefore can determine the diffusion coefficient for each particle which is then plugged into the Stokes-Einstein equation to calculate particle size distributions. Particle size distributions generated using dynamic light scattering and NTA for 10% fetal bovine serum (FBS) diluted in ultrapure water show a high concentration of particles present throughout 1 to 1000 nm range. A similar issue is also observed if surfactants are replaced by biological media. Both 0.1% Sodium dodecyl sulfate and 0.05% polysorbate 80 solutions show a high particle count in the 1 to 500 nm range when measured using NTA.
After discussing the challenges, three case studies were discussed. If a nanoformulation is fluorescently labelled then NTA can distinguish between the colloidal background from the biological or biorelevant media and nanoformulation. First case study showed particle size distributions for a fluorescently labelled PEGylated and non-PEGylated human serum albumin theranostic nanoparticle system measured in 0.0, 0.1, 1, 10 and 100% foetal bovine serum (FBS). Increasing concentration of FBS resulted in wider particle size distributions and a significantly higher d90 values. Increase in particle size distribution was much more pronounced for non-pegylated nanoparticles. Second case study focused on the stability of fenofibrate nanocrystals during their transit through the gastrointestinal tract. Nanocrystals were incubated in fasted state gastric fluid, fasted state intestinal fluid V2 and fasted state simulated colonic fluid. Just before the measurement, incubated nanocrystal suspensions were diluted in ultrapure water to reach appropriate concentrations for NTA measurements. Even though particle size did not change significantly between all three media, particle concentration decreased significantly in the simulated colonic fluid indicating a destabilizing effect. In the 3rd case study, a marketed photosensitizer product which is known to precipitate upon injection in blood in humans was injected at a controlled rate in 10% FBS and particle size distribution for the precipitated drug was measured using NTA. The particle distribution obtained was then used for building up a physiologically based pharmacokinetic based model for establishing in vitro-in vivo correlation.
To conclude, Mukul highlighted that NTA can offer excellent contrast for size determinations from complex biological media if nanoparticles possess a fluorescent label. However, fluorescent labelling in a day-to-day quality control framework is not possible. He also highlighted the importance of measuring particle concentrations together with particle size distributions.
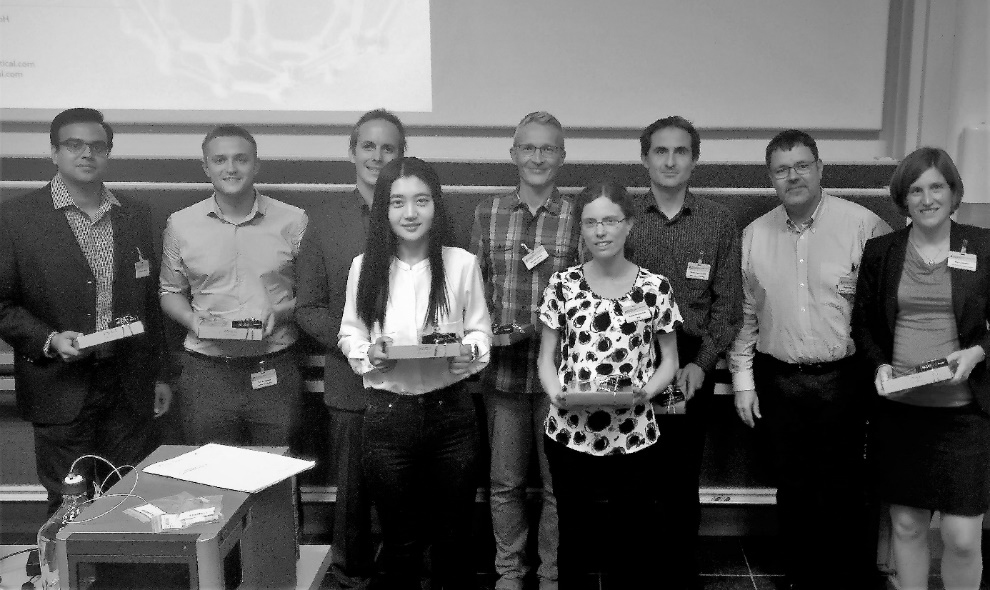 Figure 2. Photograph of the speakers involved in the workshop event at University hospital, Goethe University. From left to right: Mukul Ashtikar (Fraunhofer IME), Tom Dennison (Malvern Panalytical), Matthias G. Wacker (Fraunhofer IME/Goethe University), Ge F. Gao (Fraunhofer IME/Goethe University), Karsten Mäder (University of Halle-Wittenberg), Katrin Wunderlich (Max Planck Institute for Polymer Research), Pierre-Yves Lozach (Heidelberg University Hospital), Stefan Mende (NETZSCH-Feinmahltechnik GmbH), Claire Strasser (NETZSCH Gerätebau GmbH).
In her talk “Prediction of human pharmacokinetics of subcutaneously administered formulations”, Ge Fiona Gao (Fraunhofer IME/Goethe University) presented how modeling could be utilized to predict in vivo pharmacokinetic profile of subcutaneously injected formulations. At first, she emphasized subcutaneous injection was an important administration route that is highly effective in administering insulin. Diabetes is a pandemic chronic disease. In 2014, 8.3% of the global population was suffering from it. Patients with type 1 diabetes and patients with late stage of type 2 diabetes need to inject insulin to help manage their blood sugar levels. There are rapid-acting insulin, regular human insulin and long-acting insulin. These commercial insulin products were brought to the market to ensure that the patients could have a complete near-normal 24-hour glycemic control. The different insulin formulations follow different pharmacokinetic profiles. Apidra(R), formulation of insulin glulisine, ensures a rapid dissociation and absorption of insulin after a subcutaneous injection. Insulin glulisine appears earlier in the blood than human insulin of Actrapid®. Protaphane® provides a basal concentration of insulin to control fasting hyperglycemia and blood glucose concentrations before meals throughout the day. To simulate the pharmacokinetic (PK) profile of different insulin formulations, a mechanism-based pharmacokinetic model was built. A three-compartment model including lymphatic system was the best choice from Phoenix® WinNonlin® model fit. Further, Fiona described an agarose gel based in vitro diffusion assay to investigate the differences in absorption rates between different formulations. The diffusion rate of monomeric Apidra® was higher than hexameric Actrapid®, while the hexameric insulin in Protaphane®, once released after pretreatment with heparin, diffused at the same rate as regular human insulin in Actrapid®. Moreover, this diffusion assay was also suitable for testing diffusion of small molecules. As an example, granisetron, whose molecular weight is about 20 times lower than monomeric insulin, diffused about 5 times faster than Apidra®. The diffusion rate obtained from the in vitro test was used in the mechanism-based pharmacokinetic model. The plasma profile was simulated using the software Stella® Architect. In all cases, cmax was precisely predicted with a maximum error of 4.5%. For Apidra®, the predicted tmax value was higher compared to Actrapid®. For higher doses of Actrapid®, the prediction error was comparably high. An additional compartment simulating the degradation may be needed for parameter estimation. For Actrapid®, the prediction of AUC was good. It was suggested that the model used in WinNonlin® is quite suitable for the relatively stable hexamer although the deviations in the clinical data was high. To investigate the pharmacokinetics of Protaphane®, the release mechansm of insulin from crystalline isophane insulin should be studied further. Moreover, biorelevant medium will be used to perform the diffusion assay to analyze the effect of protein on insulin diffusion process.
Stefan Mende (NETZSCH-Feinmahltechnik GmbH) presented “Micro and nanonization of active pharmaceutical ingredients”. During the first part of the presentation he showed an overview of the equipment, requirements and examples for micronization and nanonization of API. Examples of optimization of the process parameters regarding energy demand, production capacity were shown as well as the possibilities for scale-up of those processes were discussed [31].
In a typical manufacturing process of API, top down processes like high pressure homogenization and wet bead milling are increasingly used as methods to decrease the particle sizes down to a fineness range of 10 to 500 nanometers.
The comminution or deagglomeration of active pharmaceutical ingredients (API) is referred to as micronization or nanoization and can bring about various benefits. With the increase in particle surface area associated with comminution, the dissolution rate and thus the bioavailability of the active ingredients can, in part, be drastically increased. This means that the drugs take effect more quickly. Due to the increased bioavailability, smaller amounts of the API are required which, in turn, leads to a more cost-effective product with fewer risks and side effects for patients.
It was shown, that an exact reproducible scale-up of micronization and nanoization from the laboratory scale to the real production scale is possible.
During the second part of the presentation Claire Strasser (NETZSCH-Gerätebau GmbH) discussed the potential of thermal analysis.
Thermal analysis is used to answer the following questions:
•
•
•
•
•
For that purpose, DSC (Differential Scanning Calorimetry) and TGA (Thermogravimetry) are applied.
Claire further explained the importance of thermal analysis with an example of polymorphic substance sorbitol. Sorbitol was measured three times using DSC. A first heating of the sample as received showed an endothermal peak that was characteristic for the crystalline form of sorbitol, called gamma. After controlled cooling at 10 K/min, sorbitol was heated again. This time, the DSC curve did no longer show a peak but a glass transition—an indication that the substance was now amorphous. After 24 hours at room temperature, the sample was measured a third time with the DSC. A double peak indicated that sorbitol had converted to a crystalline form but in another form. The position of this double peak is typical for the modification called “crystallized melt”. Just a single heating with the DSC allows for the determination of the modification of a polymorph substance. Claire then concluded her talk by highlighting that thermal analysis is of great importance as physical properties of a substance are dependent on the nature of the polymorph and whether it has undergone any modifications.
The final presentation, given by Tom Dennison (Malvern Panalytical Ltd.), was titled “Adopting best practice techniques with your NanoSight” and began by covering the theory behind Nanoparticle Tracking Analysis. NTA is a technique that allows detection of particles within the sub-micron range. Central to this technology is the detection of light scattered by particles within a liquid suspension, which are viewed as point scatterers moving under Brownian motion. By taking video captures of these particles and then tracking each particle individually the speed of Brownian motion can be determined, from which the particle size can be inferred. NTA measurements are quick and easy to perform, however there are several best practice principles that are important to follow and understand to obtain accurate and repeatable particle size and concentration measurements.
Tom next discussed how to optimize the sample image prior to making a measurement. NTA utilizes a conventional optical microscope fitted with a scientific camera and therefore careful setup of the image focus and camera level is very important. When choosing appropriate levels for these settings it is important to concentrate on the faintest scattering centers, so that no information is lost, whilst also maintaining a good contrast between background and sample. Given the high sensitivity of the system, it is vital that samples are diluted to an appropriate concentration for successful measurements, which should be in the range of 3–8 × 10⁸ particles/mL, or approximately 30–80 particles on screen. Being able to run NTA measurements of a sample under flow significantly improves robustness of data and it is important to consider the flow rate and an appropriate video capture length and number of repeats for a given sample. For the flow rate, particles should travel across the field of view within 5–10 seconds in order to account for particle drift, whilst capture duration is highly sample dependent, with longer captures required for more polydisperse samples.
Best practice recommendations for image processing were also discussed, where careful selection of the detection threshold ensures that particles are accurately selected against the background. The detection threshold should be set low enough so that the faintest scattering centers are not lost, but not too sensitive that the software starts tracking noise. Fluorescence measurements are also possible using the NanoSight through implementation of a fluorescent filter and allow detection of particles of interest against a complex background. Theoretical and practical considerations for fluorescence measurements were also covered, including tips on how to enhance fluorescence signal and image contrast, in order to improve data quality.
The LOEWE workshop Particle Characterization in Medicine and Biology successfully illustrated the difficulties in characterizing particle species. A broad spectrum of techniques was presented as well as the implications for our understanding of nanoparticles and their interactions with the environment.
The authors would like to acknowledge the LOEWE initiative of the State of Hessen for supporting the LOEWE research center for Translational Medicine and Pharmacology. Further, we thank Otto Quintus Russe, Manuela Thurn, Christian Müller and Diana Streb for helping to organize this outstanding event.
1.
2.
3.
4.
5.
6.
7.
8.
9.
10.
11.
12.
13.
14.
15.
16.
17.
18.
19.
20.
21.
22.
23.
24.
25.
26.
27.
28.
29.
30.
31.
Ashtikar M, Mäder K, Klein M, Wunderlich K, Lozach P-Y, Gao F, Mende S, Strasser C, Dennison T, Marenchino M, Wacker, MG. LOEWE Workshop Particle Characterization in Medicine and Biology. Pharm Front. 2019; 1: e190002. https://doi.org/10.20900/pf20190002

Copyright © 2020 Hapres Co., Ltd. Privacy Policy | Terms and Conditions