Location: Home >> Detail
Pharm Front. 2019;1:e190006. https://doi.org/10.20900/pf20190006

School of Pharmacy and Pharmaceutical Sciences, University of Sunderland, Chester Road, Sunderland, SR1 3SD, UK
* Correspondence: Cheng Shu Chaw, Tel.: +44-191-515-2584.
Background: Albumin-based nanoparticles have been used as drug carriers to improve therapeutic effect. This study aimed to produce sulfasalazine (SSZ)-loaded bovine serum albumin (BSA) nanoparticles by desolvation technique and characterize their physical properties. Drug loading effect was also investigated.
Methods: SSZ albumin nanoparticles were batch produced by desolvation technique and lyophilized. Physical characteristics of nanoparticles including size distribution, zeta potential and entrapment efficiency were studied.
Results: Nanoparticles were spherical and typically 200–400 nm with low polydispersity (PDI). The zeta potentials of nanoparticles ranged from −21 to −41 mV, which were attributed to BSA and SSZ. The highest actual drug loading was close to 0.5%w/w. The addition of 2% sucrose during lyophilization was essential to avoid cake collapse and the particle sizes increased slightly where their PDI values were low. Although the presence of sucrose led to a slight reduction in zeta potential, it had limited effect on zeta potential of the nanoparticles. The interactions between SSZ and formulation excipients were also confirmed with FTIR and DSC analyses.
Conclusion: Desolvation technique produced stable sulfasalazine-loaded nanoparticles that can be administered parenterally.
Sulfasalazine (SSZ) is a serine-threonine specific protein kinase activation inhibitor that inhibits xc- cysteine/glutamate antiporter in order to reduce cellular glutathione level [1]. An induction of tumor cell death and an enhanced anti-proliferative effect were previously reported combining SSZ with other agents [1–3]. In a Phase 1 clinical study, an oral solid form of SSZ (marketed product) in combination with cisplatin was given to patients with advanced gastric cancer [4]. The trial data showed that there was a reduction in CD44v-positive cancer cell population in the biopsy tissues in a small number of patients. However, the objective response of the trial was not achieved, as the blood concentration for SSZ did not reach the tumor cell killing level with current oral SSZ dose regime. Hence, developing a parenteral preparation consisting of SSZ that can achieve a blood level high enough will potentially enhance its therapeutic effect for this indication.
There are several ways to deliver nanoparticle formulations, which include administration of the suspended nanoparticles via parenteral route. Nanoparticles can withstand physiological stresses, improve intracellular penetration of the cargo and enhance drug activity. They may be fabricated from either natural or synthetic polymers [5,6]. Albumin, a biopolymer, is an attractive material for the synthesis of nanoparticles. It is non-toxic, biodegradable and can be readily excreted from the body after drug release. Moreover, it has a reasonably long residence time in the bloodstream, and it may change the pharmacokinetic profile of the embedded drug [5]. Albumin-based nanoparticles can load various types of drugs [7,8]. The charged residues at their surfaces help to stabilize the nanoparticles and maintain particle dispersion [9]. Surface charge density and size of the nanoparticles are the factors that influence their biological fate [8]. These properties are governed by the materials and techniques used in the particle fabrication. Albumin nanoparticles can be produced by desolvation [10,11], emulsification [12] or thermal gelation [13]. One of the concerns for desolvation technique is producing a stable nanoparticle formulation with reproducible size [14]. Hence, the properties of albumin solutions have to be manipulated to control the nanoparticle synthesis [15,16]. The benefit of encapsulating drugs including SSZ into nanoparticles has been reported, however, so far no research has been done using bovine serum albumin (BSA) to deliver SSZ in a parenteral form. The current study will explore the desolvation conditions for the synthesis of SSZ-loaded nanoparticles. The effect of drug loading on the physical properties including size and zeta potential of the nanoparticles will also be examined. It is predicted that by using a water-soluble form of nano-carriers where SSZ molecules are protected in the hydrophobic pocket of BSA, the efficiency of drug delivery can be enhanced while the toxicity and side effects can be potentially reduced.
Sulfasalazine, bovine serum albumin and 8% aqueous glutaraldehyde (GTA) were purchased from Sigma-Aldrich (Missouri, USA). HPLC grade ethanol, potassium dihydrogen orthophosphate and disodium hydrogen phosphate were obtained from Fisher Scientific (Loughborough, UK). Sodium hydroxide pellets and sucrose were from BDH Chemicals (Poole, UK). Deionized water was used as diluent.
Preparation of NanoparticlesBSA nanoparticles were prepared using desolvation technique published previously [10] with modifications. BSA and SSZ powders were weighed (Mettler MT5 Balance, Columbus, USA) according to the compositions in Table 1. BSA powder was dissolved in 2 mL of 15 mM phosphate buffer (PB) pH 9 and then SSZ powder was dissolved in the BSA solution. The pH of the mixture was re-adjusted to pH 9 with sodium hydroxide solution. Sample was left to stir for 10 min at 800 rpm (Hanna HI-190M, Leighton, UK) under room temperature before adding 8 mL of ethanol continuously at 1 mL/min using a P-1 Pharmacia pump (Uppsala, Sweden). Then 0.11 mL of 8% GTA was added and the suspension was left to stir for 18 h, followed by washing with deionized water for 3 times with centrifugation (Beckman J2-21, Beckman Coulter, Indianapolis, USA) at 13,000 rpm for 30 min after each wash to purify the samples. The retrieved nanoparticles were re-dispersed in 8 mL of 2% sucrose solution except for one sample that was re-dispersed in same amount of water. All samples were frozen at −80 °C before they were lyophilized for 48 h (Martin Christ Alpha 1–2 LDplus, Osterode, Germany) under constant conditions, which were at 10 °C and 0.011 mbar.
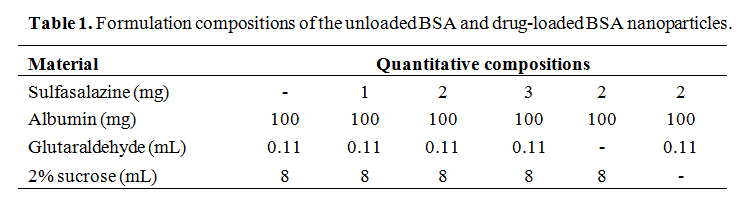 Table 1. Formulation compositions of the unloaded BSA and drug-loaded BSA nanoparticles.
A 50 µg/mL stock solution was prepared by dissolving SSZ powder in PB pH 9. Then the stock solution was diluted to prepare calibration standards (2–16 µg/mL). The drug levels were monitored by M501 Camspec UV spectrometer (Leeds, UK) at 359 nm, as this was the wavelength for maximum absorbance. Calibration plot showed a good linearity (R2 = 0.9998) with a calculated specific absorbance value of 631, which was close to the literature value (refer to Appendix Figure A1)[17]. The amount of un-entrapped drugs that were retrieved from the supernatants during sample purification process, (from Section “Preparation of Nanoparticles”) were tested twice. To calculate the encapsulation efficiency (%EE), the amount of drug found in the supernatant was subtracted from the amount that was initially added, which gave the amount of drug entrapped in the nanoparticles before converting into the percentage value.
Particle Size Distribution and Zeta PotentialThe freshly prepared suspensions were diluted 200 times with water before measuring size and polydispersity index (PDI) by using Zetasizer Nano ZSP system (Malvern instrument, Cambridge, UK). Besides, 1 mg lyophilized nanoparticles was re-dispersed in 200 mL of the same medium to study the effect of lyophilization on size and zeta potential of the nanoparticles using the same equipment. The pH values of the samples after dilution were closed to the pH of blood (which is pH 7.4). Measurements were performed in triplicates at 25 °C.
Morphological Analysis by Scanning Electron Microscopy (SEM)The freshly prepared sample was deposited on a carbon adhesive disc of the SEM stud. The samples were dried before being coated with a layer of platinum by using a sputter coater (Model: AGB7340, Agar Scientific, Essex, UK). The samples were visualized with a Hitachi SEM (Model: S-3000N, Tokyo, Japan) under vacuum at 5000 V and the images were acquired.
Fourier-Transform Infrared (FTIR) SpectroscopyFourier-transform IR analysis of the samples and powder specimens was performed. The FTRA spectra were obtained by using a Shimadzu IRAffinity-1S spectrometer (Shimadzu UK Ltd, Buckinghamshire, UK). The samples were scanned at the wavelengths between 550 and 4000 cm−1. The resolution of the scan was 4 cm−1 and 16 scans were recorded for each spectrum.
Differential Scanning Calorimetry (DSC)Three to five mg of lyophilized sample was placed in a sealed hermetic aluminium pan before subjecting to a single heating cycle from 0 to 300 °C at 10 °C/min in a nitrogen atmosphere with a nitrogen flow rate of 50 mL/min, and the thermograms were obtained by using DSC (Model: Q1000, TA Instrument, Ghent, Belgium). The equipment was calibrated and the settings were confirmed with indium standard.
Preliminary Drug Release and Solubility TestsTen mg of lyophilized form of drug-loaded nanoparticles (initial 2%w/w drug loading) were dispersed in 200 mL water. The samples were shaken at 25 °C in a water bath for 24 h to monitor the amount of drug release. The total fraction of drug release was calculated based on the actual amount of drug found in the nanoparticles (refer to Section “Drug Encapsulation Efficiency”). Furthermore, an excess amount of SSZ powder was added to 2 mL of BSA solution (water as diluent), the sample was then shaken at 25 °C for 24 h to determine the amount of drug dissolved, i.e., drug solubility. The samples for both tests were centrifuged to collect the supernatants, which were further filtered and diluted with phosphate buffer before determining the drug levels by a UV spectrometer according to Section “Drug Calibration Plot and Encapsulation Efficiency Study”. Tests were performed twice.
Statistical AnalysisStatistical analysis was performed by SPSS software (version 25.0, SPSS Inc., Chicago, USA). The statistical tests included ANOVA and Paired t-test. They were used to examine the physicochemical properties of the nanoparticles such as particle size and zeta potential as well as the drug entrapment efficiency. A p-value of ≤0.05 was considered that the difference was statistically significant.
Desolvation is a feasible technique that can produce albumin nanoparticles [10]. In this study, ethanol has been selected as the desolvation agent. The volume and flow rate of ethanol affect the size of the nanoparticles [15]. The ratio of sample to ethanol was kept at 1 to 4 and the flow rate was adjusted to 1 mL/min, as these conditions allowed the formation of BSA nanoparticles. It was noted that the BSA solutions turned cloudy after adding 5 mL of ethanol indicating supersaturation of BSA, and as a result, nucleation and nuclei growth by coagulation have enabled the particle formation.
The sample’s pH is a critical factor that controls coagulation of the solvated BSA [15]. Changing sample’s pH alters the net charges on the protein surface [11]. BSA solution with pH that was adjusted to close to its isoelectric point (IEP ~4.7) readily aggregated to form large particles [18]. While at the pH above its IEP, negative charges were induced at the surface of the proteins and a smaller nanoparticle size was reported [11]. In the current study, pH 9 was chosen for the synthesis of nanoparticle as the drug bears a carboxylate on its structure that is readily ionized under this condition (Figure 1). After the addition of SSZ powder, pH of BSA solution dropped to ~6.6 as the dissolved SSZ species was acidic in nature and pH value of the sample had to be re-adjusted. Glutaraldehyde is the key cross-linking agent.
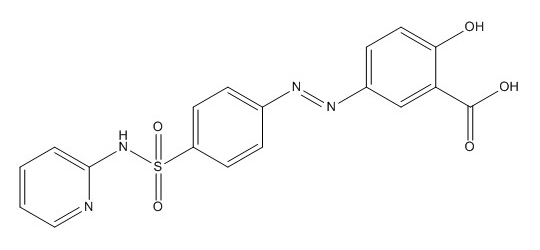 Figure 1. Chemical structure of sulfasalazine.
The amount of GTA can affect the physical properties such as size and surface charges of the nanoparticles [15]. The carbonyl groups of GTA react with the amino moieties (such as that found in lysine of BSA) via a nucleophilic reaction to form Schiff bases in the neutral to alkaline environment [19], thus preventing re-solvation of BSA molecules. In this study, 8.8 mg GTA per 100 mg BSA was used and the suspensions were stirred for 18 h to complete the reaction. This has led to nanoparticles with a narrow size distribution, which is stable in characteristics as discussed in the following sections.
Drug Encapsulation EfficiencyEntrapment efficiency was studied by varying the theoretical drug loading (TDL, also refer to as initial drug loading) from 1 to 3%w/w (mg SSZ per 100 mg BSA). The best drug encapsulation was obtained when 1%w/w TDL was used (p = 0.152, F = 3.73 by ANOVA, Figure 2). The highest actual drug loading (ADL) was close to 0.5%w/w when 2%w/w TDL was used (p = 0.038, F = 11.89), and this was significantly higher than those loaded with 1%w/w TDL. The quenching of BSA fluorescence by SSZ has previously showed and accordingly, the drug molecules could bind to BSA subdomains and the binding constant was 3 × 10⁻⁶ M [20]. In this study, the quantities of drug used were between 2.5 × 10⁻⁶ M and 7.6 × 10⁻⁶ M. In addition, the reaction time was three folds less than previously reported [20]. Hence, a lower TDL and a longer reaction time can lead to a better drug encapsulation efficiency.
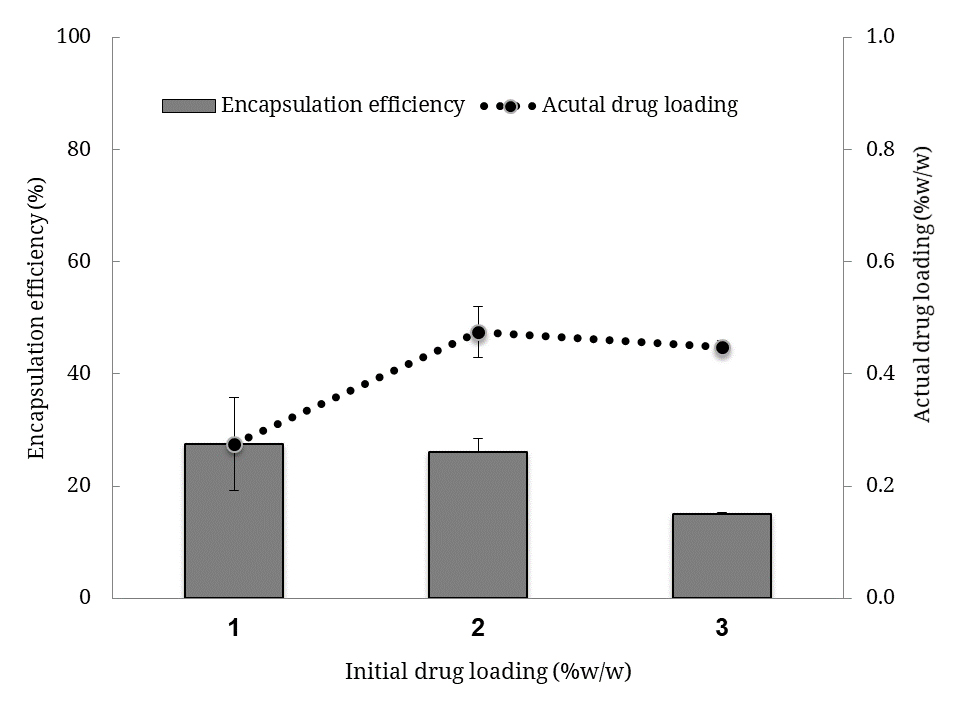 Figure 2. Actual drug loading levels and encapsulation efficiency (%EE) values of the drug-loaded nanoparticles. Bars represent encapsulation efficiency and symbols (with the line) represent the actual drug loading. Note: initial drug loading is also referred to as theoretical drug loading (TDL) in the text.
Particle size distribution affects product quality and the behavior of nanoparticles in the biological system. In the current study, the nanoparticle sizes of all the samples were found to be within the nanometer range. They also exhibited a mono-modal size distribution and the PDI values were typically <0.3 (Figure 3 and refer to Appendix Figure A2). For the freshly prepared samples, an increase in TDL resulted in a larger particle size. The mean particle sizes of the nanoparticles ranged from 208 to 381 nm (p < 0.05, F = 145.07), and the sizes were significantly larger when TDL of 2%w/w or above were employed in the fabrication process. As dynamic light scattering technique detects variation in the scattered light intensity, the absorption and emission of labeled dyes or self-luminescent materials such as sulfasalazine may affect the measured DLS signals and thus, particle size of the sample. Geißler and co-workers reported a decrease of the correlation coefficient when a higher concentration of fluorescence dye was present in the nanoparticles [21]. According to the authors, the observed phenomenon was attributed to an increased absorption of the incident light that had resulted in a lesser coherent light scattering. In spite of the observed changes in the correlation functions, Geißler and co-workers demonstrated that there was an insignificant effect on the measured particle sizes of their labeled nanoparticles. In the current study, statistical analysis of the particle sizes for the freshly prepared nanoparticles as mentioned above showed that the size of drug-loaded nanoparticles (at 1%w/w TDL) was not significantly different from the unloaded nanoparticles. This has provided further evidence supporting that the application of DLS in a standard configuration is reliable even for fluorescent nanoparticles if their emission is reasonably low [21].
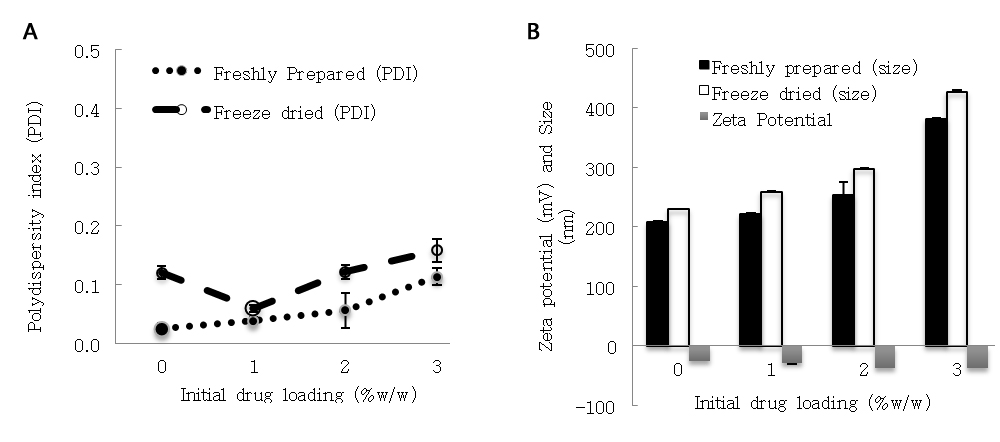 Figure 3. Particle size, polydispersity index (PDI) and zeta potential values of the nanoparticles. (A) Bars represent the particle size (black or white bars) and zeta potential (grey bars) values. (B) Lines represent the PDI values. Note: initial drug loading is also referred to as theoretical drug loading (TDL) in the text.
After lyophilization process, an increase in particle size of the nanoparticles was observed. The mean sizes ranged from 229 to 426 nm (p < 0.05, t = −8.785, the comparison was based on Paired t-test between the fresh and lyophilized samples). The freshly prepared samples had smaller PDI values than the lyophilized samples despite adding a sufficient quantity of sucrose [22]. In the absence of GTA and sucrose, the reconstituted suspensions had larger sizes between 699 and 688 nm, and their PDI values were high, which were 0.6 and 0.55, respectively. Collapsed cake structure was seen in the sucrose-free sample confirming that sucrose is an effective protectant during lyophilization process. Nanoparticles with spherical morphology and uniform particle size were observed by using a high resolution SEM, thus supporting the low PDI values reported above with DLS technique (Figure 4A). For the GTA-free sample, aggregates were seen (Figure 4B).
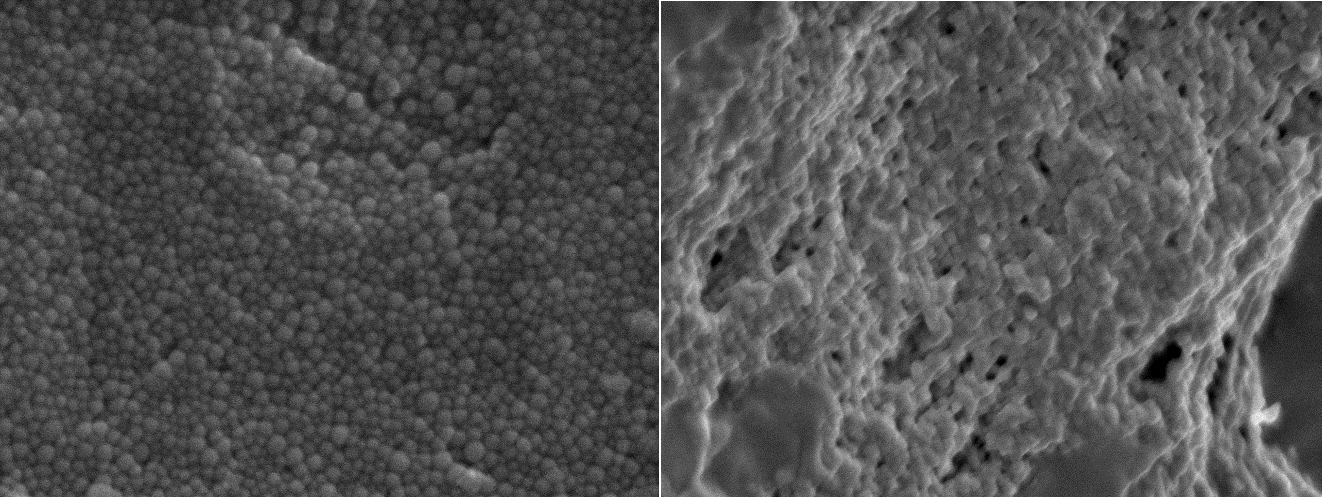 Figure 4. Typical morphologies of nanoparticles viewed under high resolution by using a scanning electron microscopy (magnification 8000×). Drug-loaded nanoparticles prepared by using 2%w/w initial drug loading (A) with glutaraldehyde (left); (B) without glutaraldehyde (right), were used as specimens.
Zeta potential measures the charges displaying at particle’s surface [23]. A larger zeta potential value indicates a greater repulsion amongst the particles leading to a better colloidal stability. In the current study, zeta potential values of the samples ranged from −24.8 to −36.3 mV. The samples were measured at the pH resembling the blood, which was the intended route for administration for this formulation. These values concur to the results reported previously (Figure 3A)[15]. The zeta potential values became significantly more negative after adding SSZ compared to those prepared without adding drug except for the sample that was prepared with 1%w/w TDL (p < 0.05). Although SSZ bound to the hydrophobic pockets of BSA molecules, its carboxylate group was ionized at neutral or alkaline solution. The presence of this ionized group has contributed extra charges to the drug-loaded nanoparticles. The measured zeta potential for nanoparticles without GTA was −21.0 mV and they fluctuated (from −12 to −30 mV), as the desolvated BSA coacervates had not been cross-linked. Sucrose molecules interact with BSA by forming hydrogen bonds during the lyophilization process. As it is weakly acidic in nature, it can lower pH of the suspending medium and thus altering charge density of the nanoparticles. Comparing drug-loaded nanoparticles with and without sucrose that were prepared with 2%w/w TDL, the zeta potential values were slightly more negative for the latter but not significant (p > 0.05). This was partly because the pH of the samples was similar. Hence, adding sucrose has not compromised charge stabilization of the nanoparticles.
FTIR AnalysisFourier transform infrared spectroscopy evaluates the chemical and conformational changes in the nanoparticles. Spectra of the nanoparticles with or without drug were similar (Figure 5). In protein infrared spectrum, the structural changes are presented by the shifts in certain characteristic bands (Table 2)[24]. Some of these bands were shifted in the nanoparticles when compared to pure BSA powder (e.g., Amide III by 16 cm−1) Moreover, the presence of SSZ in the drug-loaded nanoparticles shifted Amide II band (by 8 cm−1 when compared to blank nanoparticle). All the nanoparticles showed a slight decrease for CH2 bending to 1443 cm−1 except for the sample without sucrose added. This result indicates that an interaction has occurred between sucrose molecules and nanoparticles.
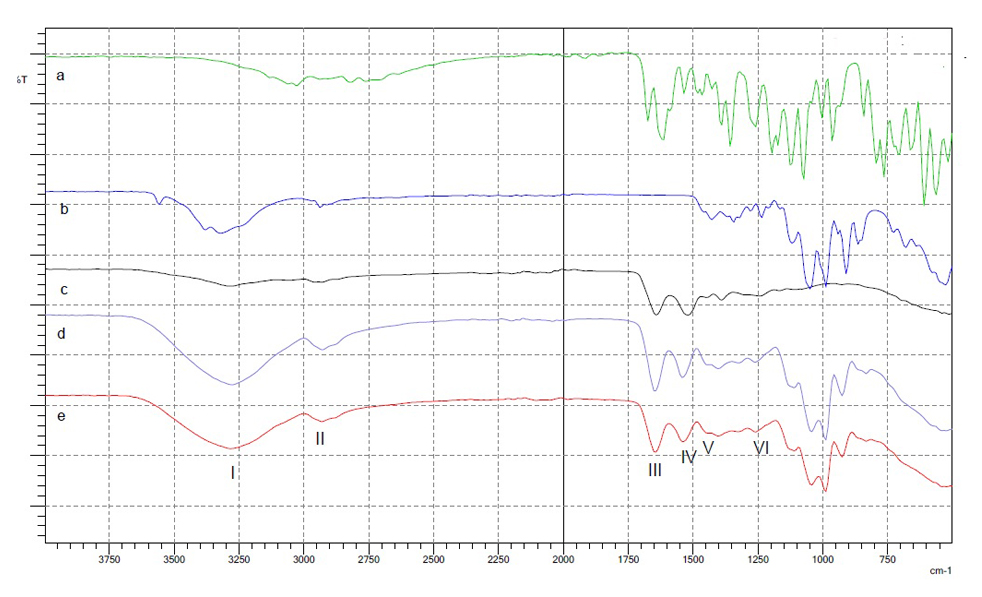 Figure 5. Fourier transform infrared spectra for (a) drug, (b) sucrose, (c) BSA powder, (d) BSA nanoparticles without drug, (e) drug-loaded nanoparticles. The peaks of protein analyzed are (I) Amide A. (II) Amide B, (III) Amide I, (IV) Amide II, (V) CH2 bending and (VI) Amide III.
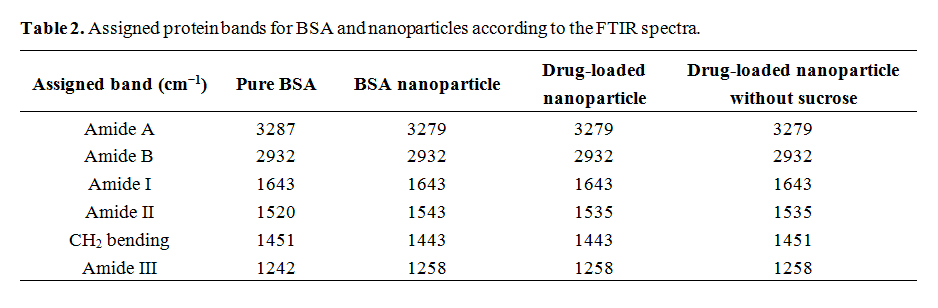 Table 2. Assigned protein bands for BSA and nanoparticles according to the FTIR spectra.
Differential scanning calorimetry monitors the physical property of a substance by using a controlled temperature program. An endothermic peak for SSZ was seen just above 250 °C, corresponding to its melting point (Figure 6). Pure BSA and sucrose exhibited endothermic peaks at 216 and 188 °C, respectively. Thermograms of drug-loaded nanoparticles only showed endothermic peak for BSA with the drug peak non-detectable, which suggested that the embedded drug was in an amorphous state. The interaction between SSZ and BSA was further evidenced by the shift of BSA bands as observed in FTIR analysis (Section “FTIR analysis”), confirming the change in their physicochemical properties (Table 2). The observed BSA endothermic peak corresponds to its thermal denaturation temperature.
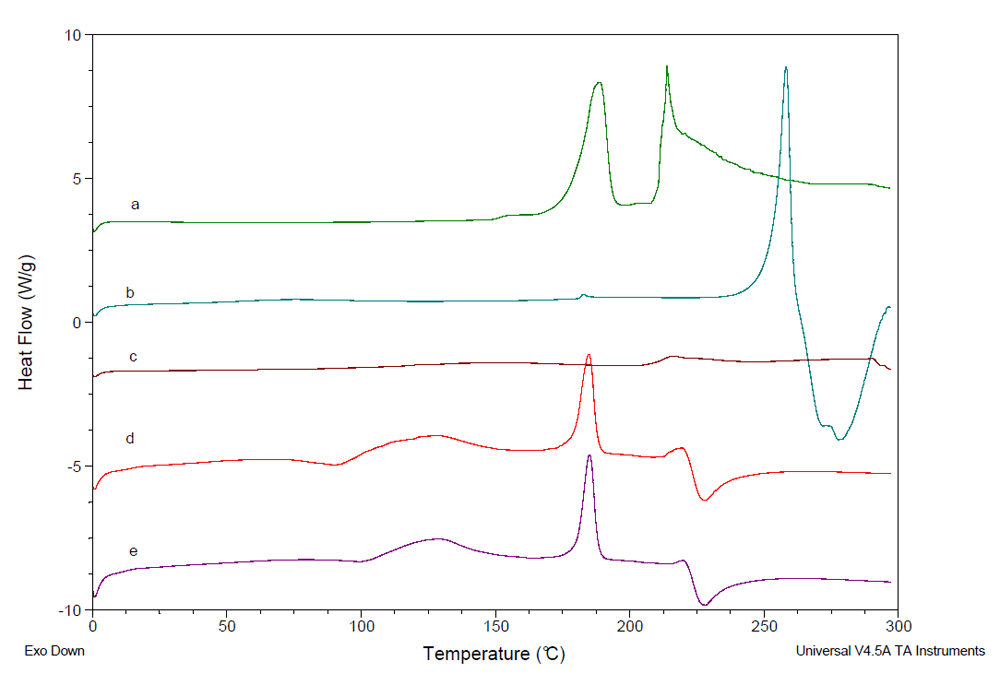 Figure 6. Thermograms as monitored by differential scanning calorimetry using standard mode. (a) Sucrose, (b) drug, (c) BSA, (d) BSA nanoparticles without drug and (e) drug-loaded nanoparticles (with 2%w/w initial drug loading).
Nanoparticles without drug exhibited a higher BSA endothermic peak (219.6 °C) than pure BSA powder. For drug-loaded nanoparticles, BSA peak has shifted to give a higher denaturation temperature (220.1 °C). Hence, the presence of drug has enhanced the thermal stability of the nanoparticles, as the key particle’s matrix was made of BSA. Lack of sugar in the drug-loaded nanoparticles shifted BSA endothermic peak to a lower temperature (185 °C), further confirming the role of sucrose in stabilization of albumin nanoparticles.
Preliminary Drug Release and Solubility DataSulfasalazine has a poor aqueous solubility, which is predicted to be 0.0024 mg/mL [25]. Preliminary tests in the current study showed that the drug solubility increased to 1 mg/mL, confirming that SSZ molecules interact with BSA. The observed enhancement in drug solubilization is also partly due to BSA, which is a water-soluble protein. The result was supported by the changes seen in DSC and FTIR data as discussed above.
The total fraction of drug release was 0.37 after placing the sample at 25 °C for 24 h in dark. For paclitaxel-loaded albumin nanoparticles, the non-cross-linked particles showed a quicker disintegration profile than the cross-linked version [26]. The addition of 8.8 mg GTA in this study during the fabrication process has led to the nanoparticles resistant to disintegration. Hence, the amount of GTA and cross-linking time can be adjusted to modulate drug release.
Sulfasalazine-loaded BSA nanoparticles were prepared successfully by using the desolvation method. The nanoparticles were spherical in shape and the particle sizes ranged between 200 and 400 nm with low PDI values. In neutral pH environment, they exhibited negative zeta potential values that were attributed to both BSA and SSZ. The lyophilized nanoparticles can be easily re-suspended under this condition and these formulations can be administered via the parenteral route.
In this study, the effect of drug loading was investigated, and this factor is found to alter sizes and zeta potential values of the nanoparticles. The maximum drug encapsulation efficiency was 28% when a low TDL was used. The highest ADL was close to 0.5%w/w. The success of drug entrapment was also indicated by the peak shifts in both thermal and infrared analyses. Addition of 2% sucrose added to the nanoparticle formulation has avoided cake collapse but the particle sizes has increased slightly while the PDI values remain low. Thus, lyophilization cycle condition can to be further optimized. Adding sucrose also led to a slight reduction in zeta potential values without exerting a detrimental effect on surface charge of the nanoparticles. Nonetheless, the interaction between BSA and SZZ has provided positive features of the nanoparticles with a higher thermal denaturation temperature. In summary, desolvation technique used in this study has produced stable nanoparticle formulations that are loaded with sulfasalazine. These nanoparticles can be administered as a water-soluble injection with an enhancement in drug solubility.
VO and CSC designed the study. VO performed the experiments and analyzed the data. VO and CSC wrote the paper with input from all authors.
The authors declare that there is no conflict of interest.
This research was funded by University of Sunderland.
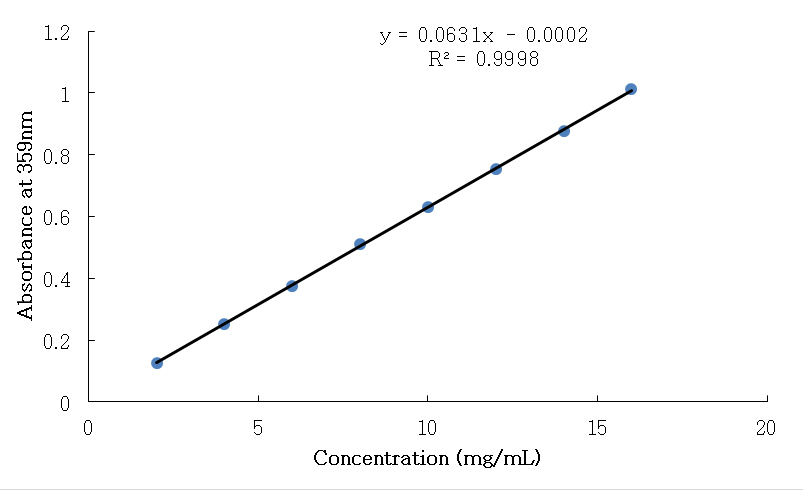 Figure A1. Calibration plot of sulfasalazine. Note: UV measurements of the calibration standards were also performed after storage in dark for at least 24 h and repeated after 5 days. The results were the same, demonstrating the reproducibility of the experimental outcomes.
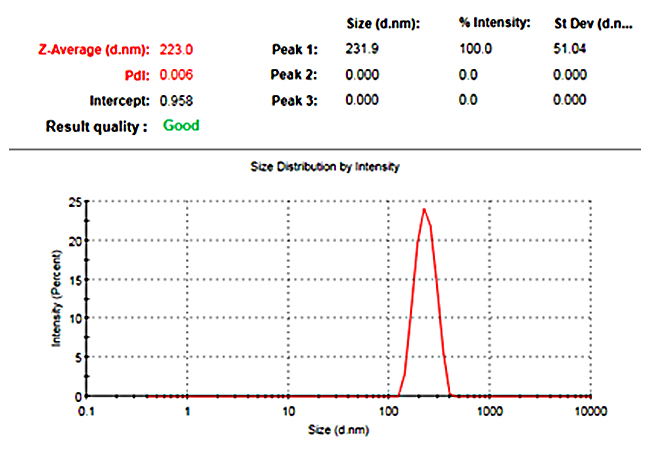 Figure A2. An example of particle size distribution data obtained from DLS analysis.
1.
2.
3.
4.
5.
6.
7.
8.
9.
10.
11.
12.
13.
14.
15.
16.
17.
18.
19.
20.
21.
22.
23.
24.
25.
26.
Olaitan V, Chaw CS. Desolvation Conditions for Production of Sulfasalazine Based Albumin Nanoparticles: Physical Properties. Pharm Front. 2019;1:e190006. https://doi.org/10.20900/pf20190006

Copyright © 2020 Hapres Co., Ltd. Privacy Policy | Terms and Conditions