Location: Home >> Detail
Med One. 2019;4:e190018. https://doi.org/10.20900/mo.20190018

1 Department of Aerospace, Industrial, and Mechanical Engineering, California Baptist University, Riverside, CA 92504, USA
2 School of Engineering and Technology, Central Michigan University, Mt Pleasant, MI 48858, USA
3 Department of Biomedical Engineering, California Baptist University, Riverside, CA 92504, USA
4 Department of Biomedical Engineering, University of Massachusetts, Lowell, MA 01854, USA
* Correspondence: Jinxiang Xi, Tel.: +1-951-552-8084.
This article belongs to the Virtual Special Issue "Nanoparticles in Medicine"
Background: The integration of inhalation drug delivery and nanotechnology offers exciting potentials to enhance the targeting, release, diagnostic, and therapeutic outcomes of drugs. Human lungs provide many advantages over other routers such as noninvasive delivery, a large surface area for absorption, avoiding the first-pass metabolism, and quick therapeutic onset. It is crucial to understand nanoparticle dosimetry in the acinar region to reliably evaluate the therapeutic outcomes of nanomedicines. However, an acinus unit comprises up to 10,000 alveoli and to model a complete acinus is still a prohibitive task. Besides, the presence of inter-alveolar septa creates a labyrinth pathway for inhaled airflow and particles.
Methods: The objective of this study is to numerically investigate nanoparticle deposition in three alveolar models with varying physical complexities, which retain 1, 4, and 45 alveoli, respectively. A discrete-phase Lagrangian model was implemented to track nanoparticle trajectories under the influence of rhythmic wall expansion and contraction. Both temporal and spatial dosimetry in the alveoli were computed.
Results: Strikingly different behaviors were observed in the dynamic alveolar model between micron particles and nanoparticles. Minimal deposition rates were predicted for 500–600 nm particles for all the three models considered. Consistently lower deposition rates were found in the 45-alveoli model than the other two simplified models for all particles ranging from 1 nm to 1000 nm. Considering the gravitational orientation effect, nanoparticles smaller than 200 nm appears insensitive to the alveolar orientation and only becomes perceivable around 500 nm. For nanoparticles larger than 500 nm, lower doses were predicted in the horizontal alveoli than in the vertical alveoli, regardless of the model complexity.
Conclusions: The magnitude of the airflow velocity (depending on ventilated volume) is an essential factor in determining the deposition of inhaled nanoparticles. Future correlation development for acinar deposition should consider the velocity distribution in different regions of the acinus.
Pulmonary delivery of nanomedicines has been extensively studied in recent years because of their enhanced biocompatibility [1,2]. Nanomedicine has many advantages over traditional medicines, such as improved dissolubility, sustained drug release, and surface modification capability. In some circumstances, only medicine in nanometer size can pass the delivery barrier, such as delivering neurological medications to the central nervous system. Pulmonary drug delivery can provide a noninvasive means for local and systemic drug actions. Besides, pulmonary drug delivery can avoid the first-pass metabolism and has a quick onset of therapeutic effect. The surface area of the human lung is around 78 m2, which provides a large area for drug deposition, absorption, and action [3].
Various nanomedicines have been devised in recent years for local and systemic treatments of diseases, which include small molecules, macromolecules, peptide, protein, and genes. For instance, local applications of small molecules were tested to treat respiratory diseases such as chronic obstructive pulmonary disease (COPD) and asthma [4,5]. Protein/peptide delivery to the lung is promising for both local therapies of respiratory diseases and systemic management of thrombosis or diabetes [6]. Targeted pulmonary delivery of genes to the disease site offers great potential for the treatment of genetic lung disorders such as alpha-1-antitrypsin deficiency [7,8], cystic fibrosis [9], and asthma [10].
An alveolar sac is the smallest respiration unit at the end of the respiratory tree and exhibits unique features on its own [11]. Structurally, inter-alveolar septal walls and pores of Kohn exist between neighboring alveoli [12,13]. The effects of these structures on acinar airflow and particle deposition, however, remain unclear. Dynamically, the alveolar airflow is driven solely by the rhythmic wall expansion and contraction, and the alveolar flow rate is entirely passive. Due to the dead-end of the terminal alveoli, both inspiratory and expiratory flows go through the same opening. Moreover, interalveolar septa and pores of Kohn can change in shape and size due to diseases, or aging. Because of such anatomical complexities, most space-filling-based models have excluded the influences of the inter-alveolar septal walls and their apertures.
A number of theoretical and computational studies have investigated airflow and particle deposition in the alveoli. Theoretical analysis of acinar deposition assumed particle diffusion and sedimentation in steady tubular flows, while neglected some critical factors such as geometry details, dynamic walls, and tidal breathing [14–16]. Using numerical methods, Kojic and Tsuda [17] elegantly demonstrated that particle deposition could be significantly underestimated using steady flow solutions to approximate tidal breathing. Kim et al. [18,19] demonstrated that the rhythmic wall motions are essential to match in vivo alveolar deposition data with predictions from the single-path-transport model. Kumar et al. [20] numerically investigated respiratory flows in honeycomb-like alveolar models and found recirculating stream traces in the alveolar airspace. Talaat and Xi [21] simulated particle dynamics in a terminal alveolus with rhythmic wall motions and reported significantly different particle motions from those in respiratory bronchioles or alveolar ducts [22–25]. In a terminal alveolus, the oscillating walls cause a particle to move forth and back, forming a multi-folding trajectory [21]; in a respiratory bronchiole or alveolar duct, particles remain in the alveolar airspace for several cycles, rotating counterclockwise during inhalation and clockwise during exhalation [22,25]. Recent attempts to develop empirical correlations were also reported in alveolar models with varying geometrical complexities for both bolus and continuous breathing conditions [21,25–29]. However, most previous studies have excluded the interalveolar septal walls and apertures (pores) in their models for geometrical simplicity. In addition, reports of nanoparticle transport and deposition in alveolar sacs with moving walls are scarce, possibly due to the numerical challenges in fluid-wall-particle interactions, which include the dynamic mesh, random Brownian motion, multiscale velocities, and multi-physics of forces resulting from and acting on walls, fluid, and particles [30].
Several studies investigated the effects of the gravitational orientation and airway complexity on the alveolar deposition but reported differently. While Sznitman et al. [25] and Haber et al. [22] suggested that the gravity orientation has a strong correlation with deposition efficiencies in the alveolar ducts and space-filling alveolar region, Khajeh-Hosseini-Dalasm and Longest [26] found that the alveolar dosimetry was not sensitive to the gravitational orientation as long as the model contained three generations of alveolar ducts or more. Likewise, several studies [31–33] suggested that the alveolar deposition is strongly related to the geometry complexity, Hofemeier et al. [27] observed that the geometry heterogeneity of the acinus has little impact on particle deposition in those regions.
The objective of this study is to examine the influences of alveolar geometrical complexities on airflow and particle dynamics in the acinar models that retain a different number of alveoli. Specific aims include: (1) to develop a 1-alveolus model, a 4-alveoli model and a 45-alveoli model with asymmetric, rhythmic wall motions, (2) to compare airflows and nanoparticle motions in different alveolar models, (3) to quantify the effect of geometrical complexity on acinar deposition both temporally and spatially, and (4) to quantify the impact of the alveolar orientation on nanoparticle deposition.
A typical adult lung consists of approximately 480 million alveoli. There are more than 10,000 alveoli Even in one acinar unit [11], and it is still prohibitive to develop a complete model of even one single acinar unit. In this study, three alveolar models that retain a different number of alveoli will be used. These models had been previously developed in Xi et al. [28] and represent acinar or alveolar models with varying physical complexities. These include a 1-alveolus model, a 4-alveoli model, and a 45-alveoli model, as shown in Figure 1a–c, respectively. The diameter of a single alveolus is 0.2 mm [11]. To better mimic the in vivo acinar region, inter-alveolar septal walls were also retained in the 4-alveoli and 45-alveoli models. With regular geometry and idealized wall motion, the 1-alveolus model can provide information on the fundamental dynamics of airflow and nanoparticle behaviors in the pulmonary region. The 4-alveoli model is used to study the influences from the septal walls, while the 45-alveoli model to study the impacts of peripheral alveoli.
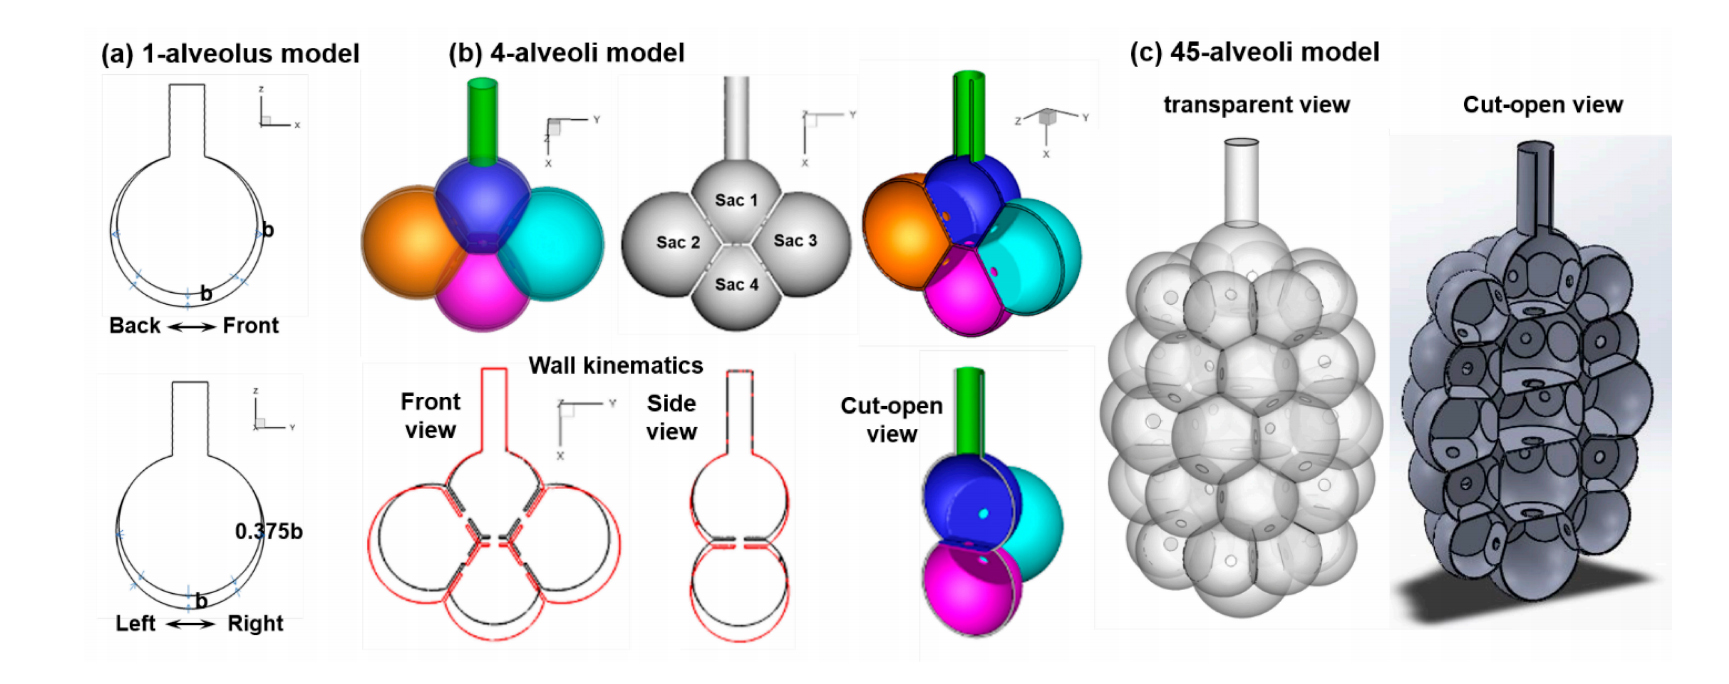 Figure 1. Alveolar models with varying physical complexities: (a) 1-alveolus model with asymmetric wall expansion, (b) 4-alveoli model with transparent, solid, cut-open views (upper), and wall kinematics (lower), and (c) 45-alveoli model with transparent and cut-open views.
The rhythmic expansion and contraction of the alveolar wall were assumed to follow the chest [34,35], which moves a longer distance in the head-foot (x) and back-front (y) directions than the arm-arm (z) direction (i.e., x:y:z = 1:1:0.375). A constant ratio of the tidal volume (VT) to the functional residual capacity (FRC) of 23.3% was used (i.e., VT/FRC = 0.233) to represent the normal breathing condition [36]. In-house code was written to specify the rhythmic wall expansion and contraction (Figure 1b). More details of the alveolar wall kinematics can be found in Talaat and Xi [21].
Study DesignThere can be 10,000 alveoli in one single acinar unit [11]. To understand particle transport and deposition in these regions, we started with an idealized 1-alveolus alveolar model that consists of a cylinder and sphere to represent the terminal alveolar sac. Rhythmic wall expansion and contraction following a sinusoidal waveform will be specified, which draws in and pushes out air through one opening (the top end of the cylinder). Nanoparticles of varying sizes will be released at the beginning of the inhalation and tracked multiple respiration cycles until they either deposit or are exhaled out of the geometry. Airflow and particle dynamics will be examined; the resultant deposition of nanoparticles will be quantified both temporally (dynamic deposition growth) and spatially (local deposition). The advantage of this over-simplified model is that it captures the fundamental physics related to oscillating flows in a single dynamics alveolar sac and can provide us a better understanding of nanoparticle behavior and fate in the very end alveolus.
We then proceed to study the effect of multiple alveoli on respiratory airflow and nanoparticle deposition by retaining four alveoli, which are separated by septal walls and communicated by pores of Kohn on these walls. This increased complexity in geometry can help us understand the collateral ventilation between alveoli and their effect on nanoparticle transport and deposition. The more complicated interactions between Brownian-motion-driven nanoparticles and the moving septum-braced acinar framework can also be examined.
A more anatomically accurate model will then be implemented that contains 45 alveolar sacs. Airflow and particle deposition in this model will be compared to the 1-alveolus and 4-alveoli models to better understand the effects of geometrical competitivity on nanoparticle deposition. Results will help us to determine whether it is feasible to use simplified alveolar models for inhalation dosimetry predictions, as most previous studies practiced.
In each of the three models, to understand the particle behaviors, particle motions will be visualized, and their instantaneous speeds will be compared against the speeds of the dynamic wall and respiratory airflow. To study the effect of Brownian motion, particles ranging from 1 nm to 1000 nm will be simulated. To study the effect of alveolar orientation, two directions relative to the gravity will be simulated. The effect of model complexity will be examined by comparing the simulation results among the three models, wherever appropriate in this study.
Airflow and Nanoparticle Transport ModelsIncompressible and isothermal airflow was assumed in this study. Based on the airflow speed of 0.3 mm/s and a characteristic length of 0.2 mm, the Reynolds number is around 0.004, indicating a laminar flow regime. Particles ranging from 1 nm to 1000 nm in diameter were investigated. For each case, multiple breathing cycles (5–6) were simulated, with the first cycle to establish the transient flow field in the alveolar airspace. To simulate the inhalation of a bolus of nanomedicines, a group of 10,000 particles was released into the duct at 0.20 s at the second cycle; these particles were tracked until all deposited on the alveolar wall or exited the alveolar model. Based on the particle size ranging from 1 to 1000 nm, the Peclet number (Pe), which is the ratio of convection to diffusion, ranges from 0.01 to 2618. For 10-nm and 200-nm particles, Pe equals 1.1 and 262, respectively. Special attention was paid in the behaviors and fates of these two aerosols, as the first reacts equivalently to convection and diffusion, while the second represents the typical size of inhalation nanomedicine.
A discrete-phase Lagrangian tracking model was applied to follow the particle paths [37,38]. This model, enhanced with the near-wall treatment algorithm [39], has been demonstrated in our previous studies to agree with experimental deposition results in the extratropic airway for both nanoparticles [40] and micron aerosols [41,42]. The transport governing equations can be expressed as:
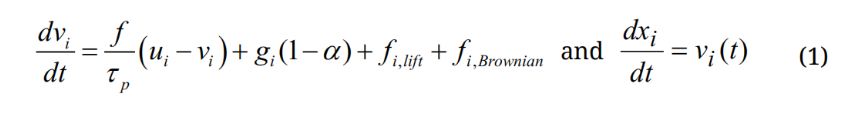
Here vi and ui are the local velocity of the particle and fluid, gi is the gravity, and τp is the particle relaxation time expressed as τp = Ccρp dp2/18µ, where Cc is the Cunningham correction factor for nanoparticles [43]. The drag factor f is computed from the expression of Morsi and Alexander [44]. The effect of Brownian motion on nanoparticle trajectories is considered as an additional force per unit mass term at each time-step:
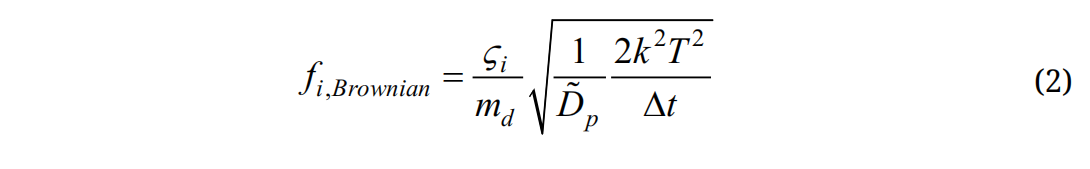
where is a random number generated from Gaussian probability function, md is particle mass, and Δt is the time-step. The diffusion coefficients is calculated using the Stokes-Einstein equation:
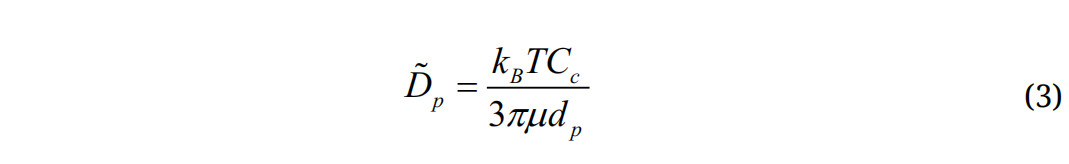
where kB is the Boltzmann constant (=1.38×10⁻¹⁶ cm2g/s) and T is the alveolar temperature. The deposition fraction (DF) is calculated as the ratio of the number of deposited particles over the number of particles entering the alveolar region.
Numerical MethodsANSYS Fluent (Canonsburg, PA, USA) with the discrete phase model and dynamic mesh was implemented to compute the tidal airflow and particle dynamics. In-house C and Fortran codes were developed to generate injection particle files, define alveolar wall motions, calculate Brownian motion force, and quantify spatial and temporal deposition fractions [45,46]. ANSYS ICEM CFD (Ansys, Inc., Canonsburg, PA, USA) was used to generate the mesh. One-way coupling from the airflow to the nanoparticles was included. A grid-independent study was performed by testing different mesh sizes. Mesh-independent results were assumed when the discrepancy between the flow velocities with two consecutive mesh densities was smaller than 1%. The final alveolar model contained 1.2 million cells. Minitab analysis software (State College, PA, USA) was used to investigate variability in deposition results.
The velocity field in the alveolar models at the peak inhalation flow rate is shown in Figure 2 in different alveolar models. Inspiratory airflows in the simplest model geometry with one terminal alveolus are displayed in Figure 2a. Like an inflating air balloon driven by expanding walls, airflow is sucked in via the duct opening by the vacuum pressure. The speed of the airflow decreases quickly in the alveolus due to the abrupt increase in the airspace. In this study, a tidal volume of 0.233 was used. For a respiration period of 3 s and alveolus diameter of 0.2 mm, the speed of the alveolus wall is at the magnitude of 0.1 mm/s. The airflow speed is also very low, at the magnitude of 1 mm/s. As a result, the flow in this model should be predominantly laminar. Moreover, the jet effect from the inlet diminishes as the airflow moves towards the bottom.
The airflow in the 4-alveoli model becomes more complex due to the presence of inter-alveolar septal walls and apertures (Figure 2b). Inhaled airflow needs to negotiate through the interalveolar septal apertures (pores) to reach the peripheral alveoli, leading to the vena contracta effect that will enhance the convection and mixing of inhaled aerosols. Collateral ventilation occurs, with a small fraction of airflow moving from the bottom alveolus to the two lateral alveoli.
Even more complex flow patterns arise in the 45-alveoli model, with cascading flows from the duct inlet to the peripheral alveoli (Figure 2c). For a given tidal volume of 23.3% FRC, more airflow will be drawn in during inhalation in the 45-alveoli model due to larger total volume expansion. As a result, airflow with higher speeds prevails in the alveolar duct and proximal alveoli in the 45-alveoli model than the other two simplified models. This difference can be evidenced by the different scales used for the velocity contour used in Figure 2a–c for the 1-alveolus model, 4-alveoli model, and 45-alveoli model, respectively.
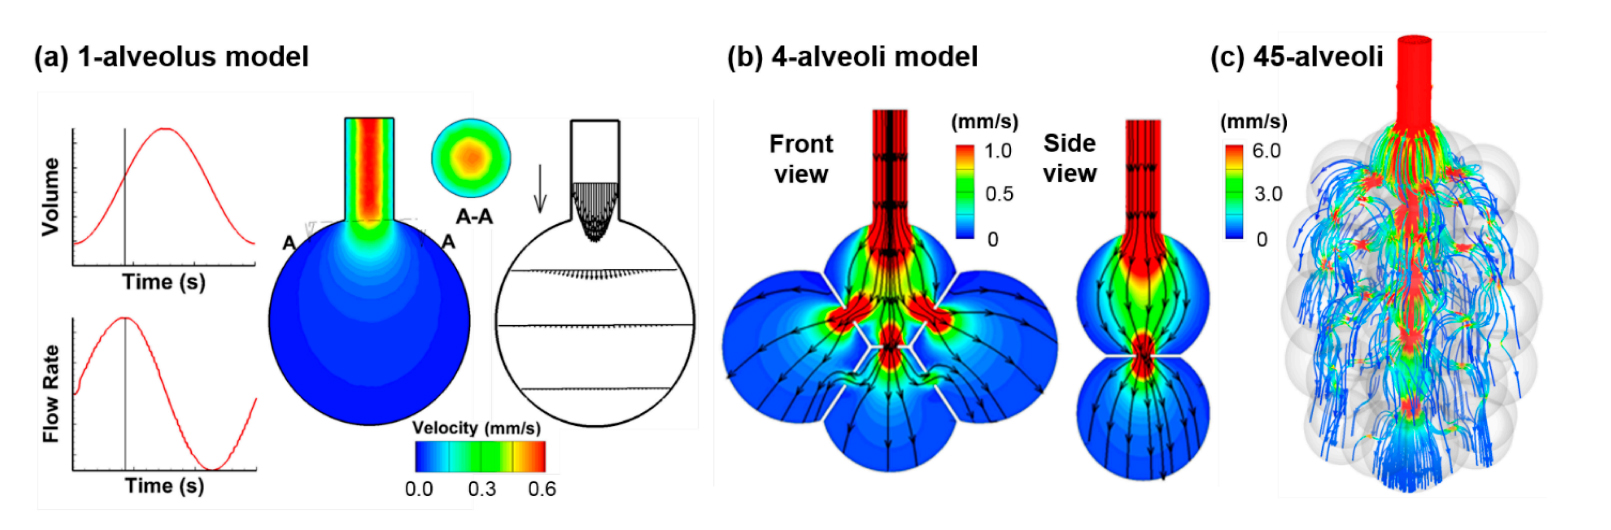 Figure 2. Peak inspiratory velocity fields for (a) 1-alveolus model, (b) 4-alveoli model, and (c) 45-alveoli model.
One salient feature of a nanoparticle is its high diffusivity and resultant Brownian motion in the airspace. It is of interest to quantify the instantaneous random speeds of the particle relative to the local airflow speeds to understand the relative deposition contributions from the diffusion and convection. Figure 3a,b shows the trajectories of two 200-nm particles released into a rhythmically moving alveolus from the middle of the alveolar duct. For comparison purposes, the trajectories of micrometer particles in a rhythmically moving alveolus are presented in Figure 3c. Striking discrepancies are observed in the motions between the nanoparticles and micrometer particles. Due to the lack of diffusivity, micrometer particles closely follow the oscillating airflow during respiration and display well-defined folding trajectories, with one-fold representing one respiration cycle (Figure 3c). In contrast, random motions arise for both nanoparticles. Even though released from the same position, these two nanoparticles follow two distinct paths due to the instantaneous collisions with surrounding air molecules. The first nanoparticle enters the alveolus and deposit onto the alveolar bottom wall after two respiration cycles (Figure 3a), while the other nanoparticle enters the alveolus in the first cycle and leaves the alveolus with the exhalation flow at the end of the second cycle (Figure 3b). It is noted that a rhythmic wall motion is essential for the trajectories shown in Figure 3. Without it (and hence in a stagnant flow), the 200-nm nanoparticles will suspend in the proximity of their release positions and deposit onto the alveolar duct wall due to Brownian motion (figure not shown).
Another difference between the nano- and micrometer particles is the time needed for them to deposit. While it takes two cycles to reach the alveolar wall for nanoparticles, it takes more than five cycles for the micrometer particles. This can be partially attributed to the large random velocity of the nanoparticles, which is one order magnitude higher than the oscillating main flow speed, as illustrated by comparing the reference velocity (5 mm/s) of particles in Figure 3a, in contrast to the velocity range of 0–0.6 mm/s in Figure 2a. Therefore, diffusion is predominant over the concurrent convection for 200-nm particles and will be even more significant for smaller particles. It will also be shown in later sections that gravitational sedimentation also becomes non-negligible for 200-nm particles and will quickly increase in its contribution to both total and local depositions.
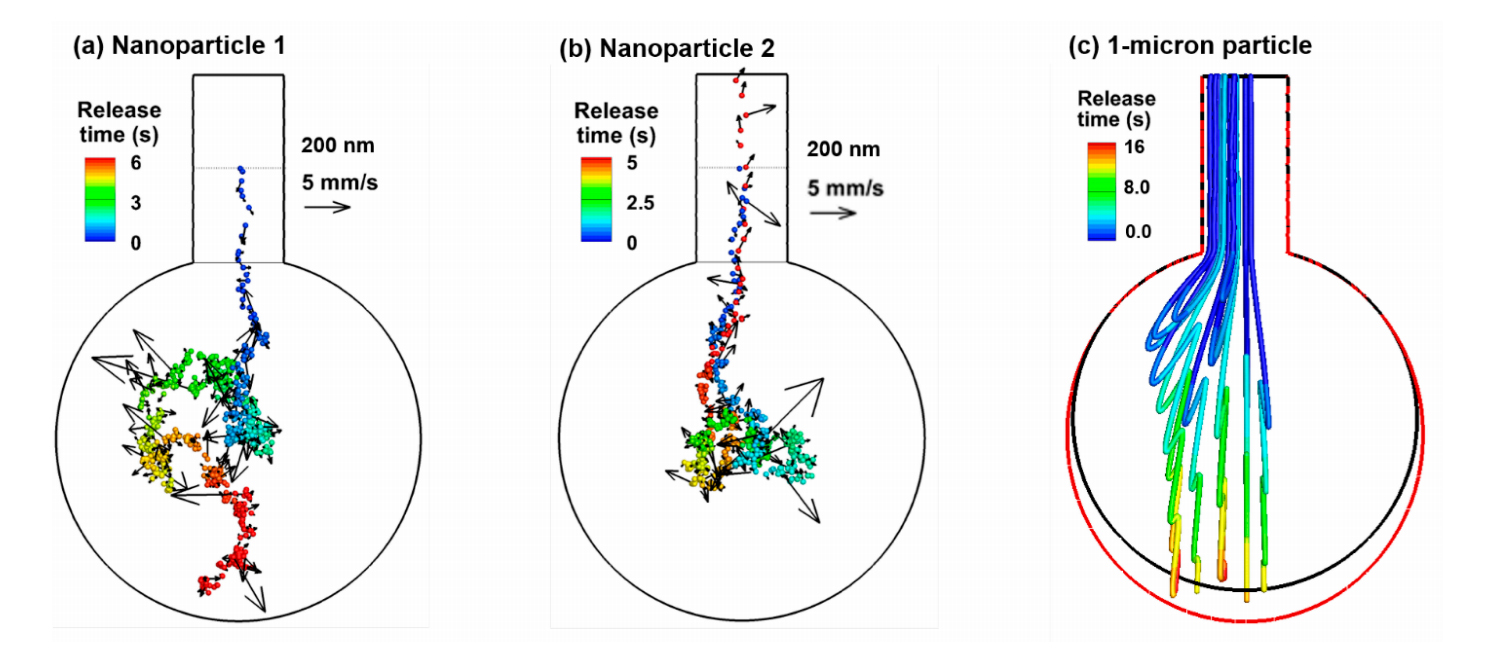 Figure 3. Particle trajectories in a rhythmically expanding/contracting alveolus: (a) one 200-nm particle released at the beginning of the inhalation from the middle of the alveolar duct, (b) another 200-nm particle released from the same position, and (c) 1-µm particles released from the inlet of the alveolar duct. Particles were colored by the time after their release. Brownian motions appear predominant for 200-nm particles in the 1-alveolus model.
Nanoparticle trajectories in the 4-alveoli and 45-alveoli models with dynamic wall motions are shown in Figure 4a,b, respectively. Like in the 1-alveolus model, inhaled nanoparticles can deposit onto the alveolar walls or be exhaled out, even released from the same location. However, due to the presence of inter-alveolar septal walls, chances for random-moving nanoparticles to collide with the walls increase. In the left panel of both Figure 4a,b, the 200-nm nanoparticles are conveyed into the bottom alveolus by the inspiratory airflow, while they deposit in the wall after only one respiration cycle. Due to the higher speeds of the mainstream flows in the 4-alveoli and 45-alveoli models, the importance of convection increases relative to the diffusion. Nanoparticles that are transported along the mainstream flow direction still have large chances to be exhaled out of the alveolar geometry (right panels in Figure 4a,b). This effect is more pronounced in the 45-alveoli model, where the main flow speed is equivalent to the instantaneous particle speeds (i.e., 5–6 mm/s). The right two panels in Figure 3b show two nanoparticles that escape the filtration of the alveolar framework within the first inhalation cycle, despite a highly complex alveolar structure. This is because of the relatively large effect from the convection flow, whose direction is consistent and changes in a period of 3 s, while the direction of the instantaneous particle speed changes much faster, which does not allow particles to move enough long distance in any specific directions. This may partially explain the lower deposition rate in the 45-alveoli model than the two simplified models that will be presented in later sections.
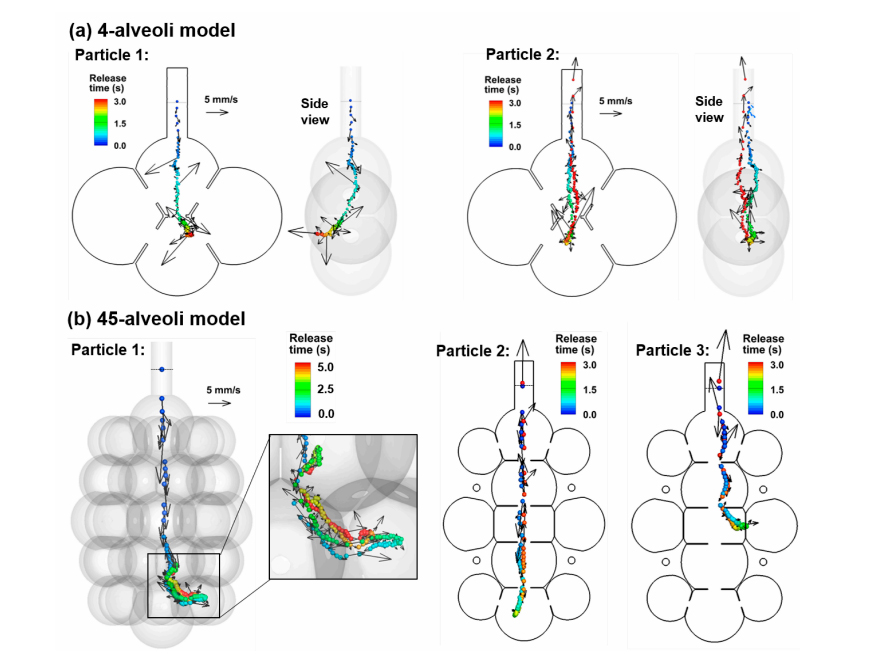 Figure 4. Particle trajectories in rhythmically expanding/contracting multi-alveoli models: (a) 4-alveoli model, and (b) 45-alveoli model. Particles were colored by the time after their release. Instantaneous particle speeds were plotted for the two nanoparticles with their magnitudes scaled to the reference vector (5 mm/s). The convective effect can be equivalent to the Brownian motion effects for 200-nm particles in the 45-alveoli model.
When a bolus of nanoparticles is released into the alveolar models, the collective behavior of the aerosols is visualized by snapshots of particle positions at varying instants during the first two respiration cycles (Figure 5a). The snapshots of micrometer particles at two corresponding instants (T = 4.00 s and 5.20 s) are also plotted in Figure 5b, which exhibit well-defined aerosol fronts in contrast to the highly dispersive aerosol distributions of the nanoparticles. The airflow in the rhythmically moving alveolus appears reversible for most of the respiration cycle, as demonstrated by the stable streamlines which approximately remain in the same position and reverse their directions during exhalation. Recirculating flows are only spotted at the end of the inhalation when the alveolar wall comes to a stop, and the airflow is very slow. However, apparent irreversibility exists in the nanoparticle profiles, which is elicited by the strong mixing between inhaled nanoparticles and the residual air in the alveolus. This irreversibility is more significant in the alveolus than in the duct, and in regions with slow-moving flows (i.e., 1-alveolus model) than fast-moving flows (i.e., 4-alveoli and 45-alveoli models). Due to this aerosol irreversibility, the number of particles that can be exhaled will be reduced, considering that particles are evenly distributed within the alveolus while only a small fraction (i.e., 23.3%) of airflow in the alveolus will be exhaled out during normal tidal breathing. Nanoparticles that remain in the alveolus will eventually deposit due to either Brownian motion or gravitational sedimentation. From Figure 5a, the random motion distributes the nanoparticles throughout the alveolus; in addition, the particle distribution appears more uniform in the second cycle than the first cycle.
Particle behaviors in more complex multi-alveoli models are visualized in Figure 6 with snapshots of particle positions at varying instants. Surprisingly, relatively well-defined aerosol fronts are observed during the first inhalation cycle (T = 3.24–4.14 s). This is because of the high speed of airflow in the axial direction of the alveolar duct and sac, which gives rise to an equivalently (or more) important convective effect as (than) the diffusion. It is reminded that both the peak flow speed and the random particle motion is around 6 mm/s. However, the mainstream flow changes its direction every 1.5 s (half of the respiration cycle), while the instantaneous particle velocity changes its direction at a much higher frequency and particles do not have enough time to change their trajectories noticeably. As a result, nanoparticles closely follow the mainstream flow during the first cycle, not only exhibiting a clear aerosol front, but also advancing much faster in the axial direction than in the lateral directions (upper row, Figure 6). During exhalation (T = 5.04–5.54 s), particles continue to mix with the residual air, while some particles in the proximity of the inlet are entrained by the expiratory flows and exhaled out of the geometry. Further particle convection into the peripheral alveoli, as well as subsequent particle-air mixing, continues in the second inhalation cycle, promoting more particle deposition during their courses (T = 6.14–6.64 s). It takes more than five respiration cycles for the majority of particles to complete their deposition (T = 18.0 s).
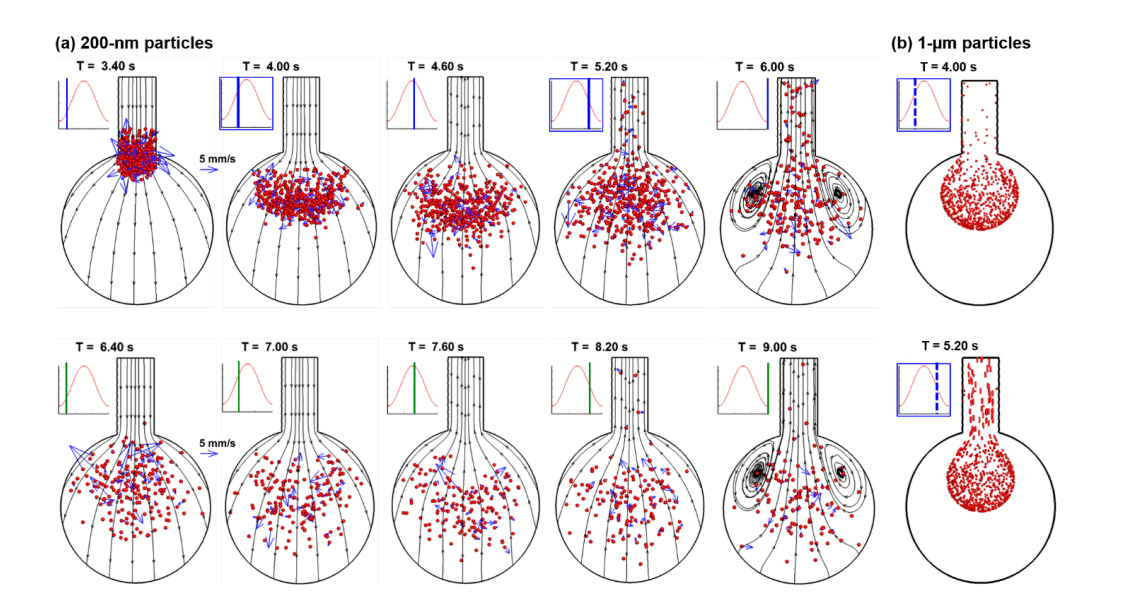 Figure 5. Instantaneous snapshots of particle positions in the 1-alveolus model during the first two cycles after particles being released at the beginning of the inhalation cycle (T = 3.20 s): (a) 200-nm particles in comparison to (b) 1-µm particles [21]. Particles mix with the residual air in the alveolus, inducing particle dispersion and irreversibility. Some particles exit the geometry with expiratory airflow. There are well-defined aerosol fronts of the micrometer particles in comparison to the highly dispersive aerosol distributions of the nanoparticles.
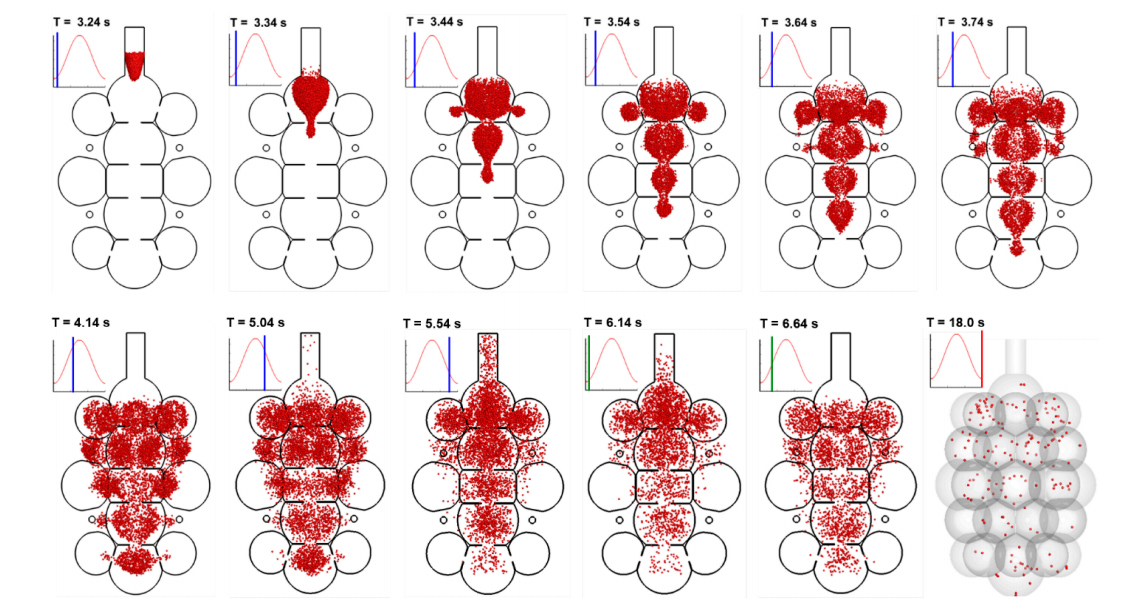 Figure 6. Instantaneous snapshots of particle positions in the 45-alveoli model after particles being released at the beginning of the inhalation cycle (T = 3.20 s). Particles were 200 nm in diameter. It takes more than 5 respiration cycles for the majority of particles to complete their deposition.
The time evolution of nanoparticle deposition in rhythmically moving alveolar models is shown in Figure 7a–c for the 1-alveolus, 4-alveoli, and 45-alveoli models, respectively. Two particle sizes, 10 nm and 200 nm that are representative of the upper and lower limit of nanomedicines, are compared (upper vs lower rows in Figure 7). Significant impacts are noted from the complexity of the model geometry on the time variation of deposition. First, the deposition fraction (DF) in the alveolar duct (dotted black line in Figure 7) decreases persistently with increasing geometry complexity for both aerosols considered, presumably due to the decrease of the surface area ratio of the duct relative to the total area. Second, the DF in the alveolar sac (solid red line in Figure 7) is lower (30–35%) than those in the 4-alveoli and 45-alveoli models, both of which are close to ~50% for 10-nm particles. The fraction of particles that exit the geometry (solid blue line in Figure 7) increases with the increasing complexity of the model geometry.
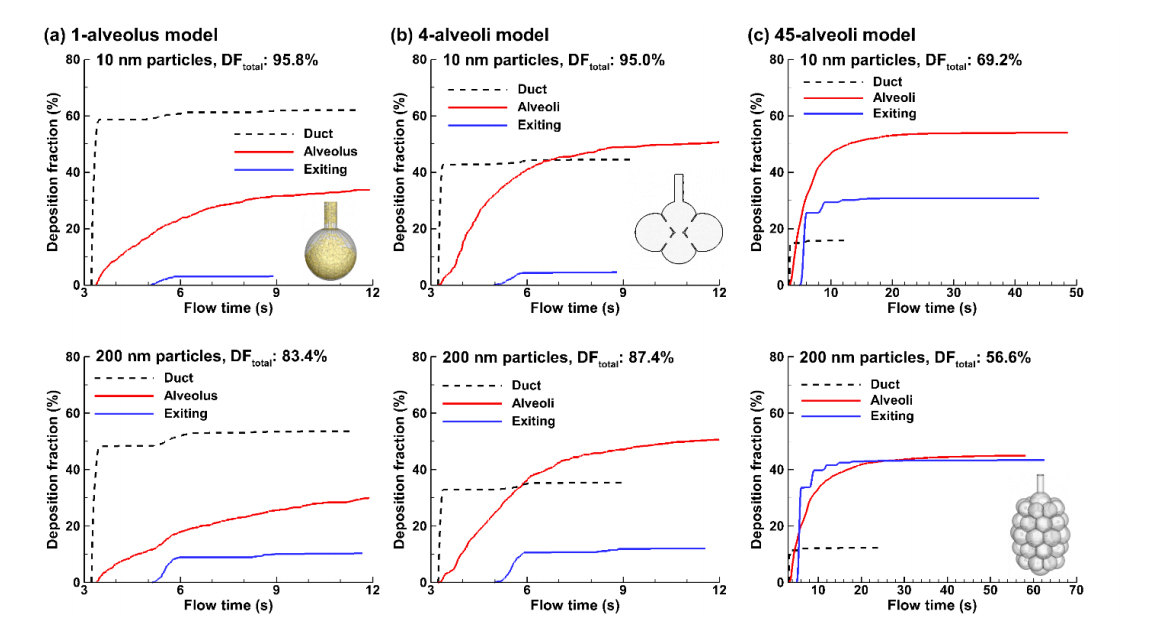 Figure 7. Sub-regional deposition for 10-nm and 200-nm aerosols as a function of time in (a) 1-alveolus model, (b) 4-alveoli model, and (c) 45-alveoli model.
To investigate the effect of nanoparticle size on the alveolar deposition, Figure 8a compares the deposition distributions in the idealized 1-alveolus model among four particle sizes (10 nm, 200 nm, 500 nm, and 800 nm). Similar deposition patterns are found between 10-nm and 200-nm particles (Figure 8a), even though the 200-nm aerosol gives rise to a lower total deposition rate (Figure 8b). For 500-nm particles that have the lowest DF, fewer particles are observed in the alveolar duct. Also, there are more particles depositing at the bottom of the alveolar wall, indicating an increasing impact from the gravitational sedimentation. For the same reason, a significant fraction of 800-nm particles deposit at the alveolar bottom wall. Interestingly, DF in the duct constantly decreases with increasing particle size, while DF in the alveolus slightly decreases in the range of 1–500 nm and then increases quickly in the range of 600–1000 nm.
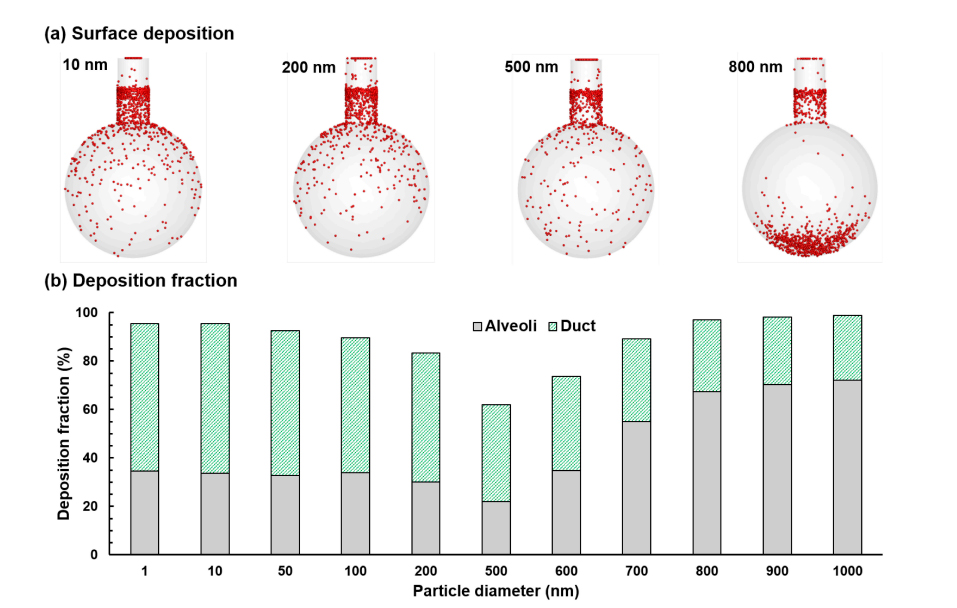 Figure 8. Nanoparticle deposition in the 1-alveolus model: (a) surface deposition for particle sizes of 10 nm, 200 nm, 500 nm, 800 nm, and (b) deposition fraction (DF) vs particle size ranging from 1 nm to 1000 nm.
The effect of particle size on the deposition of nanoparticles in the 4-alveoli model is shown in Figure 9. For particles of 10 nm and 200 nm, the deposition distributions look very similar, both exhibiting local accumulations in the alveolar duct and inter-alveolar septal walls, as well as scattering distributions on the surfaces of the four alveoli (Figure 9a). As particle size increases, the deposition on the alveolar surfaces shifts down along the gravitational direction to the bottom of the alveoli. The deposition fractions in the alveolar duct and alveolar sac are shown in Figure 9b as a function of particles size ranging from 1 nm to 1000 nm. As particle size increases, the deposition in the duct persistently decreases while the deposition in the alveoli largely keep unchanged till 600 nm and increases drastically after that. The total deposition fraction reaches its minimum for particles with a size of 600 nm.
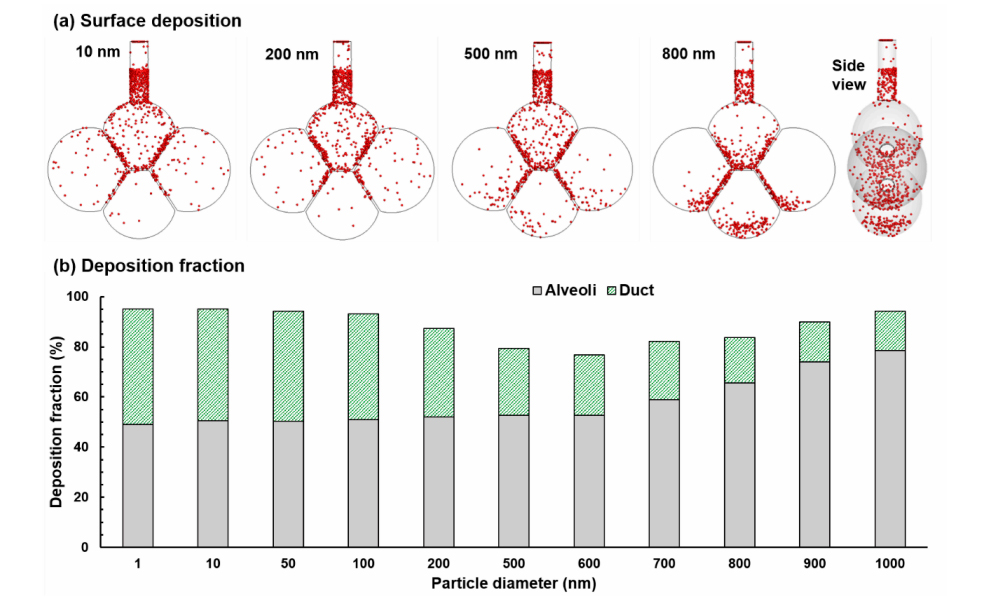 Figure 9. Nanoparticle deposition in the 4-alveoli model: (a) surface deposition for particle sizes of 10 nm, 200 nm, 500 nm, 800 nm, and (b) deposition fraction vs particle size ranging from 1 nm to 1000 nm.
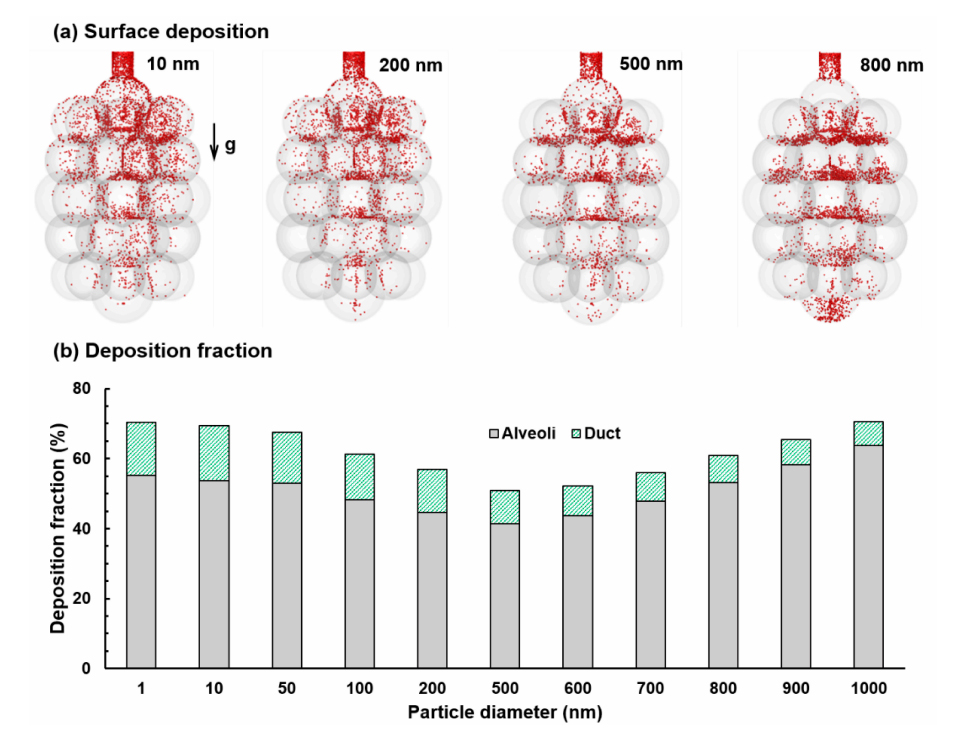 Figure 10. Nanoparticle deposition in the 45-alveoli model: (a) surface deposition for particle sizes of 10 nm, 200 nm, 500 nm, 800 nm, and (b) deposition fraction vs particle size ranging from 1 nm to 1000 nm.
Figure 10 shows the effect of particle size on the deposition of nanoparticles in the 45-alveoli model. Compared to the 4-alveoli in Figure 9, at least three differences are noteworthy. First, the total deposition in the 45-alveoli model is lower than that in the 4-alveoli model for each particle size considered. This may come from the higher mainstream velocity in the 45-alveoli model, as well as the elevated convection effect and suppressed aerosol mixing driven by the diffusion. Second, the ratio of the alveoli deposition over the total deposition is much higher in the 45-alveoli model, possibly owing to the much higher ratio of the surface area of the alveoli to the total area.
Some similarities are also noted between these two model geometries. As particle size increases from 500 nm to 1000 nm, the DF increases quickly, which is similar to that in the 4-alveoli model. Likewise, the DF in the duct of the 45-alveoli model also decreases persistently with the particle size (Figure 10b).
Particle Deposition: Effect of Alveolar OrientationTo investigate the effect of the orientation of the alveoli relative to gravity, deposition patterns in alveolar models with varying complexities in the horizontal direction were simulated and compared in Figure 11. The upper row shows the deposition distributions for 200-nm particles, where no apparent difference is found from those in the three alveolar models in the vertical direction (Figure 11 vs Figures 8–10). By contrast, significant differences between vertical and horizontal alveolar models arise for 800 nm particles (lower panel in Figure 11 vs Figures 8–10). A considerable number of particles accumulate in the lower regions of the alveoli that are immediately downstream of the duct opening.
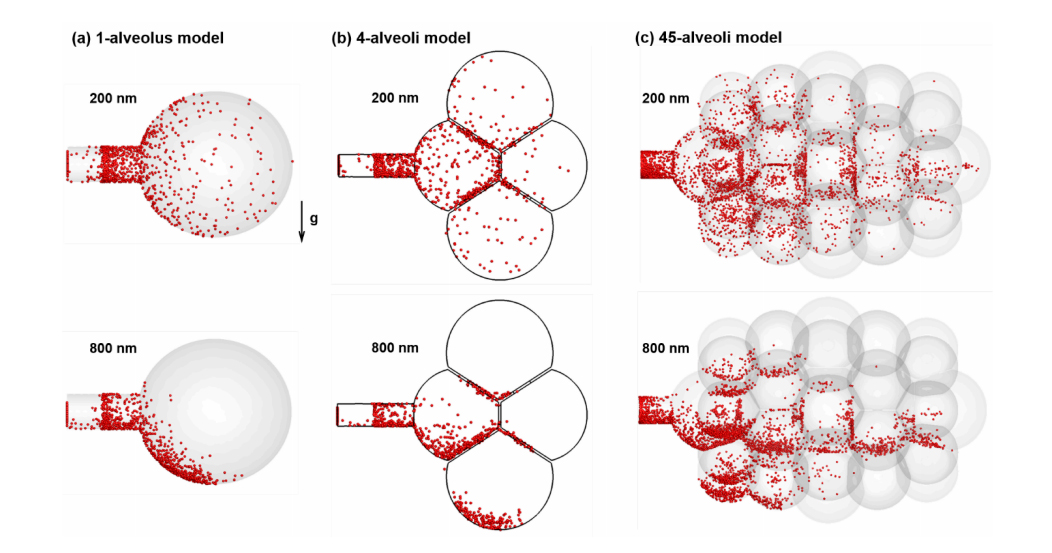 Figure 11. Deposition distributions for 200-nm and 800-nm aerosols in different alveolar models in the horizontal direction: (a) 1-alveolus model, (b) 4-alveoli model, and (c) 45-alveoli model.
Comparison of nanoparticle deposition between vertical (0°) and horizontal (90°) alveolar models is shown in Figure 12. For all the three alveolar models considered, there are insignificant differences in DF between the vertical and horizontal alveolar sac for particles ranging 1–200 nm, indicating negligible effects from the gravitational sedimentation for nanoparticles smaller than 200 nm. The minimal deposition is found for particles at 500–600 nm, regardless of the geometrical complexity. Consistently lower DF is predicted in the horizontal alveolar model for particles larger than 700 nm than in the vertical model for all models considered. However, this difference is most remarkable in the 45-alveoli model, which has the highest structural complexity. Diffusion is independent of direction while sedimentation is sensitive to the direction of the gravity. Changing the 45-alveoli model from the vertical to horizontal direction modifies the interplay between gravitational particles and the alveolar structure, which is very different between axial (z) and lateral (x) directions (Figure 12c).
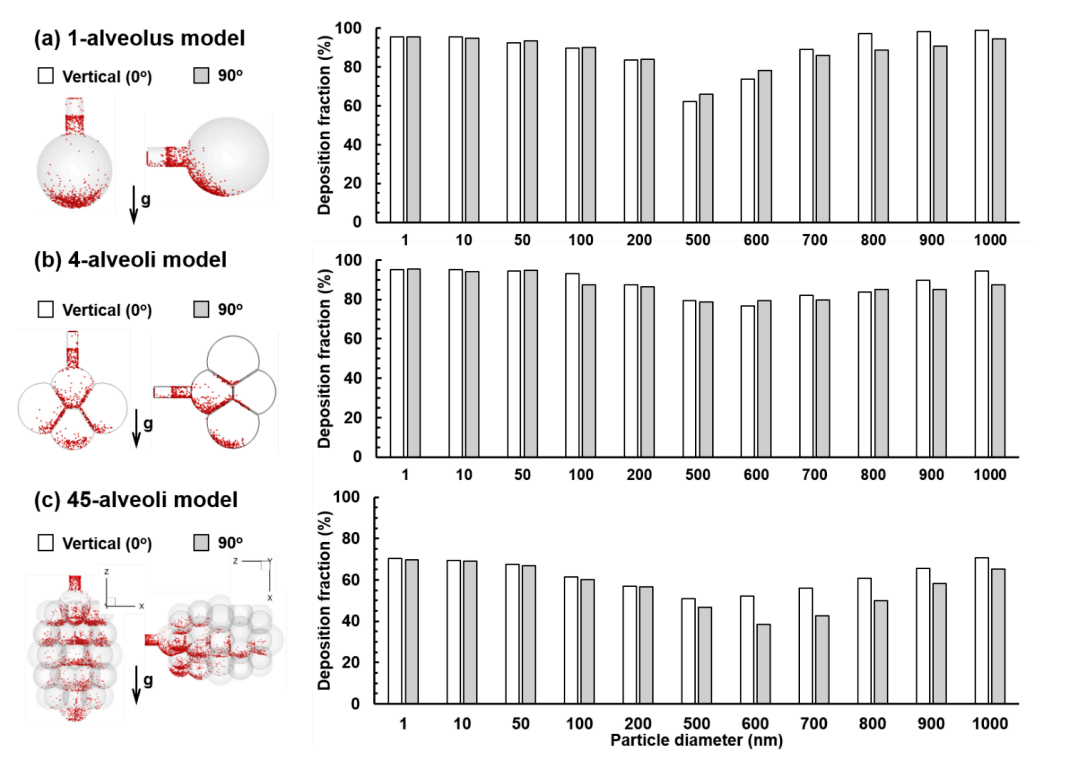 Figure 12. Comparison of nanoparticle deposition between vertical (0°) and horizontal (90°) alveolar models with varying complexities: (a) 1-alveolus model, (b) 4-alveoli model, and (c) 45-alveoli model.
Nanoparticle deposition in pulmonary alveoli is unique for several reasons: the micrometer-scale size of the alveoli, the labyrinth framework communicated through the septal aperture, the rhythmic moving wall, and the Brownian motion of nanoparticles. Multiscale velocities exist during the interactions among the moving wall, airflow, and particles. For a given tidal volume (23.3% of FVC) and respiration rate (3 s per cycle), the peak velocity is around 0.06 mm/s for the alveolar wall, 0.6–6.0 mm/s for the airflow, and 5 mm/s for 200-nm particles (Figures 3 and 4). Depending on the number of alveoli retained in the model, the peak velocities differ, being 0.6 mm/s in the 1-alveolus model, 1 mm/s in the 4-alveoli model, and 6 mm/s in the 45-alveoli model. Different mechanisms are associated with these velocities. The lowest speeds of wall motion promote gravitational sedimentation, the highly varying airflow speeds induces heterogeneous ventilation particle convection, while the particle random motion speeds determine the level of their mixing with the surrounding air. It is also noted that the motion of the airflow and particles have different frequencies, with the airflow reversing its direction every 3 s, while the particles constantly change their directions (and speed magnitude) due to intermolecular collisions. As a result, even though the instantaneous particle speeds can be higher than that of the carrier flow, they do not lead to significant motion in any particular direction. In contrast, airflows persist in one direction during either inhalation or exhalation, causing gas ventilation and particle convection in a specific manner dictated by the alveolar structure.
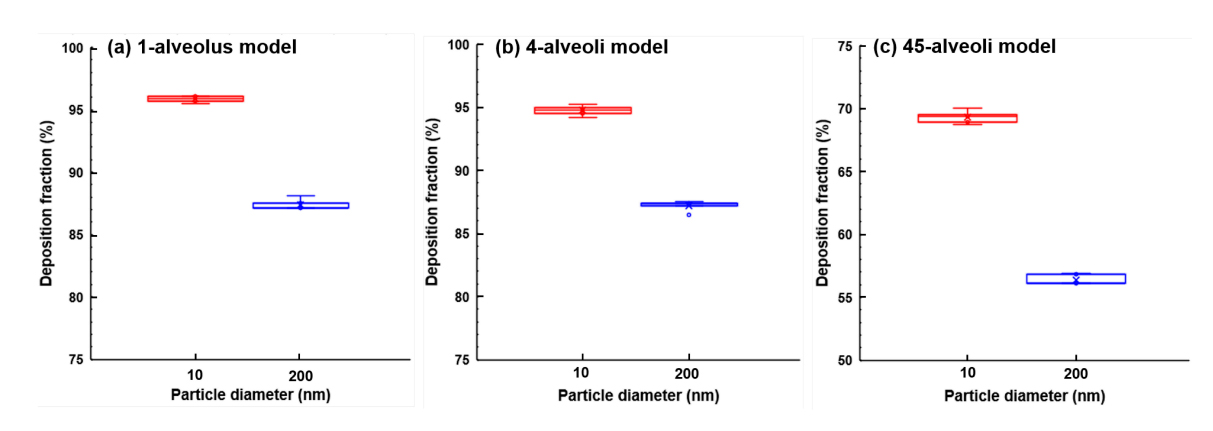 Figure 13. Deposition variability for 10-nm and 200-nm aerosols in vertical alveolar models with varying complexities: (a) 1-alveolus model, (b) 4-alveoli model, and (c) 45-alveoli model.
Considering the stochastic nature of the Brownian motion of nanoparticles, variability in the alveolar deposition is expected. Deposition variability for 10-nm and 200-nm aerosols has been quantified by repeating the simulations five times with identical initial and boundary conditions. In this sense, the deposition fraction is a statistical result of numerous particles, which may vary each time of simulation but shall converge a value given a sufficiently large number of sampling particles or simulation tests. In this study, 10,000 particles were tracked in each test. The DF variability is shown in Figure 13, which is small enough (±1%) for each of the three models herein.
Effects of Particle Size on Nanoparticle DepositionDifferences in the behavior and fates between nano- and micrometer particles in the alveolar region are briefly presented here. For respirable micron particles (1–3 µm) with no significant diffusivity, they closely follow the airflow, which often leads to a well-defined aerosol front, as shown in Figure 5 [21]. The deposition patterns of micron particles are also more localized, which concentrates on the interalveolar septal walls and the bottom of the alveoli. In contrast, nanoparticles exhibit more dispersed patterns in both transport and deposition. The smaller the particle, the higher the degree of dispersion will be. The random motions of nanoparticles greatly enhance their mixing with the residual air and lead to varying degrees of aerosol irreversibility specific to the nanoparticle size.
Sub-regional deposition rates are found to be sensitive to the size of nanoparticles. The progressive decline in the duct deposition with increasing particle size results from the diminishing diffusional screening effect, while the sharp increase of the alveolar deposition from 600 nm to 1000 nm particles is because of the gravitational sedimentation, which is proportional to the cubic of the particle diameter.
Effects of Model Complexity on Nanoparticle DepositionThere are two aspects of the impacts associated with the geometrical complexity: the total air volume ventilated through the duct, and the septa-braced alveolar framework. The first aspect determines the maximum velocities in the alveoli, which in turn determines the relative contributions from convection over the diffusion. In this study, only one duct has been included in each of the three alveolar models considered. For a given VT/FRC ratio (23.3%), a larger number of alveoli means a larger volume of airspace to ventilate through the same duct, and hence a higher speed in the duct and the proximal region. As a result, different scales of velocity were used in visualizing the velocity fields of the three models (Figure 2), which is 0.0–0.6 mm/s for the 1-alveolus model, 0.0–1.0 mm/s for the 4-alveoli model, and 0.0–6.0 mm/s for the 45-alveoli model. A higher speed allows nanoparticles a shorter period of time to mix with the surrounding air, which will result in a higher wash-out and a lower alveolar deposition. This mechanism partially explains the lower predicted DF in the 45-alveoli model than in the two simplified models. It is noted that the volumetric flow rate in and out of a terminal alveolar sac is entirely determined by the rhythmic wall expansion and contraction. Any obstruction or occlusion of the acinar region will alter the duct velocity and the subsequent nanoparticle deposition fractions.
The second aspect of the impact is related to the complex alveolar structure itself. The presence of inter-alveolar septal walls and apertures makes a labyrinth pathway for the inhaled airflow and gives rise to a heterogeneous velocity distribution (Figure 2). The local velocity of the airflow is important in determining both the local aerosol concentrations (convection-driven) and the degree of particle-air mixing (or aerosol irreversibility, which is diffusion driven). In the regions with high speeds, such as in the duct and proximal alveoli, strong convection occurs, leading to a high fraction of entrained aerosols being exhaled out. In the regions with low speeds, such as in the peripheral alveoli, diffusion dominates, leading to strong particle-air mixing and enhanced deposition of entrained particles. The total deposition rate is a cumulative result from the concurrent contributions from both the proximal convection and peripheral diffusion. Future correlation development for acinar deposition needs to take into account the velocity distribution in different regions of the acinus.
Results show that the number of alveoli retained in the model influenced the total DF. The 45-alveoli model consistently gave lower DF than the 4-alveoli model and the 1-alveolus model (Figure 12). This is consistent with the observations for deposition of micrometer particles in models with a varying number of alveoli [28]. These findings have important implications in the future development of empirical correlations of inhalation dosimetry in pulmonary regions. Further studies are needed to determine how many alveoli should be retained in one acinar unit to represent it adequately. Moreover, current correlations could overestimate the alveolar deposition if based on alveolar models with a limited number of alveoli.
Effects of Alveolar Orientation on Nanoparticle DepositionTo evaluate the impact of the alveolar orientation on nanoparticle deposition, scenarios of vertical and horizontal orientations were compared. Results show that there is no significant difference for nanoparticles smaller than 200 nm in both total deposition and deposition distribution. Consistently lower deposition rates were predicted in the horizontal alveoli than the vertical ones for particles ranging from 500 nm to 1,000 nm. Differences in deposition distribution became perceivable at 500 nm and substantial at 800 nm (Figure 11).
LimitationsThere are limitations of this study that may affect the physical realism of the results. First, none of the three models can be considered as a complete acinus unit, and only one alveolar duct was included in each model. Second, even though interalveolar septa were considered, only one diameter of the aperture was studied. Microscopy examinations have disclosed an intricate morphology of the in vivo pulmonary alveoli with polyhedral airspaces packed like a fractal [47–51]. The thickness of the interalveolar septal wall also varies [52]. The duct-alveolar model in this study was reconstructed from simple shapes (cylinders and spheres) with constant wall thickness. Likewise, there was no more than one pore in one septum in this study, while there can be one to seven pores in life conditions [53]. In healthy lungs, the pore size ranges from 2 µm to 15 µm [53,54]. Further studies of the alveolar models with smaller and multiple pores are warranted. There are also other limitations such as idealized particle properties, sinusoidal wall kinematics, and non-continuous inhalation of particles. Particle charge [55,56], size [57], and hygroscopy effect [58] were neglected. A sinusoidal waveform and an I:E (inspiration: expiration) ratio of 1:1 were adopted for the wall kinematics. A different waveform and I:E ratio may give different deposition results. In addition, nanoparticles were released into the alveolar geometry at the start of the inhalation and results hereof do not apply for continuous drug administration. Based on the dilute concentration of inhaled aerosols, particle interactions such as collision and agglomeration were not considered. In addition, this study focused on the terminal alveoli only and has neglected upstream airways, especially the alveolated ducts and respiratory bronchioles, which have been actively investigated in recent years, both experimentally [32,59] and numerically [25,26,60,61].
In conclusion, the behavior and fate of inhaled nanoparticles were numerically investigated in the duct-alveolar model with varying physical complexities under different gravitational orientations. Specific findings are:
1. 2. 3. 4. 5.
The dataset of the study is available from the authors upon reasonable request.
XAS and JX designed the study. HT and JX developed the alveolar models. MT and JX performed simulations. MT, XAS and JX analyzed the data. XAS and JX wrote the paper with input from all authors.
The authors declare that there is no conflict of interest.
This research was funded by NSF Grant CBET 1745602.
1.
2.
3.
4.
5.
6.
7.
8.
9.
10.
11.
12.
13.
14.
15.
16.
17.
18.
19.
20.
21.
22.
23.
24.
25.
26.
27.
28.
29.
30.
31.
32.
33.
34.
35.
36.
37.
38.
39.
40.
41.
42.
43.
44.
45.
46.
47.
48.
49.
50.
51.
52.
53.
54.
55.
56.
57.
58.
59.
60.
61.
Talaat M, Si XA, Tanbour H, Xi J. Numerical Studies of Nanoparticle Transport and Deposition in Terminal Alveolar Models with Varying Complexities. Med One. 2019;4:e190018. https://doi.org/10.20900/mo.20190018

Copyright © 2020 Hapres Co., Ltd. Privacy Policy | Terms and Conditions


