Location: Home >> Detail
Immunometabolism. 2021;3(4):e210029. https://doi.org/10.20900/immunometab20210029
 ,
J. Mark Brown 1,2,3,*
,
J. Mark Brown 1,2,3,*
1 Department of Cardiovascular and Metabolic Sciences, Lerner Research Institute of the Cleveland Clinic, Cleveland, OH 44195, USA
2 Center for Microbiome and Human Health, Lerner Research Institute of the Cleveland Clinic, Cleveland, OH 44195, USA
3 Department of Molecular Medicine, Cleveland Clinic Lerner College of Medicine of Case Western Reserve University, Cleveland, OH 44195, USA
4 Department of General Surgery, Cleveland Clinic, Cleveland, OH 44195, USA
5 Mass Spectrometry Core, Lerner Research Institute of the Cleveland Clinic, Cleveland, OH 44195, USA
6 Department of Inflammation and Immunity, Lerner Research Institute of the Cleveland Clinic, Cleveland, OH 44195, USA
7 Mass Spectrometry Data Center, National Institute of Standards and Technology, Gaithersburg, MD 20899, USA
† These authors contributed equally to this work.
* Correspondence: Jan Claesen, Tel.: +1-216-636-3246; J. Mark Brown, Tel.: +1-216-444-8340.
This article belongs to the Virtual Special Issue "Cardiovascular Immunometabolism"
Background: A major contributor to cardiometabolic disease is caloric excess, often a result of consuming low cost, high calorie fast food. Studies have demonstrated the pivotal role of gut microbes contributing to cardiovascular disease in a diet-dependent manner. Given the central contributions of diet and gut microbiota to cardiometabolic disease, we hypothesized that microbial metabolites originating after fast food consumption can elicit acute metabolic responses in the liver.
Methods: We gave conventionally raised mice or mice that had their microbiomes depleted with antibiotics a single oral gavage of a liquified fast food meal or liquified control rodent chow meal. After four hours, mice were sacrificed and we used untargeted metabolomics of portal and peripheral blood, 16S rRNA gene sequencing, targeted liver metabolomics, and host liver RNA sequencing to identify novel fast food-derived microbial metabolites and their acute effects on liver function.
Results: Several candidate microbial metabolites were enriched in portal blood upon fast food feeding, and were essentially absent in antibiotic-treated mice. Strikingly, at four hours post-gavage, fast food consumption resulted in rapid reorganization of the gut microbial community and drastically altered hepatic gene expression. Importantly, diet-driven reshaping of the microbiome and liver transcriptome was dependent on an intact microbial community and not observed in antibiotic ablated animals.
Conclusions: Collectively, these data suggest a single fast food meal is sufficient to reshape the gut microbial community in mice, yielding a unique signature of food-derived microbial metabolites. Future studies are in progress to determine the contribution of select metabolites to cardiometabolic disease progression and the translational relevance of these animal studies.
MetS, metabolic syndrome; TMA, trimethylamine; Fmo3, flavin-containing monooxygenase 3; TMAO, trimethylamine-N-oxide; DADA, divisive amplicon denoising algorithm pipeline; NMDS, non-metric multidimensional scaling; FDR, false discovery rate; ANOVA, analysis of variance; PERMANOVA, permutational multivariate analysis of variance; LCMS, liquid chromatography–mass spectrometry; QC, quality control; UHPLC, Ultra-High-Performance Liquid Chromatography; ESI, electrospray ionization; MS, mass spectrometry; LPA, lysophosphatidic acid; MS/MS, Tandem Mass Spectrometry; IQR, interquartile range; KEGG, Kyoto Encyclopedia of Genes and Genomes; HMDB, Human Metabolome Database; LIPID MAPS, Lipid Metabolites and Pathways Strategy; PCA, principal component analysis; SRA, Sequence Read Archive; RT-qPCR, real time quantitative polymerase chain reaction; m/z_RT, mass-to-charge ratio_retention time
Metabolic syndrome (MetS) is a pervasive disorder impacting roughly one in three adults in the United States [1]. Individuals with MetS have an increased propensity to develop cardiovascular-related diseases and have higher incidence of all-cause mortality [2,3]. Although many factors may contribute to the development and progression of MetS, a surplus of dietary caloric intake represents a common and preventable disease risk factor. The increasing availability of low-cost, high-calorie, convenient food undoubtedly contributes to what has been described as the American obesity epidemic [2]. Recent controlled studies have revealed that a fixed dietary input amongst a group of individuals does not necessarily equate to a fixed output [4–7]. The variability associated with these findings is largely attributed to inter-individual variation in gut microbial composition. An excellent example of this concept is the consumption of foods rich in choline, phosphatidylcholine, and carnitine. Most omnivorous humans contain gut microbes with trimethylamine (TMA) lyase enzymes that convert these dietary substrates into TMA. TMA is then converted by host flavin-containing monooxygenase 3 (Fmo3) into trimethylamine-N-oxide (TMAO), a pro-atherogenic, pro-thrombotic molecule [8–10]. Strikingly, vegans almost universally lack gut microbes capable of converting carnitine into TMA and thus do not produce TMAO after consuming red meat [4].
Traditionally, rodent models of MetS are achieved through ad libitum feeding of a lard based diet containing 60% of calories from fat. While effective in promoting obesity, hyperglycemia, and insulin resistance, these diets are not representative of a human diet. In order to better understand the interface between diet, the gut microbiome, microbial metabolites, and MetS, we herein propose to explore the use of a human-relevant diet.
In this study, we aimed to identify microbe-derived metabolites stemming from consumption of a human-relevant fast food meal. In pursuit of this aim, we fed a single meal equivalent of either rodent chow or fast food to conventionally raised mice (with an intact gut microbiome) and mice that had their microbiota ablated with antibiotics. We discovered a rapid reorganization of the gut microbial community structure that was independent of microbes that might have been associated with the meals. Moreover, we identified unique gut microbe-derived metabolites that were enriched in the portal blood of mice receiving an oral gavage of fast food compared to those receiving chow. Distinct transcriptional profiles were identified in the liver with notable diet and gut microbial dependencies. Taken together, these data represent a multi-omics approach to identify novel gut microbe-derived transcriptional and metabolic signatures that arise postprandially after consumption of a fast food meal. Future studies are in progress to determine which of these metabolites are causally linked to MetS.
6-week old male C57BL6/J mice were purchased from Jackson Laboratories (Bar Harbor, ME, USA) and randomly assigned to control drinking water or drinking water supplemented with vancomycin (0.5 g/L), neomycin (1 g/L), ampicillin (1 g/L), and metronidazole (1 g/L) and maintained on a defined rodent chow (TD.130104) for two weeks (n = 6–7 per group). Next, mice were fasted overnight and at the beginning of the light cycle were given a single oral gavage (0.2 mL) of either liquified chemically defined chow (TD.130104) from Harlan Laboratories (Madison, WI) or liquified fast food (procured from local fast food restaurants) and sacrificed exactly 4 h later. The 4 h postprandial time point was chosen based on previous studies showing the production of the gut microbe-associated co-metabolites trimethylamine (TMA) and trimethylamine N-oxide (TMAO) peak ~2–4 h after a high fat meal [11,12]. Our goal was to choose a relevant time point where gut microbes would be actively producing metabolites from the dietary substrates provided. To accurately model a human-relevant fast food meal, food items were purchased from three of the top five grossing fast food chains in the USA (McDonald’s, Taco Bell, and Burger King). All food was ordered locally in Cleveland, Ohio with instructions to the servers to exclude any vegetable products (i.e., no lettuce, tomato, onion, etc.). The actual items used to make the liquified fast food meal are shown in Figure 1, and included the following popular menu items: (1) McDonald’s double quarter pounder with cheese, (2) McDonald’s chicken tenders, (3) McDonald’s French fries, (4) Burger King Whopper with cheese, (5) Burger King original chicken sandwich, (6) Burger King cheesy tots, (7) Burger King French fries, (8) Taco Bell beef crunchy taco, (9) Taco Bell chicken quesadilla, and (10) Taco Bell 5 layer burrito. To mimic what the human intestine sees after a fast food meal, the items above were minced into a solvent of Coca Cola and a McDonald’s chocolate milkshake using an industrial blender. The resulting fast food slurry or a control slurry of rodent chow (TD.130104) in water solvent was administered via oral gavage, and exactly 4 h postprandially mice were terminally anesthetized with ketamine/xylazine (100–160 mg/kg ketamine -20–32 mg/kg xylazine), and a midline laparotomy was performed. A small volume (~50–100 µL) of blood was collected directly from the portal vein (i.e., blood draining from the gut where microbe-derived metabolites are enriched), and the remaining peripheral blood was collected via cardiac puncture. Following blood collection, a whole body perfusion was conducted by puncturing the inferior vena cava and slowly delivering 10 mL of saline into the heart to remove blood from tissues. Tissues were collected and immediately snap frozen in liquid nitrogen for subsequent biochemical analysis or fixed for morphological analysis. All animal procedures were approved on September 9, 2016 under protocol 2016-1631 by the Institutional Animal Care and Use Committee of the Cleveland Clinic.
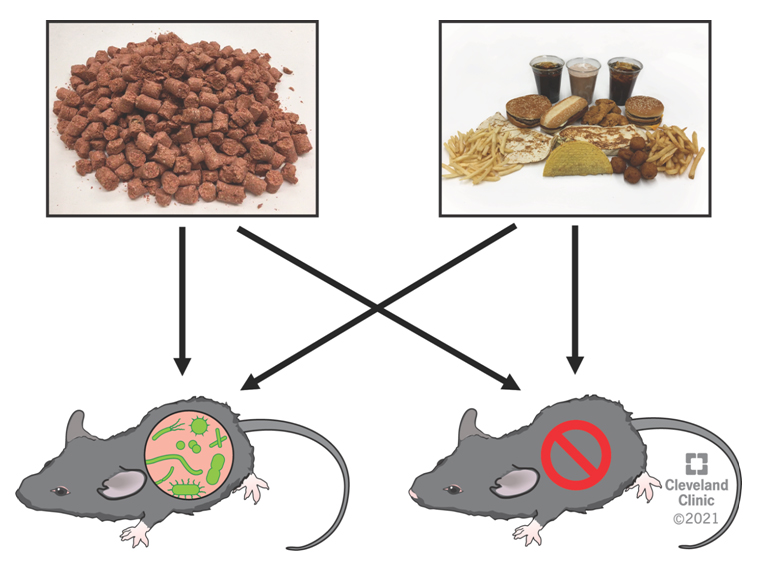 Figure 1. Experimental Design to Identify Fast Food-Derived Gut Microbial Metabolites. 6-week old male C57BL6/J mice were randomly assigned to normal drinking water or drinking water supplemented with vancomycin (0.5 g/L), neomycin (1 g/L), ampicillin (1 g/L), and metronidazole (1 g/L) for two weeks. Next, mice were given a single oral gavage of either chow slurry or fast food slurry and sacrificed 4 h later for phenotypic characterization.
DNA was extracted from mouse cecal contents and food samples using the QIAGEN PowerSoil Pro kit using the manufacturer’s protocol. 16S rRNA amplicon sequencing was done for the V1-V2 region using Illumina MiSeq at 2 × 250 cycles from mouse cecal contents and food samples. Raw 16S amplicon sequences and metadata were demultiplexed using the split_libraries_fastq.py script implemented in QIIME1.9.1 [13]. The demultiplexed fastq file was split into sample specific fastq files using the split_sequence_file_on_sample_ids.py script from QIIME1.9.1 [13]. Individual fastq files without non-biological nucleotides were processed using the Divisive Amplicon Denoising Algorithm (DADA) pipeline [14]. The output of the DADA2 pipeline (feature table of amplicon sequence variants) was processed for alpha and beta diversity analysis using the phyloseq [15] and microbiomeSeq packages (http://www.github.com/umerijaz/microbiomeSeq) in R. Alpha diversity estimates were measured within group categories using the estimate_richness function of the phyloseq package [15]. Non-metric multidimensional scaling (NMDS) was performed using the Bray-Curtis dissimilarity matrix [16] between groups and visualized by using the ggplot2 package [17]. We assessed the statistical significance (p < 0.05) throughout, and whenever necessary we adjusted p-values for multiple comparisons according to the Benjamini-Hochberg method to control false discovery rate (FDR) [18] while performing multiple testing on taxa abundance according to sample categories. We performed an analysis of variance (ANOVA) among sample categories while measuring the alpha diversity measures using the plot_anova_diversity function in the microbiomeSeq package. Permutational multivariate analysis of variance (PERMANOVA) with 999 permutations was performed on all principal coordinates obtained during principal coordinates analysis with the ordination function of the microbiomeSeq package. Linear regression (parametric) and Wilcoxon (non-parametric) tests were performed on amplicon sequence variant abundances against meta-data variable levels using their base functions in R [19].
Plasma Untargeted MetabolomicsPortal blood was collected from the portal vein and peripheral blood via cardiac puncture at time of necropsy. Blood was centrifuged at 5000 × g for 5 min and the plasma fraction was processed via liquid chromatography-mass spectrometry (LCMS). Plasma samples were prepared by diluting each sample 1:20 in chilled methanol containing isotopically labeled internal standards. The samples were then vortexed and centrifuged at 14,000 × g for 20 min to precipitate out the protein pellet. The supernatants were recovered for LCMS analysis. One-microliter aliquots taken from each sample were pooled and technical replicates of this quality control (QC) standard were analyzed every 10 injections. 5 µL of each sample was injected onto a 10 cm C18 column (Thermo Fisher, CA, USA) coupled to a Vanquish Ultra-High-Performance Liquid Chromatography (UHPLC+ focused) system running at 0.35 mL/min using water and 0.1% formic acid as solvent A and acetonitrile and 0.1% formic acid as solvent B. A 15-min gradient of [time(minutes)]:[%solvent B] of [0.2,1,8,10,12,14]:[5,15,95,95,5,5] was used. The Orbitrap Q-Exactive HF was operated in positive and negative electrospray ionization (ESI) modes covering a mass range of 56-850 Da using full mass spectrometry (MS) scans at 120,000 resolution. Data-dependent MS2 spectra from the pooled QC sample were acquired on the top 10 most abundant ions at a resolution of 30,000 with dynamic exclusion of 40.0 s and the apex trigger set at 2.0 to 4.0 s. The resolution of the MS2 scans were taken at a stepped normalized collision energy of 20.0, 30.0, and 45.0. Lockmass was applied in both ESI modes and the full MS data were acquired in profile mode. Validation of 18:0 lysophosphatidic acid (LPA) was performed via tandem mass spectrometry (MS/MS) against a commercial standard(Avanti Polar Lipid, Inc. product no. 857128P). Additional reference spectral libraries, including Metlin (https://metlin.scripps.edu) and mzCloud (https://www.mzcloud.org) were searched for additional information on collision energy and structural elucidations. XCMS (xcmsonline.scripps.edu) was used to deconvolute the untargeted metabolomics data using 5 ppm consecutive scan error, 8 to 45 s as minimum and maximum peak width, and a signal-to-noise threshold of 10.
The resulting peak tables (Supplementary File S1A,B) were further analyzed using MetaboLyzer as previously described to perform single two-group analysis [20]. Briefly, the data were natural log transformed and ions present in at least 70% of the samples in all study groups at non-zero abundances (complete-presence ions) were analyzed via traditional statistical methods. Outliers were removed via 1.5 interquartile range (IQR) filtering, and the non-parametric Mann-Whitney U test (p < 0.05) was utilized to determine statistical significance. Ions that met the 70% presence threshold in only one group (partial-presence ions) were analyzed categorically via Fisher’s exact test. All p-values were corrected via the adjusted Benjamini-Hochberg correction procedure [18,21], with an FDR q-value threshold of 0.1 (10%) to delineate significance. MetaboLyzer was also used for putative identification of ions at maximum m/z tolerance of 7 ppm using the Kyoto Encyclopedia of Genes and Genomes (KEGG) [22], Human Metabolome Database (HMDB) [23], Lipid Metabolites and Pathways Strategy (LIPID MAPS) [24], and BioCyc Database Collection [25] (Supplementary File S1C,D). Metabolyzer offered a deep understanding of single two-group analyses, generating volcano plots, principal component analysis (PCA) score plots, and metabolic pathway enrichment plots.
In addition, a novel Python programming language (v3.7.0) script was used to perform several two-group analyses simultaneously to identify ions that satisfied a complete set of user-specified comparison criteria (Supplementary File S3). Ions absent in greater than 50% of all samples were excluded from analysis. Zeros were converted to half the lower limit of detection, defined by the lowest intensity value of all samples for that ion. Values were natural log converted. Outlier values were removed via 1.5 IQR filtering and excluded from analysis. For each user-specified two-group comparison, the Mann-Whitney U test was used to generate p-values, then an adjusted Benjamini-Hochberg correction procedure was performed to determine q-values [18,21]. An FDR q-value threshold of 0.1 (10%) was used to delineate significance. Desired comparison criteria were specified by the user (e.g., significant increase from group 1 to group 2, significant decrease from group 2 to group 3, etc.), and ions meeting all comparison criteria i.e., hits were displayed with their relevant information including putative ID if available. To rank their fitness of the comparison criteria listed, hits were scored based on user-specified weights for fold-change differences between groups of each comparison, and were displayed in order of fitness. Values were reconverted to exponential form, and bar graphs were made with GraphPad Prism (v9.0.0).
Liver Targeted MetabolomicsThe AbsoluteIDQ® p400 HR kit from Biocrates Life Sciences AG was used to obtain targeted quantitative metabolomics data. Liver tissue was collected at time of necropsy following transcardial saline perfusion. The liver tissue samples were prepared according to manufacturer protocol. Briefly, at least 30 mg of each tissue sample was cut and weighed, and kept frozen throughout this protocol. The tissue samples were homogenized and centrifuged at 10,000 × g for 5 min. The supernatant was then collected, 10 μL of which per sample was loaded onto a 96-well plate containing stable isotope-labeled standards, and processed according to manufacturer protocol. The LCMS analysis was done using specific parameters (both Tune and LCMS methods) per kit manufacturer’s recommendations. The assay was performed on a Q-Exactive HF (operated only in positive ESI mode) coupled with a Vanquish UHPLC+ focused liquid chromatography as detailed per assay instructions. The manufacturer-provided software, MetIDQ (Biocrates, Life Science AG), was used to provide the resultant peak table (Supplementary File S2). Python programming language (v3.7.0) was used to analyze the data (Supplementary File S4). Molecules absent in greater than 50% of samples were excluded from analysis. Outlier values were removed via 1.5 IQR filtering and excluded from analysis. Comparisons were performed using the Mann-Whitney U test to generate p-values, then an adjusted Benjamini-Hochberg correction procedure was performed to determine q-values [18,21]. An FDR q-value threshold of 0.15 (15%) was used to delineate significance. Z-scores were calculated for heatmap generation. Bar graphs and heatmaps were made with GraphPad Prism (v9.0.0).
Hepatic RNA Sequencing and AnalysisRNA was isolated via the RNeasy Plus Mini Kit (Qiagen, Hong Kong) from mouse liver following the manufacturer’s protocol. RNA samples were checked for quality and quantity using the Bioanalyzer (Agilent, Santa Clara, CA, USA). RNA-Seq libraries were generated using the Illumina mRNA TruSeq RNA library kit following Ribo-Zero depletion and sequenced using an Illumina HiSeq 4000 (all according to the manufacturer’s instructions). RNA sequencing was performed by the University of Chicago Genomics Facility. Single 50 bp reads were controlled for quality with FastQC (https://www.bioinformatics.babraham.ac.uk/projects/fastqc/) before trimming Illumina adapters from the 3’ ends using cutadapt [26]. STAR was used to align trimmed reads to the Mus musculus genome (NCBI GRCm38.93) [27]. Read counts for each gene were calculated using HTseq [28] and loaded into R (http://www.R-project.org/) (R Development Core Team, 2015) where DESeq2 [29] (v.1.28.1, https://bioconductor.org/packages/release/bioc/html/DESeq2.html) was used to perform differential expression analysis on genes with at least 1 count per sample with alpha set to 0.05. P-values were adjusted using the Benjamini-Hochberg correction procedure [18] and genes with p < 0.05 were considered statistically significant. Heatmaps were generated of the top 50 differentially expressed transcripts using pheatmap [30] and RColorBrewer [31]. NMDS analysis was performed using the plotMDS function of edgeR [32] using the top 500 differentially expressed genes as sorted by log2 fold change. Pathway analysis on the top 150 differentially expressed genes was performed using Metascape [33]. The data discussed in this publication have been deposited in NCBI's Gene Expression Omnibus [34] and are accessible through GEO Series accession number GSE165756.
Real Time Quantitative PCR Analysis of Gene ExpressionRNA was isolated via the RNeasy Plus Mini Kit (Qiagen, Hong Kong) from mouse liver following the manufacturer’s protocol. Real time quantitative polymerase chain reaction (RT-qPCR) analyses were conducted as previously described [35–37]. Gapdh was used as a housekeeping gene for all RT-qPCR analyses and mRNA expression levels were calculated based on the ΔΔ-CT method. qPCR was conducted using the Applied Biosystems 7500 Real-Time PCR System. Primers used for RT-qPCR are available on request.
Total Hepatic Triglyceride, Cholesterol, and Phosphatidylcholine AnalysesThe extraction of liver lipids and quantification of total hepatic triglyceride, free cholesterol, and phosphatidylcholine was conducted using enzymatic assays as described previously [38–40].
Oxygen Bomb CalorimetrySamples of the chow and fast food slurries were placed into 10 mL falcon tubes and dried at 60 °C for 48 h. After 48 h, dried samples were weighed to 30–55 mg per sample. This weight (in grams) was recorded in the system software before the sample was combusted. Samples were placed in an 1109A Semimicro Oxygen Bomb containing a 10 cm fuse wire or 23 “units” and filled with 35–40 psi oxygen. The samples were then combusted in a Parr Instruments 6725 semimicro calorimeter containing 450 grams of water. After combustion, the amount of fuse wire remaining was subtracted from 23 “units”. This value was input into the system and the heat of combustion was generated. Heat of combustion was generated in cal/g.
Statistical Analysis16S rRNA Sequencing: Statistical analysis of Shannon alpha diversity estimates was performed via ANOVA. PERMANOVA was used to analyze NMDS plots based on the Bray-Curtis index between the chow and fast food cecal contents as well as the microbial composition of the food itself. Statistical analysis of pairwise differential abundance was performed with White’s non-parametric t-test. n = 6–7 per group.
Untargeted Plasma Metabolomics: The data were natural log transformed and ions present in at least 70% of the samples in all study groups at non-zero abundances (complete-presence ions) were analyzed via traditional statistical methods. Outliers were removed via 1.5 interquartile range (IQR) filtering, and the non-parametric Mann-Whitney U test (p < 0.05) was utilized to determine statistical significance. Ions that met the 70% presence threshold in only one group (partial-presence ions) were analyzed categorically via Fisher’s exact test. All p-values were corrected via the adjusted Benjamini-Hochberg correction procedure [18,21], with an FDR q-value threshold of 0.1 (10%) to delineate significance. Additionally, simultaneous two-group analysis was performed to identify ions that satisfied a complete set of user-specified comparison criteria (Supplementary File S3). Ions absent in greater than 50% of all samples were excluded from analysis. Zeros were converted to half the lower limit of detection, defined by the lowest intensity value of all samples for that ion. Values were natural log converted. Outlier values were removed via 1.5 IQR filtering and excluded from analysis. For each user-specified two-group comparison, the Mann-Whitney U test was used to generate p-values, then an adjusted Benjamini-Hochberg correction procedure was performed to determine q-values [18,21]. An FDR q-value threshold of 0.1 (10%) was used to delineate significance. To rank the fitness of comparisons, hits were scored based on user-specified weights for fold-change differences between groups. Values were reconverted to exponential form. n = 4–7 per group.
Targeted Hepatic Metabolomics: Molecules absent in greater than 50% of samples were excluded from analysis. Outlier values were removed via 1.5 IQR filtering and excluded from analysis. Comparisons were performed using the Mann-Whitney U test to generate p-values, then an adjusted Benjamini-Hochberg correction procedure was performed to determine q-values [18,21] (Supplementary File S4). An FDR q-value threshold of 0.15 (15%) was used to delineate significance. Z-scores were calculated for heatmap generation. n = 6–7 per group.
RNA-Sequencing Analysis: Statistical analysis on differentially expressed genes was performed on genes with at least 1 count per sample with alpha set to 0.05. P-values were adjusted using the Benjamini-Hochberg correction procedure [18] and genes with p < 0.05 were considered statistically significant. n = 4 per group.
Quantitative-Real Time PCR: Statistical analysis of qPCR data was performed using a two-way ANOVA with Tukey’s multiple comparison test. n = 6–7 per group.
Hepatic Lipid Analysis: Statistical analysis was performed using two-way ANOVA with Tukey’s multiple comparisons test and significance is displayed for differences within each meal-type between gut microbiota groups (control vs antibiotic ablated) and within gut microbiota groups, between meal type. n = 6–7 per group.
Bomb Calorimetry: Statistical analysis was performed using two-way ANOVA with Tukey’s multiple comparisons test and significance is displayed for differences within type of sample preparation. n = 3 per group.
It is well known that dietary practices can have profound effects on gut microbiome communities in rodents and humans [41–43]. However, most studies focus on microbiome alterations after days or weeks of dietary manipulation. Here we set out to understand the acute postprandial effects of a human-relevant fast food meal on gut microbiome community structure in C57BL/6J mice. Exactly four hours after receiving a single meal equivalent of either fast food or rodent chow (Figure 1, Supplementary Figure S1, Supplementary Tables S1 and S2), cecal contents were harvested and profiled via 16S rRNA sequencing (Figure 2). In addition to the cecal contents, the rodent chow and human-relevant fast food meal slurries themselves were also profiled via 16S rRNA sequencing to understand the potential contribution of food-associated bacteria. Alpha diversity within each meal type was compared between control and antibiotic-treated groups (Figure 2A). Strikingly, just four hours after the oral gavage, distinct diet- and antibiotic-dependent clustering was observed (Figure 2B). Importantly, these rapid shifts in microbial community are independent of the 16S rRNA signals contained within the food slurries themselves (Figure 2B,C). Moreover, antibiotic treatment led to a striking reduction in the Bacteroides genus in fast food-gavaged mice (Figure 2C). Not surprisingly, the fast food slurry itself has a relatively low diversity microbiome associated with it, which is largely comprised of the food-associated commensal genera Streptococcus, Lactococcus, and Lactobacillus (Figure 2C) [44,45].
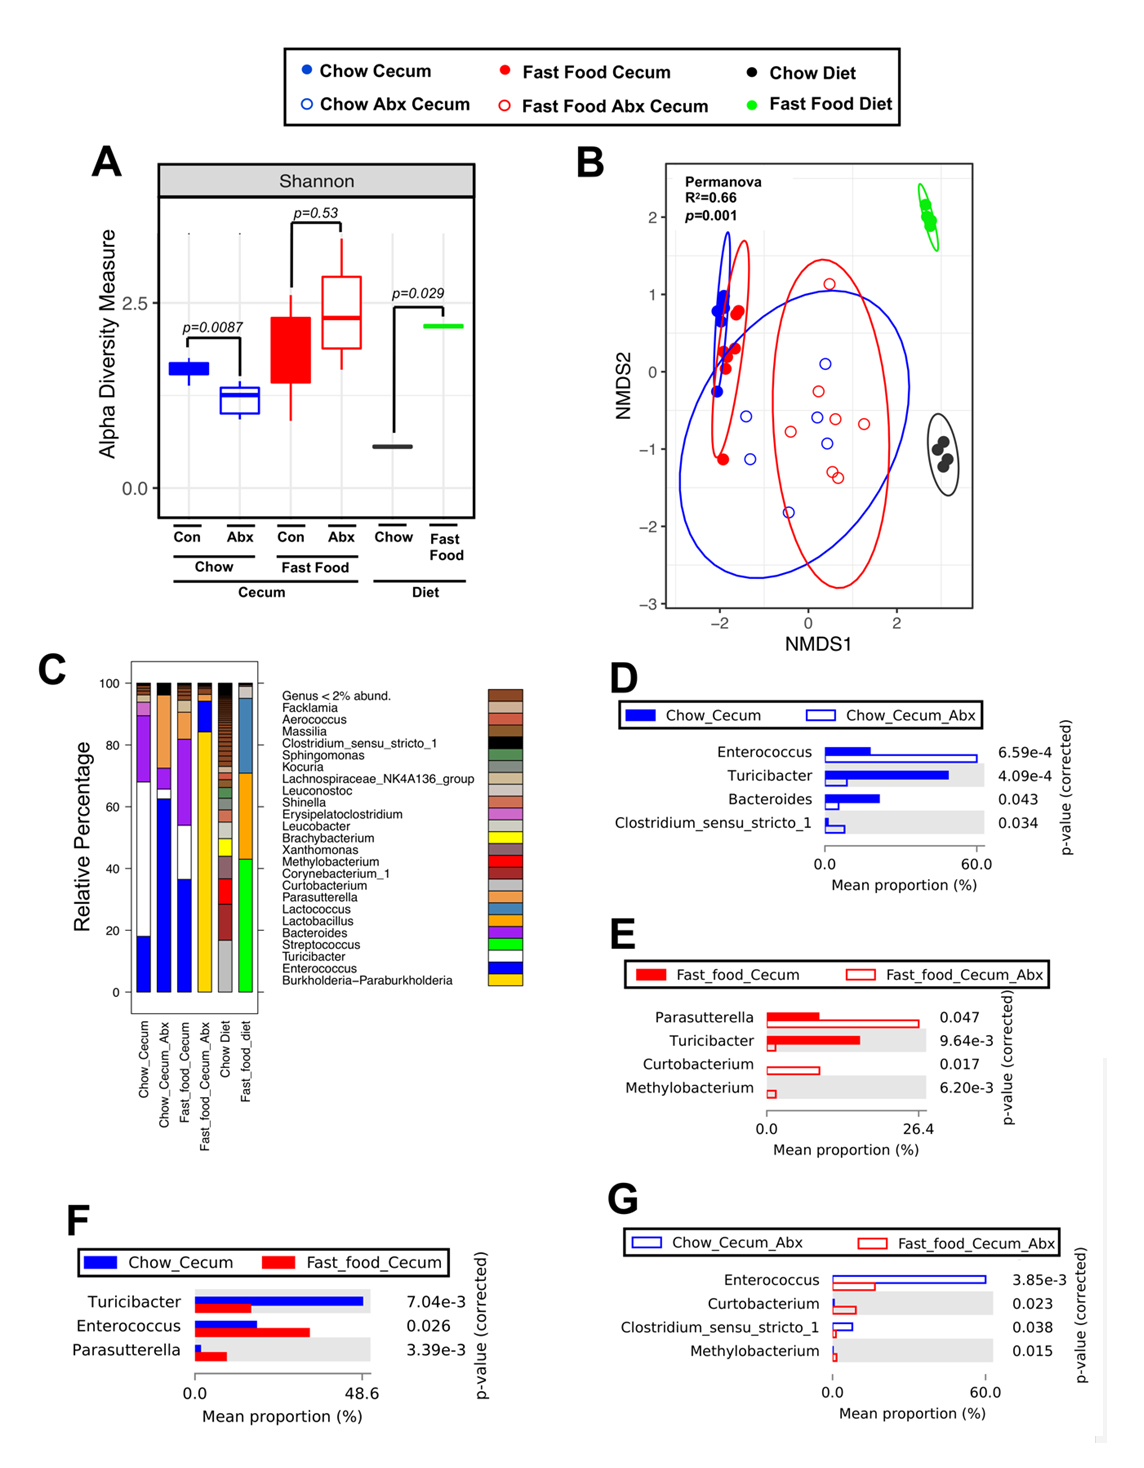 Figure 2. A Single Fast Food Meal Promotes Rapid Remodeling of the Gut Microbiome. 6-week old male C57BL6/J mice were randomly assigned to control drinking water or drinking water supplemented with broad spectrum antibiotics for two weeks. Following an overnight fast, mice were given a single oral gavage of either chow slurry or fast food slurry and the cecum was harvested exactly 4 h later for 16S rRNA sequencing. (A) Shannon alpha diversity estimates for all six groups. Statistical analysis was performed via ANOVA. Comparisons within diet, across microbiome status are shown to the left (Cecum), and comparisons between food types are shown on the right (Diet). (B) NMDS plots based on the Bray-Curtis index between the chow and fast food cecal contents as well as the microbial composition of the food itself. Statistical analysis was performed with PERMANOVA, and p-values are labeled in plots. R2 values are noted for comparisons with significant p-values and stand for percentage variance explained by the variable of interest. (C) Stacked bar charts of relative abundance (left y-axis) of the top 20 genera assembled across all six groups. Pairwise differential abundance analyses between (D) Chow Cecum and Chow Cecum Antibiotics, (E) Fast Food Cecum and Fast Food Cecum Antibiotics, (F) Chow Cecum and Fast Food Cecum, (G) Chow Cecum Antibiotics and Fast Food Cecum Antibiotics groups. Statistical analysis was performed with White’s non-parametric t-test (p-values are labeled in plots). Con = control; Abx = antibiotics. n = 6–7 per group.
In control water chow-gavaged mice, there was a significant enrichment of the Turicibacter and Bacteroides genera and loss of the Enterococcus and Clostridium genera when compared to the chow antibiotic treated group (Figure 2D). In control water fast food-gavaged mice, the genus Turicibacter was significantly enriched when compared to the fast food antibiotic treated group whereas the Parasutterella, Curtobacterium, and Methylobacterium genera were the most differentially abundant in the antibiotic treated group albeit these genera comprise a small proportion of the whole (Figure 2E). Notably, with an intact microbiome (non-antibiotic treated), Turicibacter was more abundant in chow-gavaged mice whereas Enterococcus and Parasutterella were enriched in fast food-gavaged mice (Figure 2F). Notably, some strains of Turicibacter produce lactic acid—a mediator of intestinal epithelial cell homeostasis [46,47]. Comparing chow- to fast food-gavaged mice in the context of antibiotic ablation, an enrichment of Enterococcus, which can act as an opportunistic pathogen [48], and Clostridium genera was observed (Figure 2G). Conversely, two environmental bacteria, Methylobacterium and Curtobacterium, were enriched in antibiotic ablated mice receiving fast food compared to chow (Figure 2G). These microbes have been described as members of complex biofilms in a variety of contexts ranging from nosocomial infections to plant pathogenesis [49,50]. In summary, these data suggest that a single meal equivalent of fast food is sufficient to remodel the gut microbial community structure in a short timeframe when compared to a chow control meal.
A Single Fast Food Meal Alters the Portal Blood Metabolome in a Gut Microbe-Dependent MannerOne of the key goals of this project was to unbiasedly identify gut microbe-associated postprandial metabolite alterations driven by a single fast food meal equivalent. To achieve this we performed untargeted metabolomics in postprandial portal (i.e., the blood draining the gut) and peripheral plasma samples in mice either treated with or without broad spectrum antibiotics. The plasma untargeted metabolomics data in negative (Figure 3) and positive (Supplementary Figure S2) ESI modes were organized in eight distinct groups characterized by site of blood collection (portal versus peripheral), administration of control versus antibiotic water, and chow versus fast food meal gavage (Figure 3A). MetaboLyzer [20] was used to perform a single two-way comparison between portal plasma from chow- versus fast food-gavaged mice with an intact gut microbiome (non-antibiotic treated). Principal component analysis demonstrated strong separation between groups in both the negative (Figure 3B) and positive (Supplementary Figure S2B) ESI modes. KEGG pathway analysis identified differences in putative metabolites related to unsaturated fatty acid biosynthesis and arachidonic acid metabolism, as well as amino acid metabolism in the negative ESI mode (Figure 3C). A parallel analysis of positive ESI mode ions corroborated the significant difference in putative lipid biosynthesis metabolites resulting from the fast food meal (Supplementary Figure S2C).
In a separate analysis using an in-house developed algorithm (Supplementary File S3), several two-group analyses were performed simultaneously in an attempt to focus on fast food-driven metabolites that also have gut microbe-associated patterns i.e., metabolites that were simultaneously enriched in portal blood, suppressed by antibiotic, and altered by fast food feeding (Figure 3D). In the negative ESI mode, 3829 ions met the presence-threshold with greater than 50% of samples reporting a non-zero value and were subsequently analyzed. Multiple two-way comparisons were made to identify ions of significantly greater intensity within the portal blood of control water fast food-gavaged mice when compared to each of the following: portal blood of control water chow-gavaged mice, portal blood of all antibiotic water treated mice, and all peripheral blood samples (Figure 3E–G, comparison bars). Overall, 463 ions met all criteria, including 138 with putative database identifications (Figure 3D). All 463 ions were scored based on the fold-change differences between groups of each comparison to rank their fitness of the multiple criteria listed. The ion with reported mass-to-charge ratio_retention time (m/z_RT) of 423.2919_11.3959 was highly scored and later structurally confirmed to be 18:0 LPA (Figure 3E). Many other putatively identified (Figure 3F) and unidentified (Figure 3G) ions were also highly scored and fit the multiple criteria well (Supplementary Figure S2E–G). A parallel analysis was performed for the positive ESI mode (Supplementary Figure S2), and many additional highly scored ions closely following a dual fast food-driven gut microbe-associated pattern were identified. Data and results generated from both negative and positive ESI modes are available in Supplementary File S1. Remarkably, in the negative ESI mode, nearly all (1903 out of 1991) metabolites that were significantly higher in portal versus peripheral blood were also significantly higher in the portal blood of control water versus antibiotic water (Figure 3D). In other words, nearly all portal-blood enriched metabolites were gut-microbe dependent. This demonstrates the immense importance of the gut microbiome to the portal vein niche, and also the importance of portal blood collection in study of the gut microbiome.
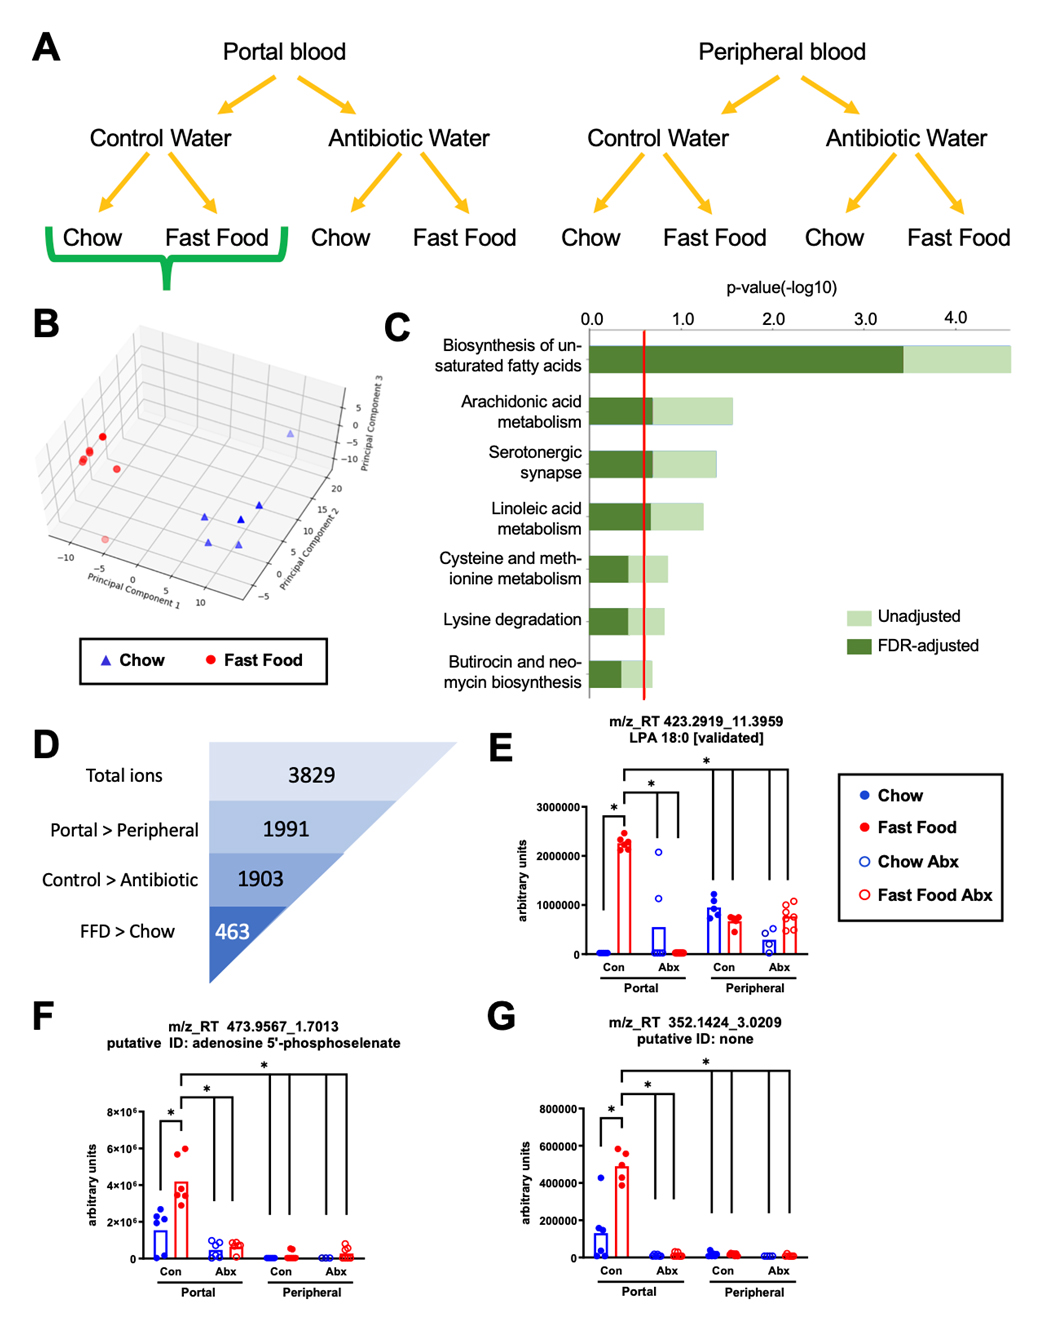 Figure 3. A Single Fast Food Meal Alters the Portal Blood Metabolome in a Gut Microbe-Dependent Manner. (A) 6-week old male C57BL6/J mice were randomly assigned to control drinking water or drinking water supplemented with broad spectrum antibiotics for two weeks. Following an overnight fast, mice were given a single oral gavage of either chow slurry or fast food slurry and sacrificed exactly 4 h later. Portal and peripheral blood were taken for plasma and LCMS-based untargeted metabolomics was performed in the negative ESI mode. (B) PCA and (C) KEGG pathway analysis of portal blood from chow versus fast food gavage of control water mice generated using MetaboLyzer. (D) Multiple two-group comparisons were made to identify ions enriched within the portal blood that were greater in the control water, fast food gavage group. 463 ions satisfy all criteria. (E) The comparison tests performed are shown with overlying horizontal comparison bars. Ion mass charge_retention time (m/z_RT) 423.2819_11.3959 satisfied all criteria and was structurally validated as 18:0 LPA. (F) Ion m/z_RT 473.9567_1.7013 satisfies all criteria and is putatively identified as adenosine 5’phosphoselenate. (G) Ion m/z_RT 342.1424_3.0209 satisfies all criteria but does not have a putative identification. *q < 0.10 (Mann-Whitney U test). Con = control; Abx = antibiotics. n = 4–7 per group.
To understand diet-microbe-host driven alterations in the hepatic metabolome, we performed a quantitative targeted metabolomic panel in livers isolated 4 h after a fast food meal. This targeted assay included structurally diverse metabolite classes including amino acids, biogenic amines, monosaccharides, glycerophospholipids, and neutral lipids. We generated heatmap plots to highlight metabolite differences between livers from chow and fast food meal gavage groups of mice with an intact microbiome (Figure 4A left side). These differences were not maintained in mice that had their microbiota ablated by prior administration of antibiotics in the drinking water (Figure 4A right side), implicating the role of an intact gut microbial metabolism on a meal-specific liver metabolome. When considering the top 50 differentially detected liver metabolites across gut microbiome status within the chow-gavaged group (Supplementary Figure S3A left side), some of these differences were maintained in fast food-gavaged mice (Supplementary Figure S3A right side). Similarly, differences across the gut microbiome status within the fast food-gavaged group (Supplementary Figure 3B left side) were only slightly maintained in chow-gavaged mice (Supplementary Figure S3B right side). Taken together, this suggests that antibiotic-mediated differences in the hepatic metabolome were present in both chow and fast food meal groups, though the particular differences were diet-specific.
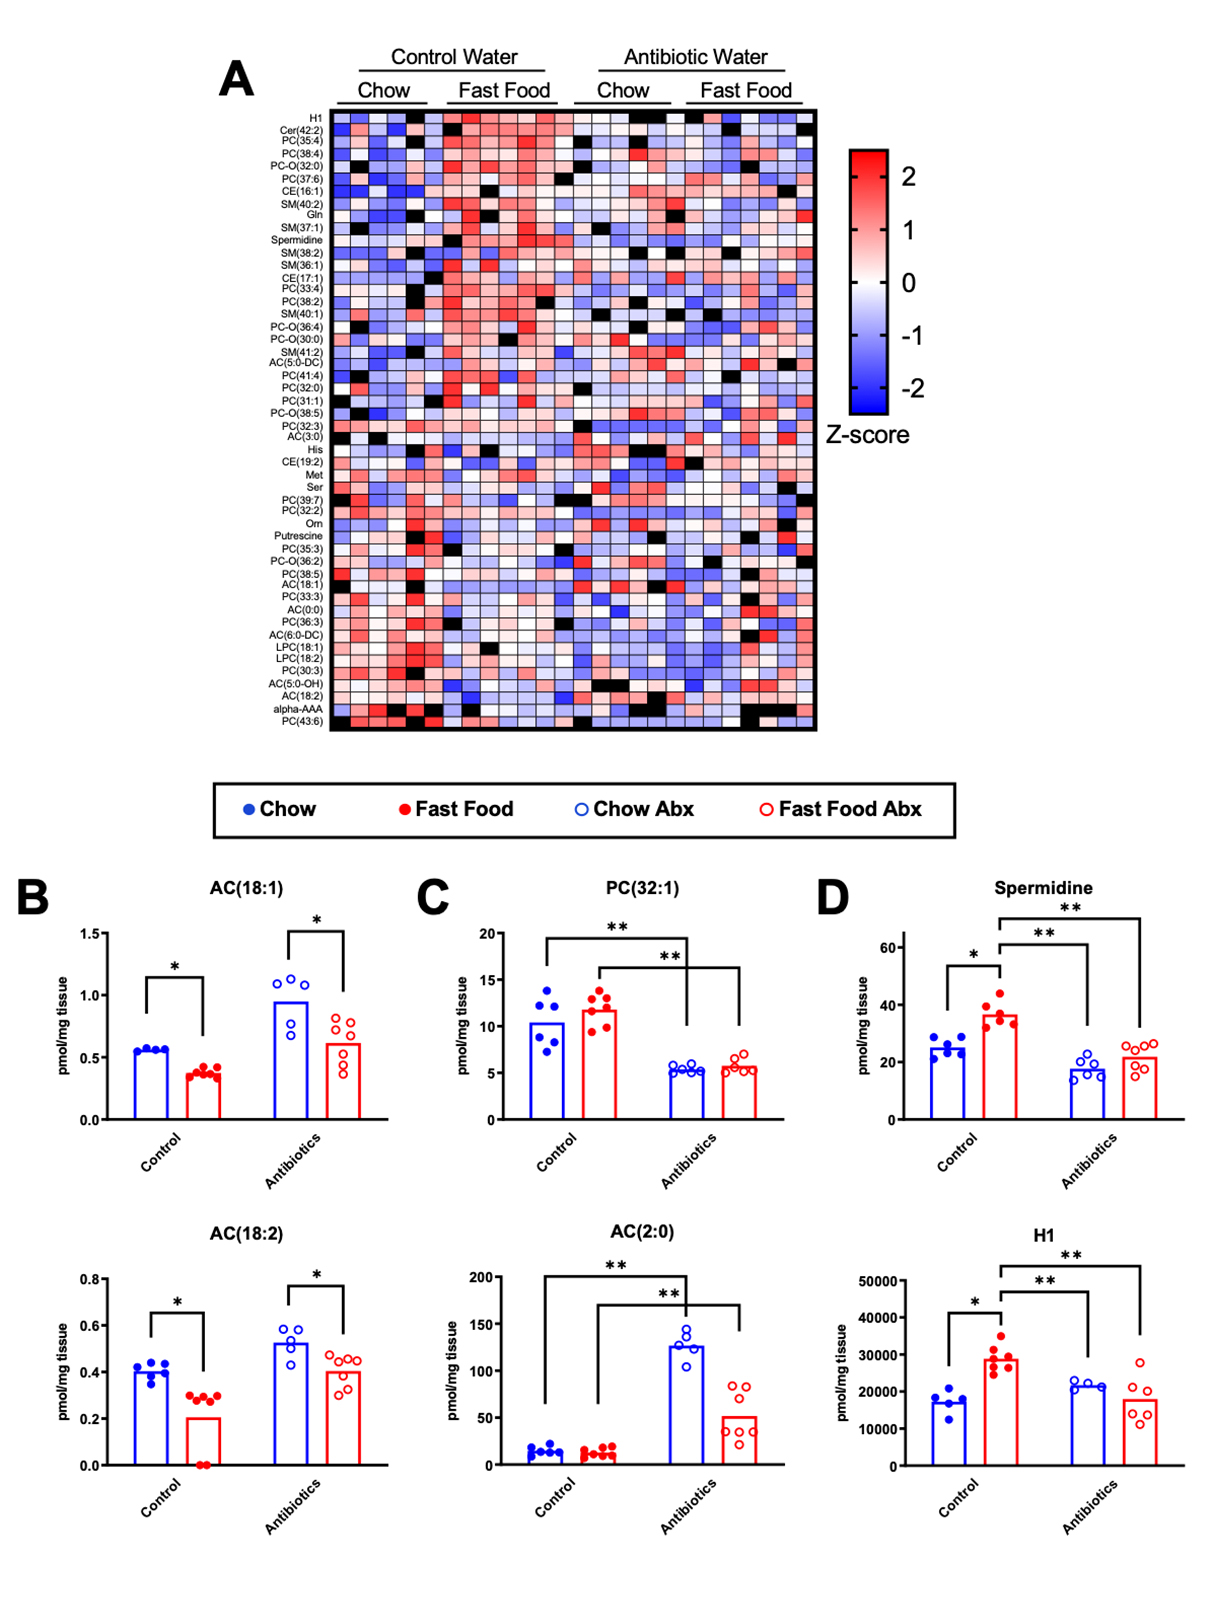 Figure 4. A Single Fast Food Meal Alters the Hepatic Metabolome in a Gut Microbe-Dependent Manner. 6-week old male C57BL6/J mice were randomly assigned to control drinking water or drinking water supplemented with broad spectrum antibiotics for two weeks. Following an overnight fast, mice were given a single oral gavage of either chow slurry or fast food slurry and the liver was harvested exactly 4 h later for targeted metabolomics. (A) Heatmap of the top 50 differentially expressed molecules within drinking water type, across diet. Groups listed above with samples contained within columns; row metabolite identification listed on left; z-score normalized values scaled by row (red = increase, blue = decrease, black = missing value or excluded outlier). (B) AC(18:1) and AC(18:2) demonstrate diet-driven changes in both control and antibiotic-treated mice. (C) PC(32:1) and AC(2:0) demonstrate antibiotic-driven changes in both chow and fast food diet gavage mice. (D) Spermidine and the hexose monosaccharides have dual diet- and antibiotic-driven changes, appearing highest in the fast food diet control water group. *q < 0.15, **q < 0.05 (Mann-Whitney U test). Abx = antibiotics; H1 = hexose monosaccharides; Cer = ceramide; PC = phosphatidylcholine; CE = cholesteryl ester; SM, sphingomyelin; AC = acylcarnitine; LPC = lysophosphatidylcholine; alpha-AAA = alpha-aminoadipic acid. n = 6–7 per group.
Additional comparisons across meals and microbiome status identified commonly occurring molecules that warrant further investigation. For example, the 18:1 and 18:2 acylcarnitine species vary significantly across meals, irrespective of an intact microbiome (Figure 4B). When comparing across gut microbiome status, 32:1 phosphatidylcholine and 2:0 acylcarnitine (Figure 4C), and triglycerides (Supplementary Figure S4) vary significantly for both meal types. Analogous to our plasma untargeted metabolomics analysis above (Figure 3D), metabolites dually dependent on fast food and the microbiome were sought after. Spermidine, an aliphatic polyamine compound, and the hexose monosaccharides demonstrated dual diet- and microbiome-driven changes, appearing highest in the control water fast food-gavaged group (Figure 4D). Together, this suggests that gut microbiome status has a larger influence on liver metabolites than meal type.
A Single Fast Food Meal Rapidly Alters Hepatic Gene Expression in a Gut Microbe-Dependent MannerGiven the marked portal blood metabolite signatures as well as the unique diet- and gut microbiota-dependent hepatic metabolome changes, we next aimed to understand the potential impact of a human relevant fast food meal on the host. We used an unbiased RNA sequencing approach to profile acute postprandial transcriptomic changes within the liver (Figure 5). Distinct diet- and gut microbiota-dependent clustering was apparent after NMDS analysis (Figure 5A). For mice with an intact gut microbiome, there were notable differences between the hepatic transcriptome of chow-gavaged and fast food-gavaged mice (Figure 5B). Importantly, these unique profiles were not retained in the microbiome ablated cohort suggesting a strong gut microbial dependency (Figure 5B–D), in agreement with the liver metabolomics results (Figure 4A). We observed an upregulation of Fmo3 encoding the enzyme responsible for conversion of TMA to TMAO in fast food fed mice on control drinking water, which could be related to the red meat component of fast food [8–10]. Pathway analysis revealed a surprising fast food-induced dysregulation of circadian rhythmicity associated genes (Figure 5E). These data were further corroborated using RT-qPCR where it was observed that the relative mRNA expression of Cryptochrome 1 (Cry1), a key repressor of the core circadian oscillator complex (Figure 5F) and Circadian Associated Repressor of Transcription (Ciart), a core clock-independent repressor (Figure 5G) are markedly upregulated upon consumption of a fast food meal in mice harboring an intact gut microbiome. Importantly, the transcriptional upregulation of these core clock dependent and independent circadian repressors was not observed in mice who consumed a fast food meal with an antibiotic ablated microbiome. Taken together, these data reveal rapid postprandial hepatic transcriptional changes that are strongly dependent on the diet with a possible gut microbial contribution.
The complex relationship between diet composition and the gut microbiome is an attractive target in the study of metabolic syndrome (MetS) and cardiovascular disease. Unfortunately, the vast majority of animal studies in this area study cardiometabolic phenotypes in the context of diets that have no relevance to what humans actually eat. For example, rodent chow is not standardized and changes according to raw materials available for animal food production, which changes seasonally. Even carefully formulated synthetic rodent diets such as the chemically-defined chow used here, or popular high fat or Western diets, do not accurately mimic the micronutrient and macronutrient content of common human diets. To overcome this, we instead provided a single human relevant fast food meal to mice with or without antibiotic-mediated suppression of the gut microbiome to understand the meta-organismal metabolomic signatures that arise after fast food dietary substrates are presented. The main findings of this study demonstrate that consumption of a single fast food meal: (1) rapidly alters the gut microbiome in a way that is not predicted by the microbes present in the fast food meal, (2) rapidly alters the portal and peripheral plasma metabolome in a microbiome-dependent manner, (3) rapidly alters the host hepatic transcriptome and metabolome in a microbiome-dependent manner, and (4) rapidly alters the expression of hepatic genes related to circadian dysregulation in a microbiome-dependent manner. Collectively, these data provide a glimpse into microbe-host interactions when relevant dietary substrates are provided, and bolster the concept that many host transcriptional and metabolic alterations fueled by consumption of fast food are shaped by the gut microbial endocrine organ [51].
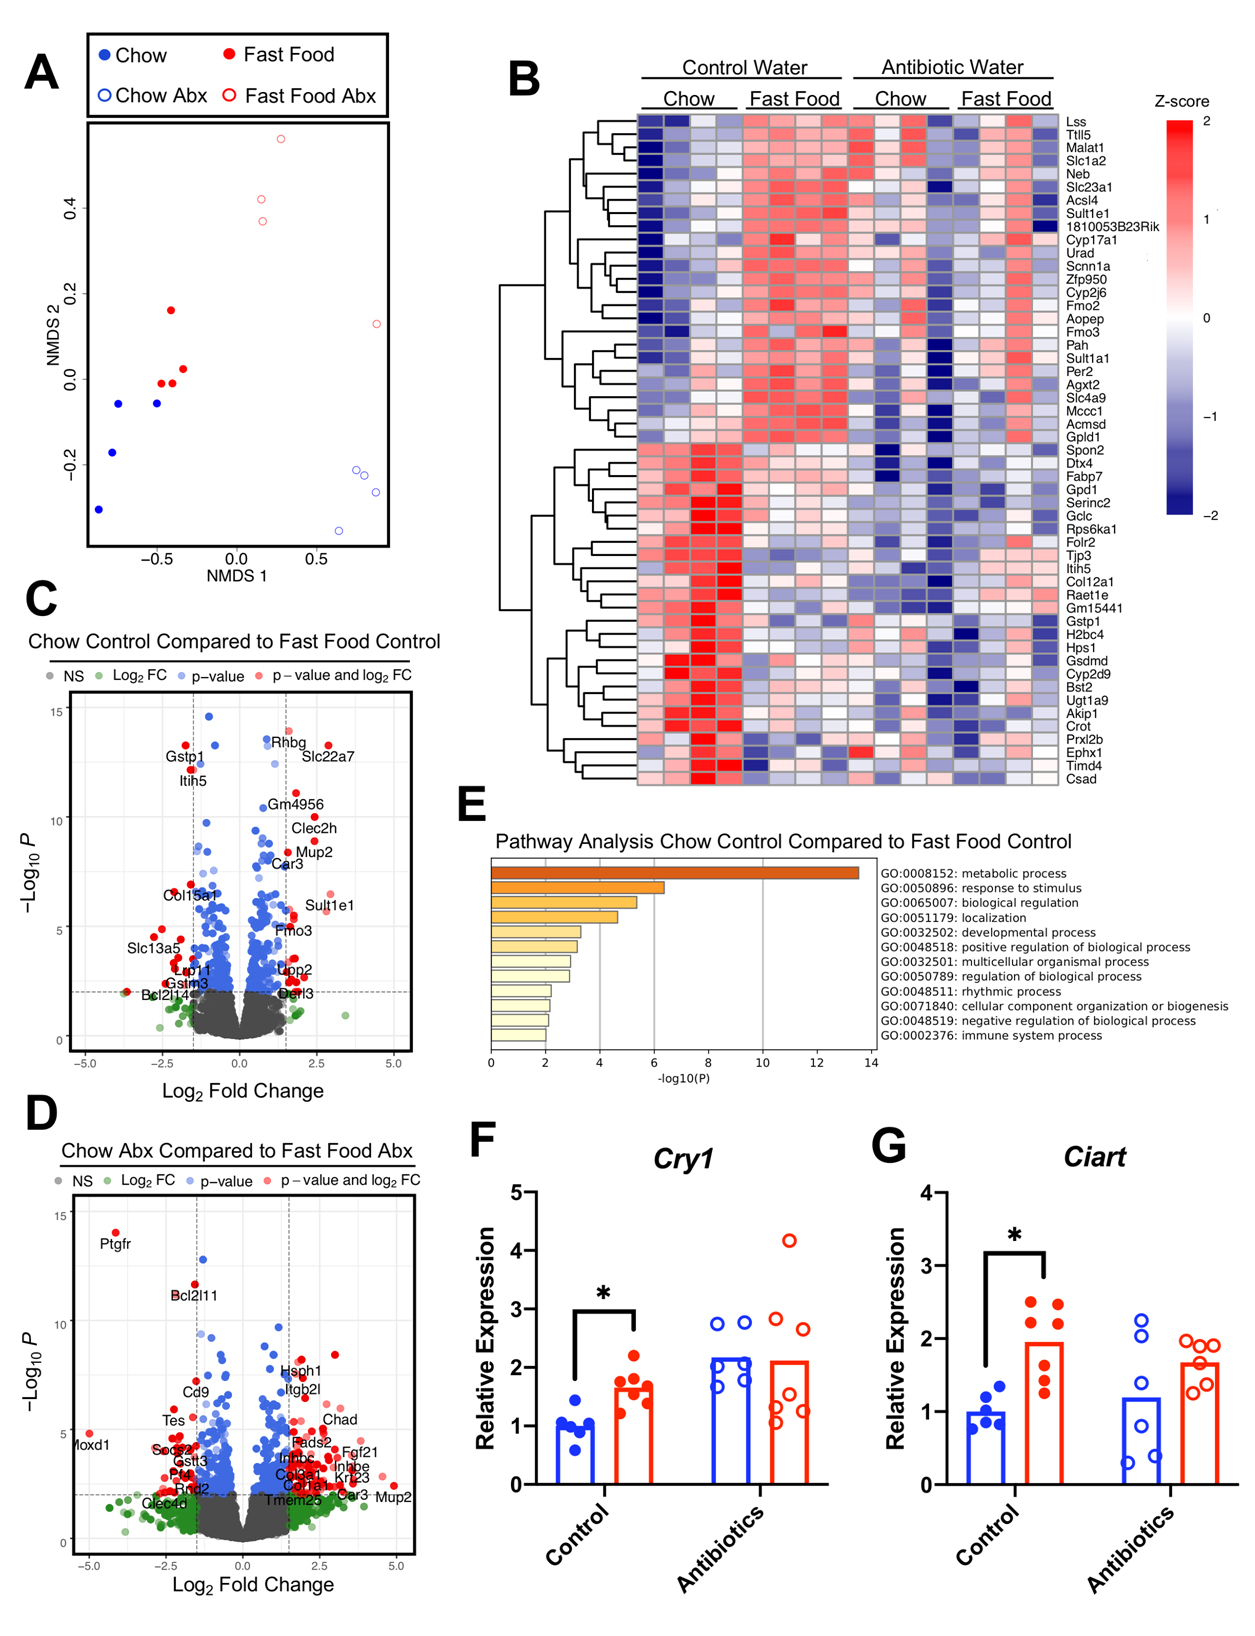 Figure 5. A Single Fast Food Meal Rapidly Alters Hepatic Gene Expression in a Gut Microbe-Dependent Manner. 6-week old male C57BL6/J mice were randomly assigned to control drinking water or drinking water supplemented with broad spectrum antibiotics for two weeks. Following an overnight fast, mice were given a single oral gavage of either chow slurry or fast food slurry and the liver was harvested exactly 4 hours later for bulk RNA sequencing. (A) NMDS of RNA-Seq transcriptome data representing the hepatic gene expression signature of the top 500 differentially expressed transcripts as sorted by log2 fold change between chow (blue) and fast food (red) in the absence (filled dots) or presence (hollow dots) of antibiotics. The NMDS was performed using DESeq2 normalized counts. (B) Heatmap of hierarchically clustered differentially expressed genes arranged by adjusted p-value and log2 fold change. Z-score normalized values scaled by row. (C) Volcano plot of RNA-Seq transcriptome data representing hepatic gene expression signature of chow control water mice to fast food control water mice. (D) Volcano plot of RNA-Seq transcriptome data representing hepatic gene expression signature of chow antibiotic water mice to fast food antibiotic water mice. Genes highlighted in red correspond to those that are significantly differentially expressed (adjusted p < 0.001) with a log2 fold change >1.5. (E) Parent gene ontology assignments of the top 150 differentially expressed genes as sorted by adjusted p-value between chow control water and fast food control water mice. n = 4 per group for all RNASeq analysis. (F–G) qPCR validation of differentially expressed circadian repressor genes revealed by RNA-Seq. Statistical analysis of qPCR data was performed using a two-way ANOVA with Tukey’s multiple comparison test where * p < 0.05, ** p < 0.01, *** p < 0.001, **** p < 0.0001. n = 6–7 for all qPCR analysis. Abx = antibiotics; NS = not significant; FC = fold change.
The past decade has seen an explosion of research associating the relative abundance of gut microbes to human disease, relying on classic 16S ribosomal RNA approaches or more recently by metagenomic deep sequencing. Large collaborative microbiome-focused research consortia have leveraged such methodology to catalogue the types of bacteria resident in the human intestine, and have shown that gut microbiome structure can be dynamically altered by several variables including diet, age, host genetics, and antibiotic exposure [52–54]. Among all of the environmental factors that impact gut microbiome structure, diet is clearly a major determinant shaping community structure and function [41–43]. Although it is well appreciated that diet can profoundly alter the gut microbiome, most studies to this point have focused on effects that occur after days or weeks on dietary intervention. Here, we show that a single human-relevant fast food meal can rapidly reorganize gut microbiome communities in mice. Strikingly, just 4 h after fast food consumption, gut microbiome shifts were observed that were largely independent of the microbial sequences that originated from the diets (Figure 2). For example, commensal food-associated bacteria such as Lactobacillus, Lactococcus, and Streptococcus were the most abundant genera in the fast food meal itself, yet these taxa did not contribute to remarkable shifts in the cecal microbiota of fast food gavaged mice. This highlights that the shifts in cecal microbiome composition are in response to dietary constituents rather than caused by background microbes that were present in the food. Although some of the observed differences in gut microbial community composition are consistent with previous findings, such as the negative association of Turicibacter with high-fat feeding [55–57] or positive association of Enterococcus with obesity [58], these data should be cautiously interpreted due to their correlative and often discrepant nature [59]. In mice with an intact gut microbiome (that were receiving control drinking water prior to gavage), the administration of a fast food gavage led to changes in cecal microbial content, with notable increases in the pathobiont Enterococcus and Parasutterella, while the opposite was seen in antibiotic water treated groups. Interestingly, a striking increase in Burkholderia/Paraburkholderia was observed in the fast food antibiotic water group, likely due to the proliferation of antibiotic-resistant colonizers. These data, coupled with many other recent published reports, support the notion that a single meal can have profound effects gut microbiome community structure [60,61].
It is clear that consumption of key dietary substrates can shape the types of bacteria that are present in the intestine, but less is understood about the complex interplay between dietary substrate availability, gut microbe-derived metabolite production, and downstream co-metabolism driven by the host. The use of LCMS-based metabolomics has become a powerful tool in the study of human health and disease, particularly in identifying meta-organismal nutrient metabolism pathways [62–66]. Here we used an untargeted metabolomics platform as an unbiased approach to identify gut microbe-derived metabolites that are produced postprandially after a human-relevant fast food meal. We focused our efforts on postprandial metabolites that were enriched in the portal circulation, given that many microbe-derived metabolites are rapidly converted to secondary metabolites in the host liver. The untargeted metabolomics platform we used here is only able to structurally predict <10% of the metabolites detected, and further structural validation is needed for each putative spectral feature in the dataset. To aid with future investigation of diet-microbe-host metabolomic data, we have generated a computer program using Python coding language to perform multigroup analyses and identify metabolites meeting a particular distribution profile (Supplementary File S3). Multiple criteria were fed into this program to identify fast food-altered and gut microbe-dependent metabolites (Figure 3D-G). Although we were not able to structurally identify all microbiota-associated fast food-driven metabolites, we did confirm one such metabolite as 18:0 lysophosphatidic acid (LPA) which increases preferentially in the portal blood of mice provided fast food substrate, yet this fast food-induced spike is suppressed by antibiotic treatment (Figure 3E). The results shown for 18:0 LPA are consistent with its pharmacokinetic profile of undergoing rapid first-pass hepatic metabolism [67]. Interestingly, 18:0 LPA has previously been associated with liver dysfunction and cardiovascular disease [68,69]. A number of other putatively identified metabolites were found to match this distribution profile, and their information listed in Supplementary File S1. Although beyond the scope of this work, further structural identification of other fast food-derived gut microbial metabolites identified here has the potential to provide new links between fast food, the gut microbial endocrine organ, and human disease.
In addition to performing untargeted metabolomics in the circulation, we also set out to understand the transcriptomic and metabolomic alterations driven by a fast food meal in the host liver. Quantitative targeted metabolomics was performed to detect molecular species of key metabolite classes including amino acids, biogenic amines, carbohydrates, acyl-carnitines, polar lipids, and neutral lipids. The diet- and antibiotic-driven liver lipid profiles (Supplementary Figure S4) and liver metabolite profiles (Figure 4) varied significantly between meal type just four hours after gavage, though a larger effect was seen as a result of antibiotic administration (Supplementary Figure S3). Spermidine levels varied both in a diet- and microbe-dependent manner, appearing highest in livers of the control water fast food group. Spermidine is an aliphatic polyamine compound that is obtained from diet, synthesized endogenously, or produced by intestinal bacteria [70] and has been associated with a number of positive physiologic effects such as increasing lifespan as well as negative pathologic effects such as tumorigenesis [71,72]. Its expression pattern, appearing higher in fast food mice with an intact microbiome compared to their antibiotic treated counterparts, implicates the induction of host de novo biogenesis or alterations of spermidine-producing gut microbes in response to a fast food meal.
In an effort to determine the putative impact of these portal blood and hepatic metabolites on the host, an unbiased RNA-sequencing approach was used to profile the liver transcriptome. In the control water groups, there was a marked difference in gene expression between meal types (Figure 5B left side), though these diet-driven changes were not seen in the antibiotic water groups (Figure 5B right side), implicating the gut microbiome in diet-driven host transcriptional changes. This pattern was congruent with the liver metabolomics results (Figure 4A left side, 4A right side ), further supporting a possible gut microbial contribution. The expression of flavin-containing monooxygenase 3 (Fmo3), encoding the enzyme responsible for converting gut microbe-derived trimethylamine (TMA) to its heart disease-associated co-metabolite trimethylamine-N-oxide (TMAO), was found to be higher in the fast food group compared to chow group of mice with an intact microbiome. As expected, the fast food meal did not promote an increase in Fmo3 expression in the antibiotic treated groups. This is yet another example whereby the expression of Fmo3 is altered in mouse models of progressive cardiometabolic disease [73–76]. Of note, consumption of a fast food meal promoted hepatic transcription of several circadian repressors, but only in mice with an intact gut microbial community (Figure 5B,E–G). These data coincide with the collective understanding that diet can influence circadian rhythmicity and in the case of high fat and Western diets, cause marked disruption of circadian oscillatory programs [77–79]. Moreover, the gut microbial contribution to host circadian rhythmicity and metabolism has been established in recent years, underscoring the complexity of microbe-host interactions [80,81]. Collectively, this study utilized a multi-omics approach to study the interrelationship between varying diets and the gut microbiome to gain novel insights toward MetS and cardiovascular disease. The multi-omic data generated here can be used as a lens to focus further investigation into mechanisms by which fast food diets promote cardiometabolic disease.
Herein, we have leveraged a multi-omics approach to identify microbial metabolites produced postprandially from a single fast food meal. This approach differs from conventional rodent models of MetS by introducing a single meal equivalent that more closely recapitulates a human Western diet. Leveraging tools such as 16S rRNA gene sequencing, untargeted and targeted metabolomics, and host RNA sequencing, we uncovered distinct diet- and gut microbe-dependent metabolites and their associated impact on the hepatic transcriptome. Important to note, limitations of this study include but are not limited to the fact that antibiotic ablation does not completely eliminate the gut bacterial community and has been reported to reduce dietary lipid absorption in rats and mice [82,83]. The use of germ-free mice would offer a more rigorous method to study the microbial aspect in terms of metabolites and ruling out hepatic transcriptional changes due to the antibiotics themselves. However, there are caveats to using germ-free mice, as they are known to have underdeveloped immune systems [84–86]. Moreover, studying the mouse microbiome with human relevant diet is limiting and it may be more appropriate to study a mouse colonized with a human derived microbiome, although this approach has its own limitations [84]. Finally, murine fat metabolism differs from the human condition such that mice lack cholesterol ester transfer protein (CETP) and have divergent lipoprotein profiles compared to humans, potentially limiting the translational relevance of the findings reported herein. Our data suggest that following the consumption of a single human-relevant fast food meal, unique diet- and gut microbe-dependent metabolites are detected in addition to rapid transcriptional reprogramming of the liver. Further investigation is warranted to determine if these metabolites are causally linked to host transcriptional changes and the development or progression of MetS.
The datasets generated from (or analyzed in) the study can be found in the supplementary files or have been deposited in NCBI's Gene Expression Omnibus [34] and are accessible through GEO Series accession number GSE165756.
Supplementary Figures and Tables (PDF, 6.8MB)
Supplementary File S1 (ZIP, 6.9MB)
Supplementary File S2 (ZIP, 120KB)
LJO and JMB designed the study. LJO, AK, and ADG performed the mouse experiments. DO, RB, ALB, TDM, BBW, and MG performed all mass spectrometry and subsequent analysis. NS performed the analysis of 16S rRNA sequencing data. PL and GAMC compiled the nutritional information for each diet. LJO, DO, JC, and JMB analyzed the data. LJO, DO, JC, and JMB wrote the paper with input from all authors.
The authors declare that they have no conflicts of interest.
This work was supported in part by National Institutes of Health grants R01 DK120679 (JMB), P01 HL147823 (JMB), P50 AA024333 (JMB), and R01 DK130227 (JMB). JC is supported by seed funding from the Cleveland Clinic Foundation, a Research Grant from the Prevent Cancer Foundation (PCF2019-JC), an American Cancer Society Institutional Research Grant (IRG-16-186-21) and a Jump Start Award (CA043703) from the Case Comprehensive Cancer Center.
We would like to thank the University of Chicago Genomics Core for the hepatic RNA sequencing service and the Northwestern University Genomics Core for the alignment and count assignment of RNASeq reads. Additionally, we would like to thank the Children’s Hospital of Pennsylvania Microbiome Center (PennCHOP) for 16S rRNA sequencing services and Beth Israel Deaconess Medical Center’s Metabolic Core for the Oxygen Bomb Calorimetry analysis.
1.
2.
3.
4.
5.
6.
7.
8.
9.
10.
11.
12.
13.
14.
15.
16.
17.
18.
19.
20.
21.
22.
23.
24.
25.
26.
27.
28.
29.
30.
31.
32.
33.
34.
35.
36.
37.
38.
39.
40.
41.
42.
43.
44.
45.
46.
47.
48.
49.
50.
51.
52.
53.
54.
55.
56.
57.
58.
59.
60.
61.
62.
63.
64.
65.
66.
67.
68.
69.
70.
71.
72.
73.
74.
75.
76.
77.
78.
79.
80.
81.
82.
83.
84.
85.
86.
Osborn LJ, Orabi D, Goudzari M, Sangwan N, Banerjee R, Brown AL, et al. A Single Human-Relevant Fast Food Meal Rapidly Reorganizes Metabolomic and Transcriptomic Signatures in a Gut Microbiota-Dependent Manner. Immunometabolism. 2021;3(4):e210029. https://doi.org/10.20900/immunometab20210029

Copyright © 2021 Hapres Co., Ltd. Privacy Policy | Terms and Conditions


