Location: Home >> Detail
J Sustain Res. 2024;6(2):e240035. https://doi.org/10.20900/jsr20240035
 ,
Shahad S. Ibrahim 1,
Ahmed Khalid 2,
Ali Alkhabbaz 2,
Hudhaifa Hamzah 1,
Ali Basem 3,
Haider K. Easa 4,
Ali Hassan 5
,
Shahad S. Ibrahim 1,
Ahmed Khalid 2,
Ali Alkhabbaz 2,
Hudhaifa Hamzah 1,
Ali Basem 3,
Haider K. Easa 4,
Ali Hassan 5
1 Mining Engineering Department, College of Petroleum and Mining Engineering, The University of Mosul, Mosul 41200, Iraq
2 Mechanical Engineering Department, College of Engineering, The University of Mosul, Mosul 41200, Iraq
3 Air Conditioning Engineering Department, Faculty of Engineering, Warith Al-Anbiyaa University, Karbala 56001, Iraq
4 Department of Computer Engineering Techniques, College of Engineering Technology, Al-Kitab University, Kirkuk 36015, Iraq
5 School of Computing, Engineering and Digital Technologies, Teesside University, Middlesbrough TS1 3BX, UK
* Correspondence: Ahmed M. Daabo.
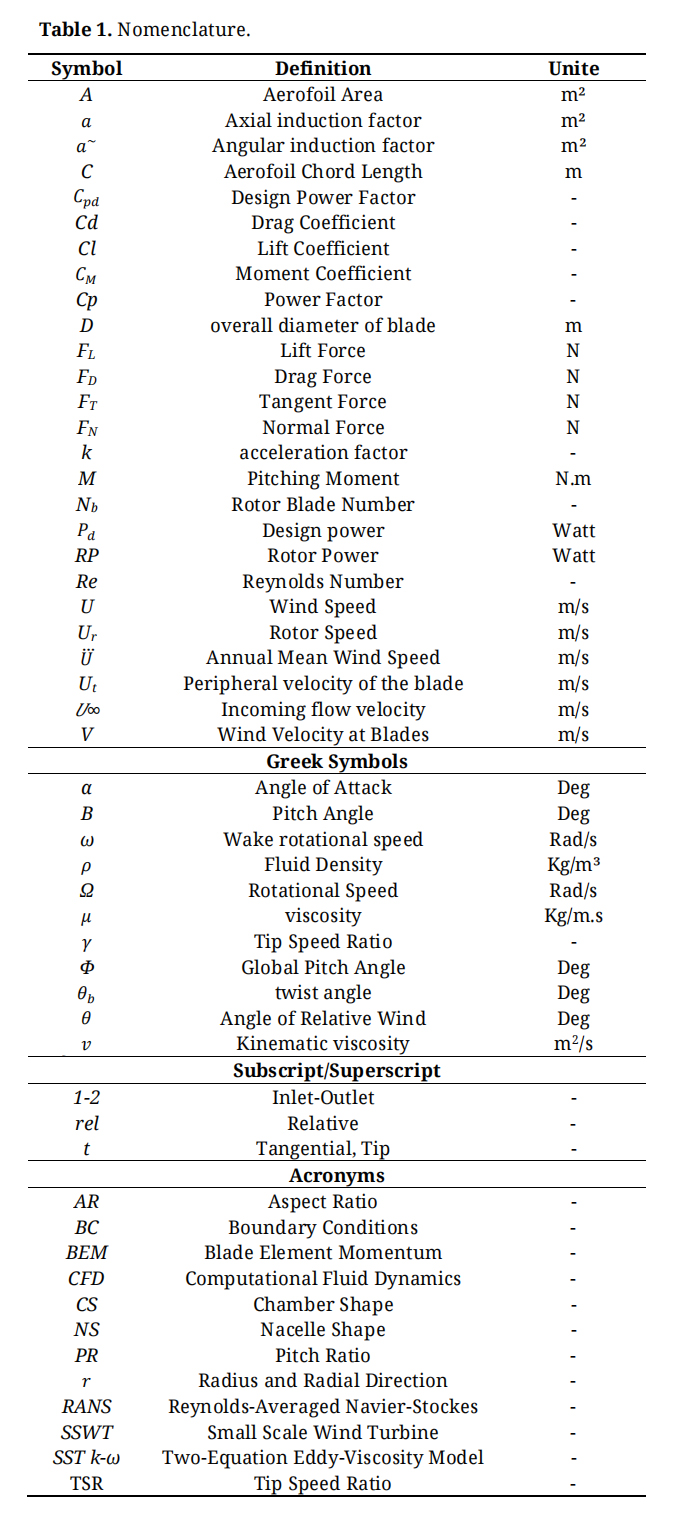
In recent years, there has been a significant increase in research efforts aimed at enhancing the efficiency of clean and renewable energy sources, particularly in the field of wind turbine energy. In order to reduce drag forces and maximise power output, a comprehensive analysis was conducted in the current study to investigate the impact of various geometric factors on Small Scale Wind Turbine (SSWT) performance. The effects of blade chamfer shape, pitch angle between blades, nacelle shape, and blade aspect ratio were examined. The analysis was conducted by varying wind speed values while keeping temperatures and atmospheric pressure constant. The Reynolds-averaged Navier-Stokes (RANS) equations, together with the continuity and momentum equations, are solved using the commercial Computational Fluid Dynamics (CFD) algorithm in Ansys software. The study revealed that the blade chamfer form had the greatest impact on the turbine power output, with the blade pitch angle being the second most critical factor, particularly at higher wind speeds. Moreover, at a velocity of 3 meters per second, the SSWT model demonstrated its peak power output when utilizing a chamfer ratio of 0.25. Conversely, when the wind speed increased to 10 meters per second, the turbine's maximum power output was observed at a chamfer ratio of 0.28. These findings demonstrated the significance of using this technology in wind turbines. The model's achieved power was similarly influenced by the nacelle form and blade aspect ratio, but to a lesser degree.
Energy may be acquired by several methods, such as thermal, steam, and petrol stations, which rely on the combustion process and use fossil fuels as an energy source. Additionally, there are power plants that generate clean, renewable energy [1-3]. Furthermore, wind energy has lately been investigated in other global regions, including areas that are considered to be abundant in oil resources. Howland et al. [4] have provided a detailed analysis on how operational farm wind turbines have increased total energy production.
The research done by Musheisen et al. [5] examined and compared the behaviours and performances of multi-cross-section blades with single-cross-section blades. The use of supercritical airfoils in the construction of the multi-cross-section blades resulted in the attainment of the maximum power coefficient. These blades were fine-tuned based on the Blade Element Momentum (BEM) theory utilising the F.90 code and QBlade software package. Mansi et al. [6] performed a research, using both numerical simulations and experiments, to emphasise the impact of a trailing edge flap on the performance of a small scale horizontal axis wind turbine. The aim of the research project was to develop a new blade configuration by integrating a fixed trailing-edge flap into a baseline design profile using QBlade software. This programme efficiently solves the equations of the Blade Element Momentum (BEM) model using an iterative process. Furthermore, the acquired results will be validated using the Computational Fluid Dynamics (CFD) methodology.
A multitude of recent publications have focused on improving wind turbine blades. For instance, Pasha and Elfawal [7] aimed to find the most efficient design for the airfoil by suggesting different geometries with equal cord lengths, which are expected to produce higher lift coefficient values. Following that, a quantitative analysis is performed for each proposed shape and the results are compared to the previously recorded data of a well-known airfoil. Qian et al. [8] performed numerical simulations to analyse how deformable trailing edge flaps affect the aerodynamic efficiency of the FFA-W3-241 airfoil in reducing the fluctuating forces during dynamic stall situations. Additionally, simulations were performed using the OpenFOAM framework, applying the Reynolds-averaged Navier-Stokes (RANS) method with the SST k-ω turbulence model and dynamic mesh technique. Subsequently, comparison computations were conducted to evaluate the impact of deformable trailing edge flaps dimensions and deflection angle on the stationary airfoil. In addition, extensive simulations were conducted to get a more profound comprehension of the aerodynamic properties related to the coupled oscillatory movement of the airfoil and deformable trailing edge flaps dimensions. The findings demonstrated that maintaining a constant angle of attack for the airfoil, the deflection of the flap resulted in a simultaneous augmentation of both lift and drag. The influence of flap deflection on the pressure distribution near the wall varies depending on whether the flow remains connected or becomes split. This phenomenon is more prominent when using bigger flaps. Moreover, the airfoil's critical angle of attack is influenced by both the length and direction of the flap deflection.
In their work, Esfahanian et al. [9] used both 2D and 3D models to improve the efficiency of a wind turbine. They suggested the described approach for its low computational requirements and high accuracy. A research was done to investigate the impact of turbulent flow on the efficiency of a small scale vertical wind turbine. This work used both experimental and numerical methods, specifically using computational fluid dynamics (CFD) analysis [10]. The findings indicated that the turbulent flow had a twofold effect on the turbine. The turbine's performance is enhanced by increasing the available kinetic energy at low wind speeds. However, the turbine's efficiency is compromised at high wind speeds. Huang et al. [11] used trailing edge flaps to create a sinusoidal disturbance on the helical tip vortex system with perfect control. To activate the unstable modes of the tip-vortex system, oscillating flaps will be positioned at the tip and in the middle region of the blade. The two flaps on a single blade will be bent in opposing directions, causing negligible change to the total force on the wind turbine blade. The comparison between the flow with and without oscillating flaps revealed that the movement of the flaps causes the tip-vortex core to shift by roughly 5% of the rotor radius. Additionally, the incorporation of a central span flap serves to offset this issue, leading to a discrepancy in the bending moment and torque at the root that is below 5% when compared to the scenario where the flaps remain stationary.
The selection of the optimal airfoil for the small wind turbine design was established in [12] by conducting an aerodynamic improvement of the airfoil used in the blades of an 11 kW turbine. The wind turbine's aerodynamic efficiency was improved by altering the shape of the aerofoil. The optimal airfoil for the tiny wind turbine design was identified, leading to an enhanced power coefficient of 0.42. The main aim of a research done in [13] was to examine the varying flow across the rotor and the immediate wake, with specific focus on the impact of the tower and nacelle utilising the MEXICO wind turbine. A sliding mesh approach was used to enhance the interaction between the blades and the tower. The simulations were performed at different tip speed ratios to evaluate the general suitability of the model and study the turbulent wake state, design condition, and separated flow condition. The findings indicated that the tower has a negligible impact on the loads encountered by the rotor, which are shown in a circular fashion. Nevertheless, the blades have a significant impact on the tower, producing a design that resembles a three-leaved rose. Significant variations in forces are seen only on the blades.
In their study, Bhavsar et al. [14] propose a novel approach to enhance the design of the thick aerofoil DU-99-W-405. They recommend including a slot with a multi-element aerofoil concept, and they investigate the effects of placing the slot at five different points along the chord using numerical simulation techniques. The scientists determined that the aerodynamic efficiency of a thick aerofoil significantly improved when a slot was used as a passive flow control device. The article [15] presents and discusses a comprehensive evaluation of blade load, along with the main challenges and advancements related to wind turbine blades and their use. The study explores several facets pertaining to the design, measurement, and regulation of wind turbine blades within the wind power sector. The text highlights the need of comprehending blade loads to ensure dependable turbine functioning. It also acknowledges the difficulties associated with blade load analysis, including the intricate and fluctuating aerodynamic load and the dynamic stall issue. Wang et al. [16] introduced a novel design for a variable pitch wind turbine, especially tailored for a horizontal axis layout. The turbine has an active variable pitch system, which guarantees the dependability of its functioning. In order to assess the efficacy of the selected mechanism, model verification and stress simulation assessments were performed. The stress simulation findings were used to optimise the essential components of the variable pitch mechanism by using lightweight design strategies. The study conducted by Shukla et al. [17] investigates the impact of various angle of attack values on the design parameters of a NACA0018 aerofoil for a vertical axis wind turbine blade. The analysis was performed using the finite difference method and Ansys/Fluent simulation analysis. The findings indicated that an angle of attack of 15° resulted in a uniform distribution of velocity and a satisfactory power coefficient of 0.354. However, the maximum lift coefficient was achieved at an angle of attack of 12°, with a corresponding power coefficient of 0.169. Moreover, the impact of using artificial intelligence on blade optimisation and the advancement of the turbine blade profile, as determined by the power coefficient, is documented in reference [18]. Madasamy et al. [19] performed a research on a small scale horizontal axis wind turbine, analysing its structural, aerodynamic, exergy, and energy aspects using computational fluid dynamics (CFD). The authors conducted a research to examine various profiles of wind turbine blades in terms of their aerodynamic efficiency. They then performed structural studies and experimental validation using a 1 kW wind prototype to confirm the obtained findings. By using the method of multi-disciplinary optimisation, the authors achieved a significant improvement in the final design of the model. They were able to reduce the mass by around 20% and increase the exergy efficiency by 15%.
R et al. [20] built a mathematical model using Matlab-Simulink and looked into a number of factors that affect the way wind turbines produce electrical energy. The factors influencing wind turbines include active flaps, active tip, active twist, wind speed (which is influenced by temperature and affects air density), power factor (dependent on pitch angle and blade tip speed), and edge speed. Modelling and simulation technology is crucial in the design and study of different systems [21], turbomachinery, which works with similar aerodynamic principles, components [22], and wind turbines. It offers a user-friendly graphical interface that facilitates the creation, manipulation, and validation of mathematical models. The studies have also shown a correlation between the fluctuation of wind speed over time and both the wind speed and tip speed. Recently, researchers have shown a growing interest in micro-scale, by carrying out the work achieved in [23] and small scale (1 to 100 kW), based on Daabo et al. [24] turbines. Prior studies have also documented efforts to optimise the blades of the turbine, which will be the authors' next work, [25-27]. In addition, Singh et al. [28] conducted a research where they used Ansys/CFD to do a 2D numerical optimisation of a 6 m long blade for a 10 kW wind turbine. The findings shown that the optimised blade design exhibits superior aerodynamic performance at the specified wind speed. Furthermore, Akbari et al. [29] did a research on the multi-objective optimisation of several aerofoil designs for a micro-scale, 1 kW, horizontal axis wind turbine. The primary goals were to minimise start-up time and maximise the power coefficient value. The findings indicated that the choice of aerofoil design used in the turbine blade has a substantial impact on both the initial operation and the aerodynamic efficiency of the turbine.
As far as the authors are aware, no prior research has been published that examines the combined impact of both the nacelle design and the blade shape on the performance of wind turbines. Furthermore, there has been no prior study that has specifically focused on the aerodynamic performance of these forms utilising three-dimensional viscous flow calculations at several values for each shape. The present study aims to emphasise the significance of using this contemporary technology in the existing and next iterations of wind turbine designs.
This paper is structured to have the methodology, where the procedure followed in the current work is presented, in the Methodology section. The small scale wind turbine meanline design and the governing equations which were employed during the model design are presented in the meanline and the governing equation sections respectively. The model generation, mesh generation, the software required settings and the current work validation are all mentioned as sub-sections which are included in numerical analysis and CFD model. The effect of each of the four investigated parameters individually, was shown and discussed in the results and discussions. Finally, the conclusion and the future studies are presented in the conclusion.
This research examines crucial elements that significantly impact the performance of Small Scale Wind Turbine (SSWT), including the forms of the nacelle and turbine blades. The goal is to identify the optimal configuration for maximising the performance of a SSWT model. Using Ansys/Workbench/Design Modeller, the wind turbine model was first created, beginning with the meanline design. The blade Aspect Ratio (AR), blade Pitch Ratio (PR), Chamber Shape (CS), and Nacelle Shape (NS) have been extensively examined to determine their impact on the turbine's performance at different wind speeds using Ansys/Fluent solver. More details about each step are mentioned in numerical analysis and CFD model. Once completed, the values of each of aforementioned parameters that provide optimal model performance have been determined.
Meanline design is considered a simple and direct method to figure out the overall shape and dimensions of the model geometry under investigation. The authors' previous works [30-32] have followed the same procedure in designing the turbines' components. The wind turbine effectively converts the wind's kinetic energy into mechanical form. Consequently, the turbine rotor typically operates under harsh and unstable conditions caused by wind shear, which refers to frequent and sudden changes in wind direction and speed. Additionally, the wind turbine encounters vortices interactions and high turbulence between its different structural components. Thus, the aerodynamic prediction model for wind turbines is quite complex. Considering the aforementioned factors, the wind turbine's aerodynamic prediction model heavily relies on previous design theories of propellers and helicopters, with suitable modifications and assumptions for wind rotor design [33]. The initial simple model for wind turbine aerodynamic prediction was put forth by Rankine [34] and Froude [35] as a stationary actuator disk for ship propellers. This model was later expanded by Joukowski [36] to incorporate the effect of the rotating actuator disk. Subsequently, Betz [37] introduced a simple model for predicting the maximum power output from an ideal rotor, known as the "Betz limit". Glauert [38] then extended this model to 2D flow, considering the effect of static loads on the wind turbine rotor, leading to what is now referred to as BEM theory. BEM theory combines blade element theory, which analyses the forces generated by lift and drag coefficients along the blade span, and momentum theory, which determines the momentum balance on the rotating annular stream tube passing through a turbine [39].
If the rotational velocity of the wind turbine's rotor is insufficient, a substantial portion of the wind will traverse directly through the aperture between the blades, thus rendering it devoid of power. Conversely, if the rotor attains excessive speeds, the blades will lose their distinctness and mimic an impenetrable barrier to the wind. Moreover, the spinning of the rotor blades engenders a state of turbulence within the surrounding air. If the successive blade approaches with undue haste, it will inevitably collide with side turbulent air. Consequently, there are instances wherein decelerating the motion of the blades proves more advantageous. BEM theory assumes that the blade is composed of a finite number of independent elements evenly distributed along the blade span. Two-dimensional airfoil theory is utilized to calculate the aerodynamic normal forces generated at each blade section based on a known radial position [40].


Figure 1 illustrates the airfoil theory at each blade element. Equations (1) and (2) are employed to estimate the aerodynamic thrust and torque as functions of lift and drag coefficients at each blade element [39].
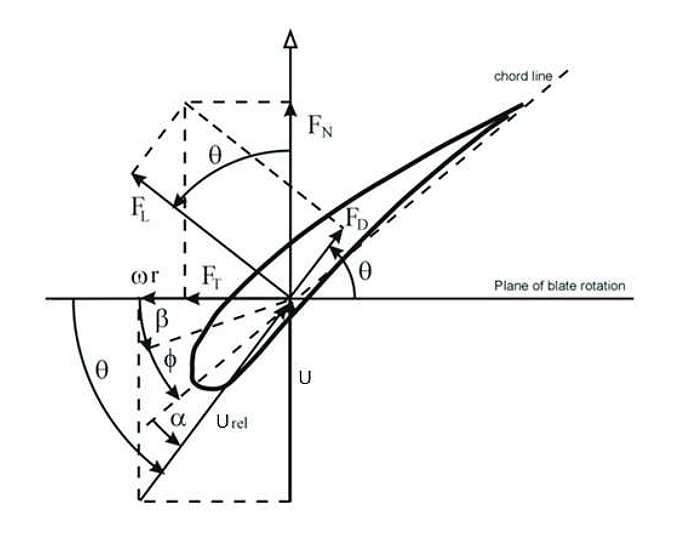 Figure 1. Wind turbine blade with the aerodynamic forces [33].
On the contrary, the theory of momentum postulates that the turbine rotor functions as a frictionless permeable actuator disk. It comprises an infinite number of blades that operate as a drag mechanism, achieved through a decrease in pressure across the turbine rotor [39]. The aerodynamic forces in both the axial and tangential directions can be determined by applying the principle of conservation of momentum in a wind stream. Equations (3) and (4) are utilized to forecast the torque and thrust force at each stream tube [33].


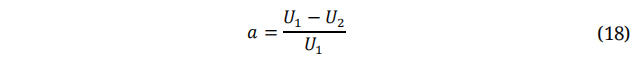
Equating equations (1), (3) enables us to determine the axial induction factor, denoted as a, which quantifies the rate of change of wind velocity in the axial direction, will be discussed in the next section. By combining equations (2) and (4) in the context of torque, we can derive the tangential induction factor, denoted as a~ which characterizes the rate of change of rotational velocity across the blade. The Blade Element Momentum (BEM) theory follows an iterative approach, where these induction factors are employed to compute the relative wind speed. This relative wind speed plays a crucial role in calculating the aerodynamic forces acting on each blade element. The aforementioned process is repeated until the induction factors satisfy the convergence criteria, thereby ensuring acceptable results. The design wind velocity can be determined by utilizing an empirical equation (5). The fundamental design parameters for the small scale wind turbine can be found in Table 2.
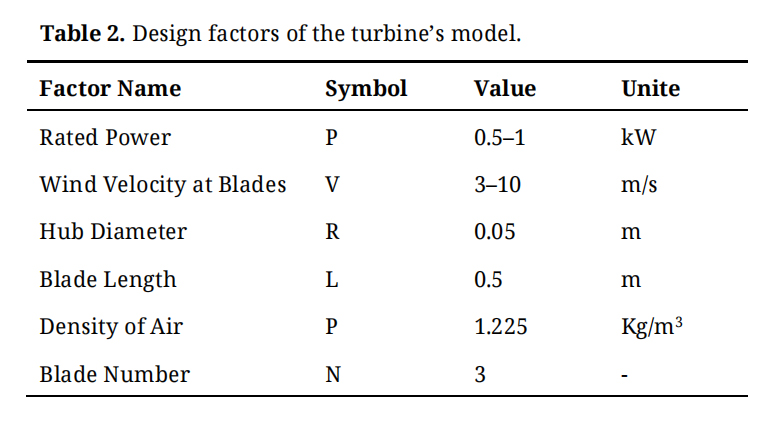 Table 2. Design factors of the turbine's model.
If the achieved power from the turbine is at its design point (𝑃𝐷), the rotor diameter can be determined from the next equation:

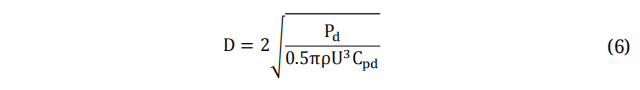
Here Cpd is Design Power Factor. Several theories exist that are utilized for the prediction of aerodynamic performance and the calculation of an optimal distribution of chord length and twist angle [40-42]. The model that is commonly attributed to Betz is considered to be the simplest model used in the design of wind turbine blades [43]. However, this model does not consider the impact of turbulence and rotational forces on the blade tip. Equations (7-10) are employed to determine the optimal distributions of chord and twist at each blade element. To extract the utmost power potential from the wind, it is essential that wind turbines are meticulously fashioned with tip speed ratio values γ. The Tip Speed Ratio (TSR) can be defined as the ratio between wind speeds to the tangential component of the blade tip. The latter holds great significance in the design of wind turbines. TSR denotes the relationship between the velocity of the wind and the velocity of the wind turbine blades' tips. The TSR is the defined ratio between the incoming wind speed and the tangential speed at the blade tip. The TSR is influenced by several factors, including the number of blades and the intended purpose of the wind turbine. For three-bladed wind turbine and electric power generation applications, the design value of TSR should fall within a range between 4 to 10 [44,45]. In this study, the design tip speed ratio of five has been chosen. By multiplying the design wind speed by the design tip speed ratio, the tangential velocity at the blade tip is estimated to be 50 m/s, and the rotor speed is 575 rpm.
Where V is the Wind Velocity at Blades and U is the Wind Speed. The angle at which the relative wind velocity coincides with the Global Pitch Angle is known as ϕ and can be defined as:


Where C is the Aerofoil Chord Length, Nb and Cld, α and θb represent the blade number and the designed drag coefficient, twist angle, angle of contact and blade twist angle, respectively. The mean-line design methodology is a highly iterative procedure.
Small scale wind turbines have been specifically designed to function under certain conditions, including low wind speed, low angle of attack, and the ability to start up on their own [46]. The blade profile plays a crucial role in determining the overall aerodynamic performance of the turbine. Structural analyses [47,48] should also be considered in designing such profiles. For 70% of the blade span, an actual airfoil shape is utilized, starting from the tip. The remaining portion of the blade span adopts a transitional shape that transitions from a circular airfoil at the blade root to the actual airfoil profile. While studying or enhancing the airfoil of the wind turbine blade is out of the scope of the current work, it is important to note that there are various modern families of airfoils have been developed specifically for wind turbine blade design, including the NACA-Series, S-Series, and DU-Series, among others [49-51]. The selection of an appropriate aerofoil should consider several factors that can impact the blade's aerodynamic performance, such as the Reynolds number, angle of attack, and the ratio of lift to drag coefficients [52]. The key non-dimensional parameter for outlining the fluid flow characteristics conditions is the Reynolds number (Re). In wind turbine typical ranges are within the range of 0.5 to 10 million. The latter is defined as:
Where; ρ: Fluid Density; U: Wind Speed; C: Aerofoil Chord Length; μ: viscosity and ν: Kinematic viscosity.
The term "Ut" denotes the peripheral velocity of the blade. In the case of small scale horizontal wind turbines with a rotor diameter less than 1 m, the chord length of the mid-span of the blade can be approximated as 0.12 m. Consequently, the design Reynolds number was estimated to be within 106 [53]. An empirical equation (9) is employed to approximate the optimal value of the tip speed ratio and the corresponding angle of attack, which results in the highest lift to drag coefficients ratio [54].
Here, the 2D lift coefficient can be defined as:

Where, FL is Lift Force & A is the Aerofoil Area which equals to Chord*Span.
Similarly, the 2D drag coefficient is:

FD: Drag Force.
From the authors' previous works, Figure 2 shows the corresponding values of the power coefficient values with respect to various values of tip speed ratio and angle of attached.
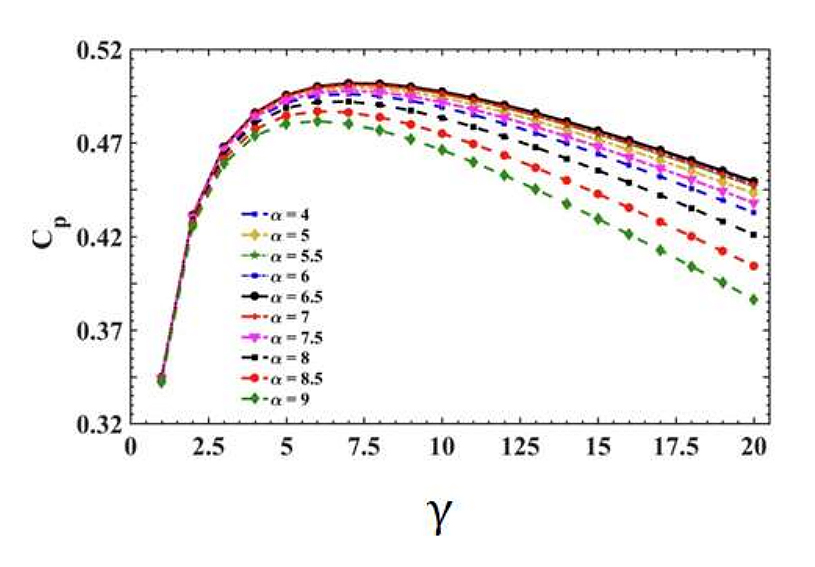 Figure 2. Predictable power coefficient values w.r.t some values of tip speed ratio [55].
The moment coefficient will be:
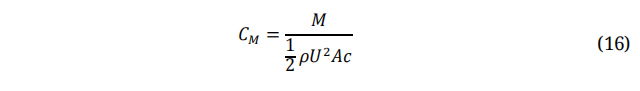
Where, M is Pitching Moment and C is Aerofoil Chord Length.
For a thin aerofoil, the blade tip is designed using low drag to lift ratio, where the root is designed by means of thick version of the same aerofoil which designed for structural support.
The torque on the ring equals the angular momentum rate of the air goes by the ring can be calculated using the following relation, where 𝑈∞ represents the incoming flow velocity.

Where;
1, 2 referred to inlet and outlet, respectively. Similarly,

The angle at which the relative wind velocity coincides with the plane of rotation is known as φ and can be defined as:

The chord distribution along the radial distance of the blade span can be given as shown in the next equation:
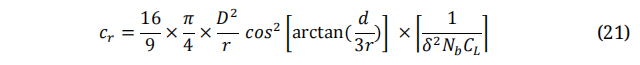
Where: D is the overall diameter of blade, d and r are the diameter and incremental radius, respectively.
The twist distribution using the zero-twist lift line [54] is given in the next two equations:
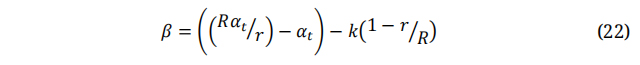
Here: β is the pitch angle, αt is the angle of attack at the blade tip and can be determined using the following forma:

Here, βt is the pitch angle at the tip (βt ≈ 0°), k is the acceleration factor (k > 0) [56].
Flow chart in Figure 3 presents the procedure followed during the analysis of the current work.
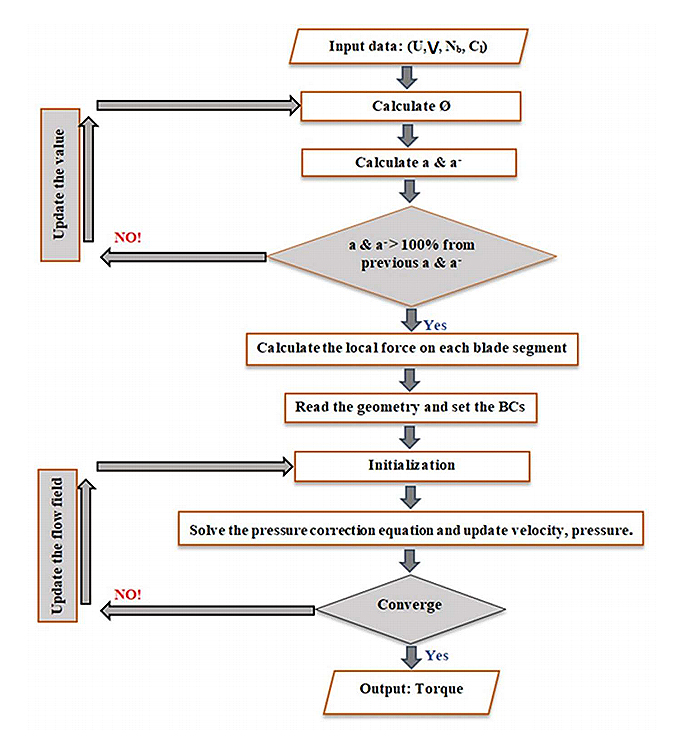 Figure 3. The procedure followed during the current study.
In the following sub-section detailed information about the procedure followed during the numerical analysis and the CFD modelling is described below. ANSYS CFD is a high-performance computational fluid dynamics tool which delivers robust and accurate solutions for a wide-ranging multi-physics and CFD applications. This tool is recommended because of its exceptional robustness, computational speed and accuracy [57-59].
Model GenerationOnce the blade and the overall shape dimensions of the Small Scale Wind Turbine (SSWT) fixed, the blade geometry and the turbine body have been generated using Ansys/Design Modeller feature [58] to draw the 3D geometry of the SSWT, similar to that carried out in [57]. This has been carryout by means of labelling particular critical parameters for instance: hub diameter = 50 mm, shroud diameter = 9 mm, blade width of 50 mm and 20 mm, blade length of 500 mm and blade number equals 3. These design factors were proposed based on the preliminary design and the 3D calculations to have the required amount of power generated, whereas the complete model, Figure 4, was prepared via the Design Modeller feature, which is bring into being inside the ANSYS/Workbench. Here, it is important to mention that an external domain was also drawn, with a size that significantly chosen, to imitate the real boundary and atmospheric conditions.
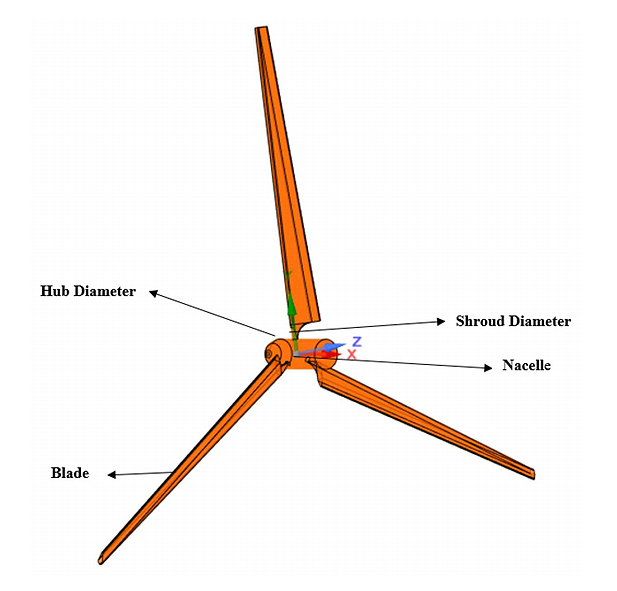 Figure 4. The 3D shape for the SSWT model.
By zooming Figure 4, Figure 5 shows the parameters studied in this paper.
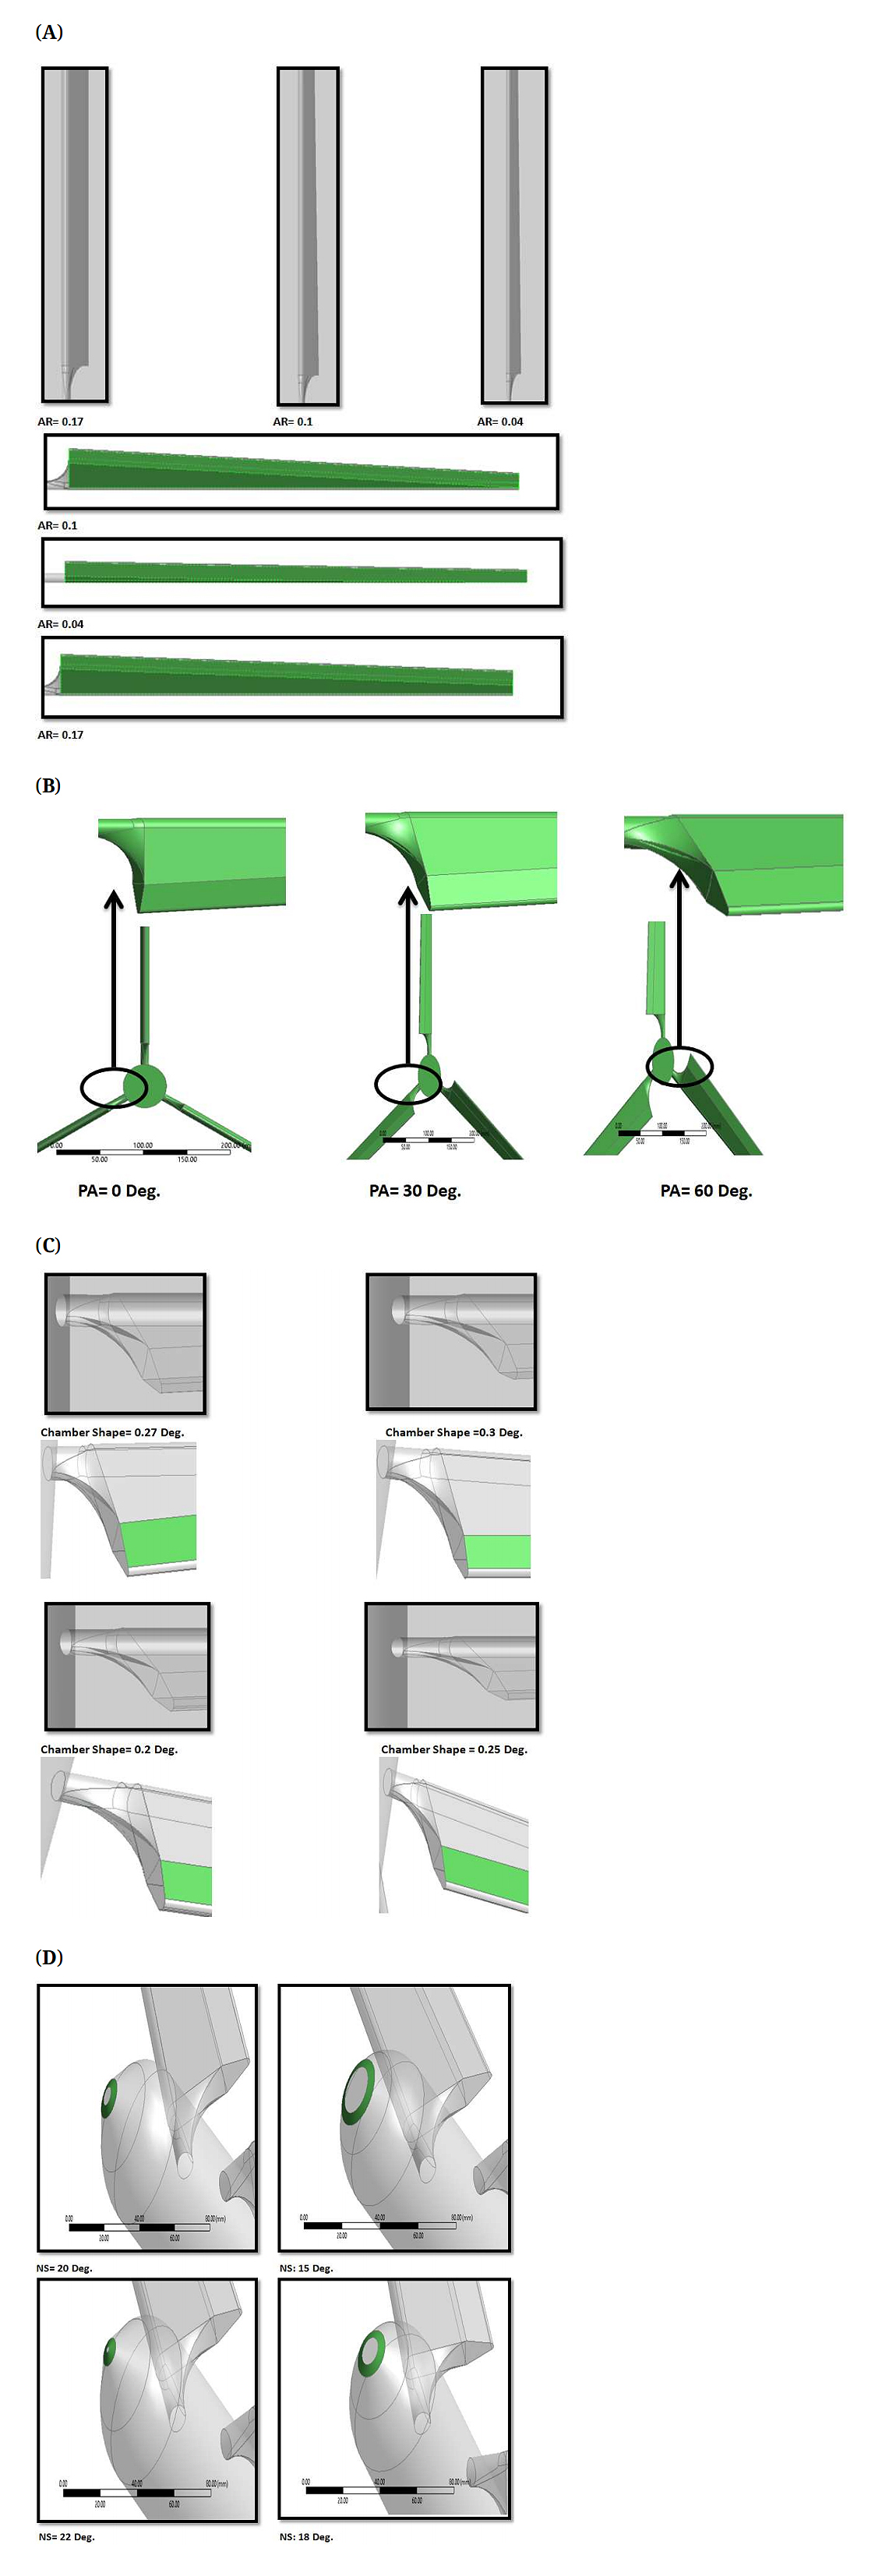 Figure 5. The investigated factors of the SSWT model using Design Modeller feature. (A) different blade Aspect Ratio (AR), (B) various blade Pitch Ratio (PR), (C) assorted Chamber Shape (CS) and (D) different Nacelle Shape (NS).
By completing the SSWT body, the all model i.e., the blade body, the hub, the shroud, the inlet and the outlet was then ready to be divided to elements through the 3D meshes. The structured 3D mesh utilized in the CFD analysis is presented in Figure 6 which characterizes the SSWT geometry model and the air domain passage.
To confirm the best element size for all geometry as well as the external domain, Figure 7, a discrete analysis for the grid sensitivity with respect to the turbine efficiency, Figure 8, was conducted to conclude an element number of 2652437 for the SSWT model.
At this point, it should be highlighted that all these steps are already a part of the CFD solver, which suggests a specific setup approach for turbomachines, to make the procedure of setting the models more effective [60,61].
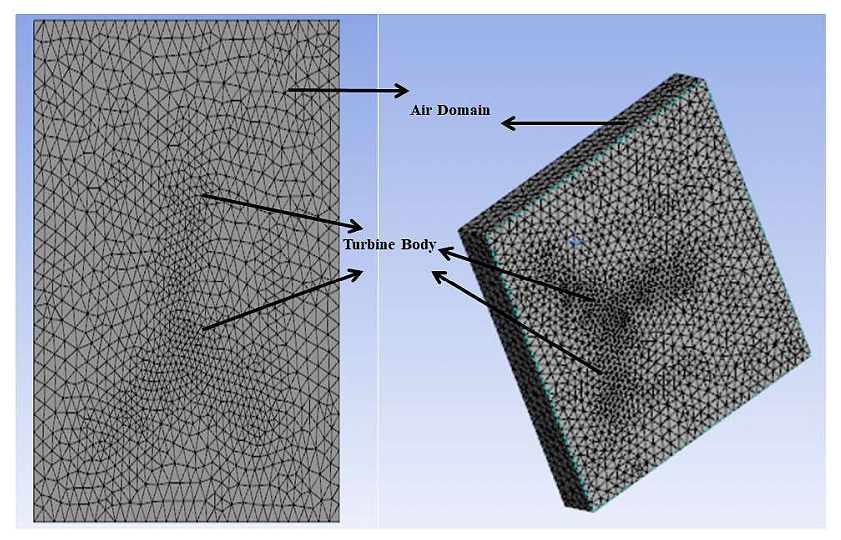 Figure 6. The 3D meshes for the SSWT model and its domain.
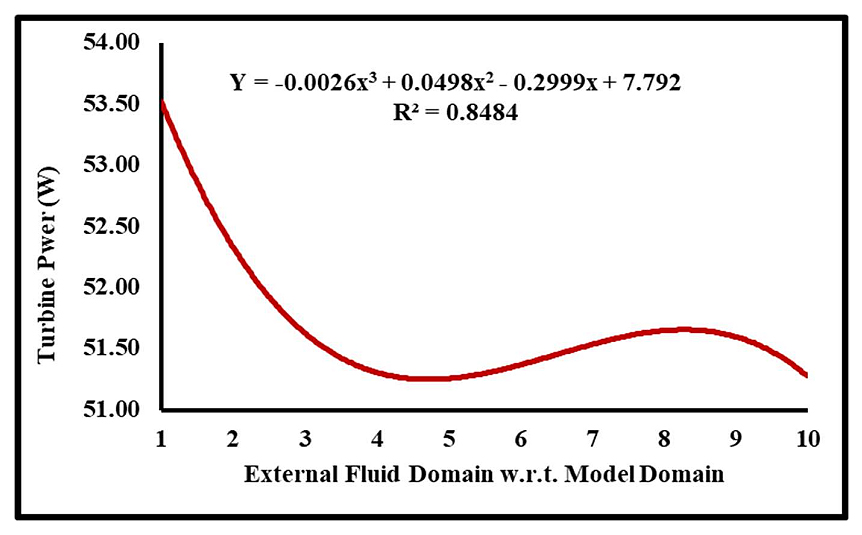 Figure 7. Domain size with respect to amount of power generated.
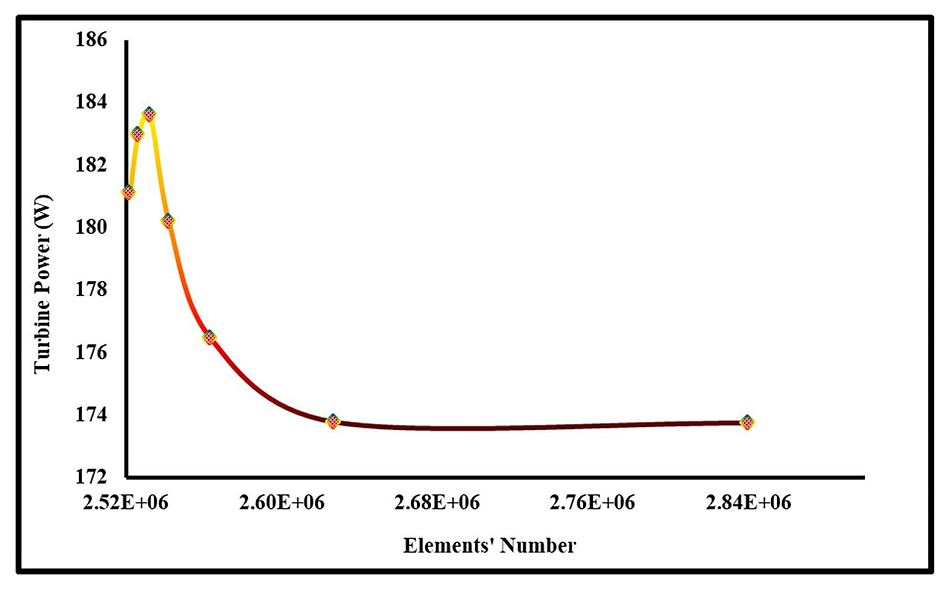 Figure 8. Mesh sensitivity with respect to the SSWT model's extracted power.
The next important step is the settings for the physical and thermodynamic properties, for instance specifying the working fluid type, interring the fluid state (transient or steady), as well as, and setting the model boundary conditions, inlet air velocity (3 m/s, 6 m/s, 10 m/s), need to be entered to the software as input data before solving the model.
Figure 7 shows both the SSWT body as well as the external air domain. As for the type of chosen solver, the SST k−ω turbulence model was chosen; it is a two-equation eddy viscosity turbulence model, which is recommended for flow with adverse pressure gradients. This setting has been utilized in the authors' previous published papers [62,63].
The model mentioned in Figure 9 is the new model, developed by Menter [62], which hybrids both the standard k−ω and the k−ε models (i.e., it utilizes the advantages of each of them and it is considered the most accurate and appropriate model choice for adverse pressure gradients). That led to the two equations, which can be found in the eddy viscosity SST k-ω model.
The K equation in the mentioned model is addressed, as shown in the following equation:

While the ω equation is:
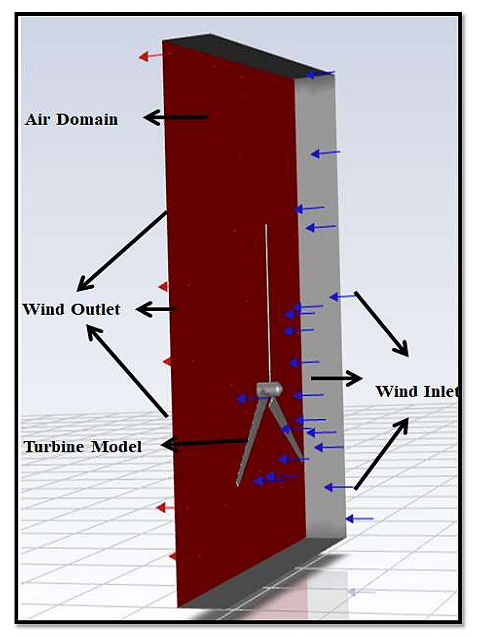 Figure 9. The three-dimensional shape for the SSWT model and its domain.
The following assumptions were assumed through the current modelling:
•
•
•
The pressures and the velocity contours of the studied model are presented in Figure 10 and Figure 11, respectively.
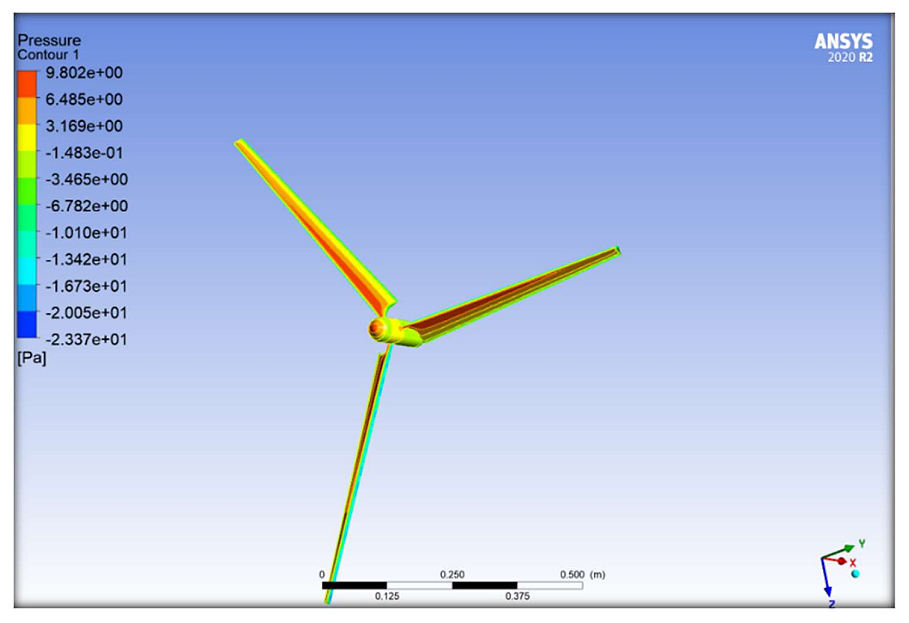 Figure 10. Pressure contour of the SSWT model.
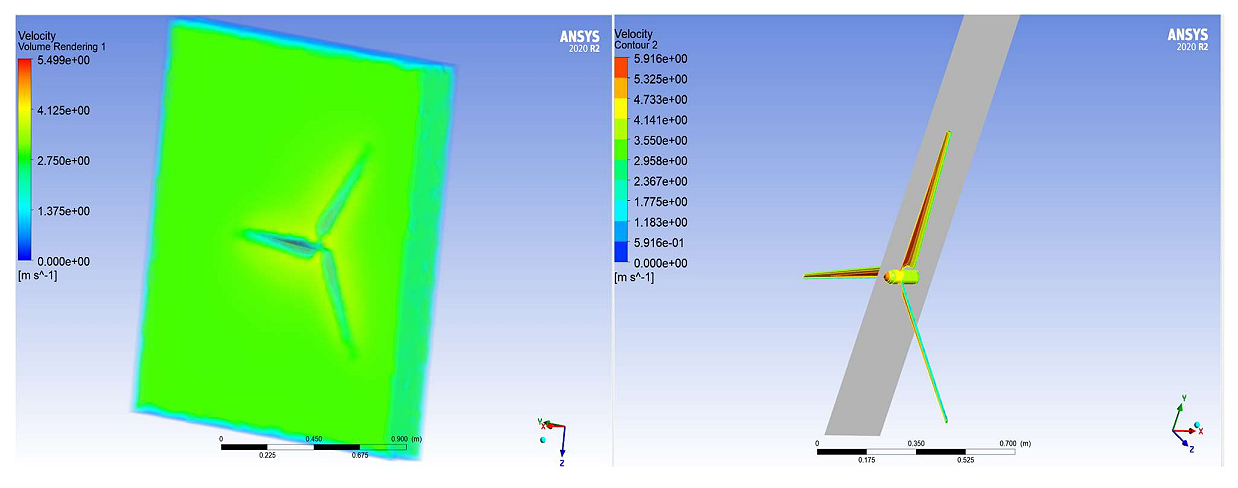 Figure 11. Velocity contour for the SSWT model.
With the aim of confirm the current research study, the existing results have been effectively matched with a similar model, which was assembled and evaluated experimentally in the researchers' laboratory [55]. At this instant, it is essential to emphasize that the mentioned study involved both, 3D modelling and analysis as well. Figure 12 shows the comparison results between that study and the present one with respect to the model achieved power. From this figure it can be concluded that a maximum difference i.e., around 9% was found between the two results at the same boundary conditions. This, in fact, confirms that the current obtained values have a particularly good agreement comparing to the experimental results of the cited work.
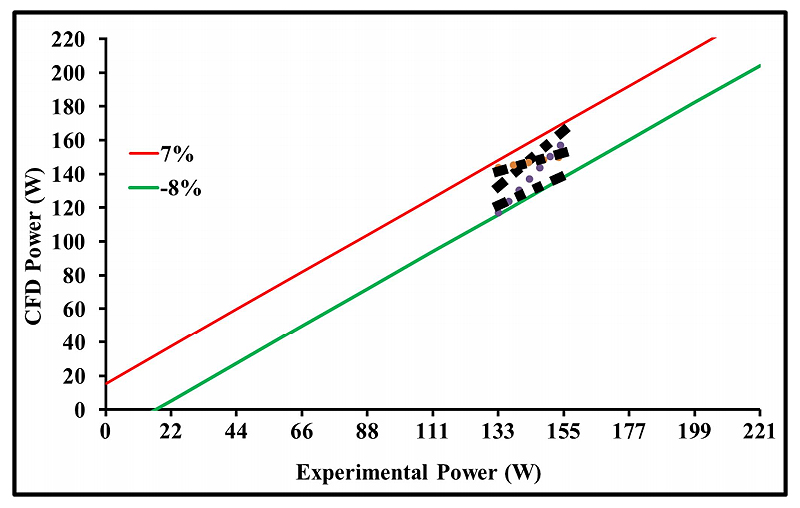 Figure 12. Comparison between the power achieved by the current work and that established in reference [63].
The CFD application becomes an important action to examine the small scale wind turbines' performance and runs handing-hand with their mean-line design and mathematical solutions because of the real flow field in turbines' being a strongly turbulent, 3D and viscous flow. So, the current section presents the 3D CFD analysis operated in calculating the aerodynamic wind turbine's performance by conducting 3D CFD analysis across the hub and rotor blade passage for SSWT configuration.
This section presents the results achieved during the current work and tries to significantly and accurately discuss them through contours which imported from the employed software. It also highlights the influences of the investigated parameters on the overall turbine performance through comparing them to the gotten power after assuming the turbine rotational speed to be 550 rpm.
The Effect of Aspect RatioThe effect of Aspect Ratio (AR) values, Figure 13 on the value of power generated by the wind turbine is consequently discussed in this section. Here it is important to highlight the fact that this comparison was conducted based on the same blade surface area vales to only to have more accurate results are that only influenced by the highlighted factor purely. Figure shows the effect of the AR at the three investigated values of wind velocity. As it clears from the figure, that the highest amount of achieved power was at an aspect ratio of around 0.0636 for the three investigated values of wind speed. Interestingly, the importance of the mentioned values was noticed to have more in influence at higher wind velocity compared with lower values. The maximum reached SSWT power was around 221 W at wind speed of 10 m/s compared to only 18.87 W at a wind speed of 3 m/s.
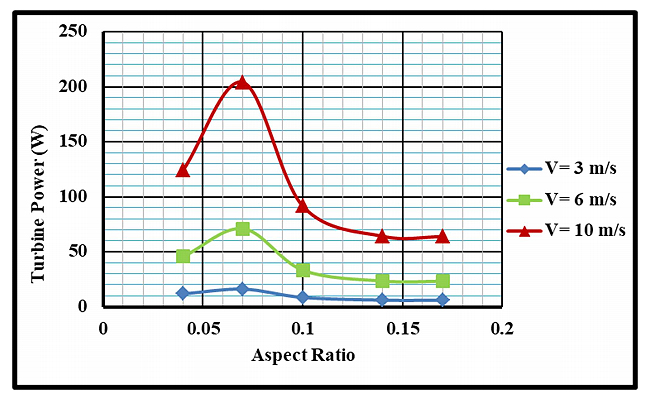 Figure 13. Achieved power vs. blade aspect ratio at various wind speed values.
The effect of Pitch Angle (PA) values, Figure 14 on the amount of power produced by the wind turbine is accordingly examined here in the current section. At this point it is essential to high spot that mentioned comparison was conducted based on the same blade surface area values to only to have more accurate results are that only influenced by the highlighted factor purely. Figure shows the effect of the PA at the three investigated values of wind velocity. The highest power was achieved at a pitch angle of 60 Degree for the three studied wind speed values. Excitingly, it is noticed that increasing this factor influences directly on the amount of reached power by the SSWT model. The maximum reached power was around 198.7 W at wind speed of 10 m/s compared to only 16.9 W at a wind speed of 3 m/s.
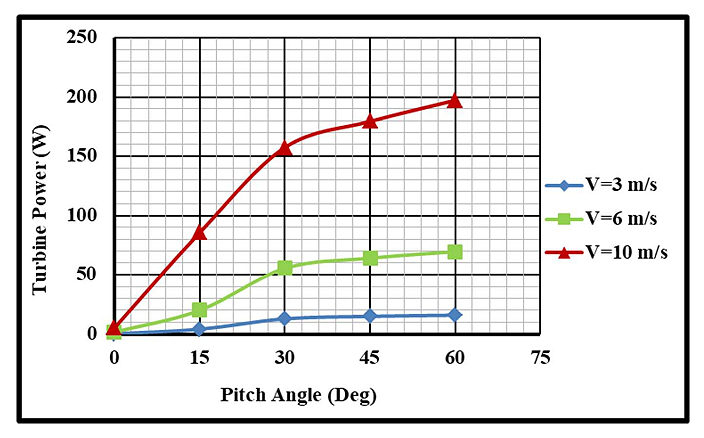 Figure 14. Achieved power vs. blade angle at various wind speed values.
The wind flow direction and the angle that the wind hit the turbine with is a significant factor that determines the amount of the received wind power by the turbine. Consequently, the wind turbine blade represented by the chamfer shape can play a vital factor in deciding that power. Based on that, the blade Chamfer Ratio (CR), Figure 15 was taken as factor to highlight the best value that leads to the maximum power value. The figure shows the effect of the CR at the three investigated values of wind velocity. The highest power was achieved at a pitch angle of 60 Degree for the three studied wind speed values. Excitingly, it is noticed that increasing this factor influences directly on the amount of reached power by the SSWT model. The maximum reached power was around 203.79 W at wind speed of 10 m/s compared to only 18.15 W at a wind speed of 3 m/s.
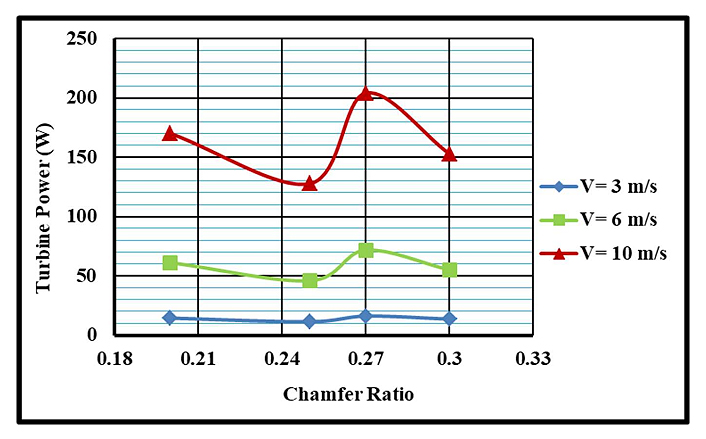 Figure 15. Achieved power vs. blade chamfer ratio at various wind speed values.
The new key factor that has been investigated in the current study was the Nacelle Shape (NS). This factor has an important influence on the air flow patterns and as a result on the amount as well as the angle that the flow hits each of the small scale wind turbine's blades. This will surely result in a change of the power value generated by the wind turbine. At this point, it should be mentioned that this comparison was held based on various nacelle's diameters' values while same other properties for all conditions for the model to have more accurate results are that only influenced by the highlighted factor purely. Figure 16 shows the effect of the NS at the three investigated values of wind speed. From the figure it can be noticed two significant points; the first one is the effect of the factor which became clear at higher angles, where the peak was at 20 Degree. The other crucial point is that the effect of increasing of the angle was clearer at higher wind speed value i.e., 10 m/s, which was presented in a secondary axis to highlight the mentioned note.
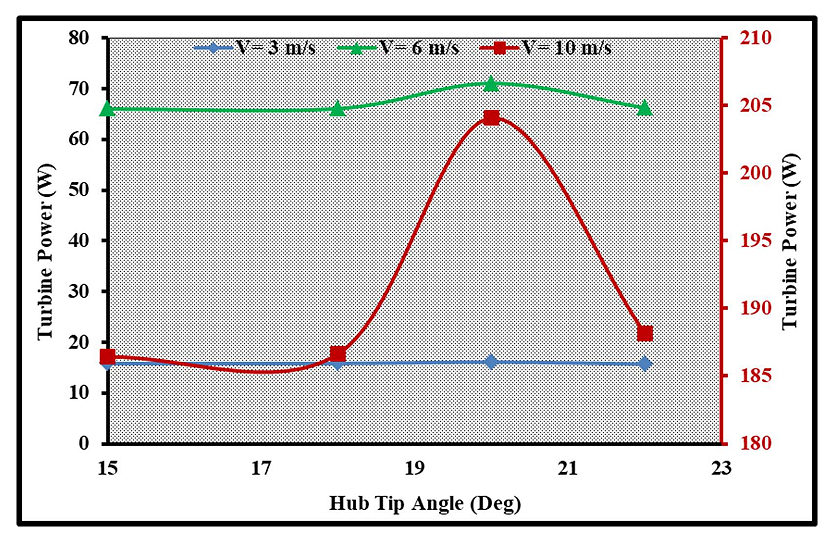 Figure 16. Achieved power vs. nacelle tip angle at various wind speed values.
This initiative aims to promote knowledge on the potential use of this kind of sustainable energy in Middle Eastern countries, particularly those in the developing world. The text emphasises the most crucial aspects as follows:
1.
2.
3.
4.
5.
It is worth noting that the data used in this research were the minimum wind speed observed throughout the year, chosen to err on the side of caution. It should be noted that in some months, a wind speed of 30 m/s was also recorded in the selected city.
This information might enhance awareness about the need of prioritising this crucial category of renewable energy sources.
The scale of the current work, which is 1-10 kW, and the effects of the structural analysis, such as the stress, strain, and fatigue analyses, were not included. This can be considered one of the main limits of the current work.
Future studies might highlight the influence of the investigated parameters instantaneously, in order to achieve more accurate results. Moreover, inserting the smart material technique is another important idea, which might be the authors' next work.
The dataset of the study is available from the authors upon reasonable request.
Ahmed Daabo and Shahad Ibrahim: writing—original draft, visualization, software, methodology, conceptualization. Ahmed Khalid: analyzed the data. Ali Alkhabbaz: investigation. Hudhaifa Hamzah: validation, methodology. Ali Basem and Haider Easa: resources. Ali Hassan: visualization.
The authors declare that there is no conflict of interest.
The authors thank the University of Mosul for the facilities provided for the present research study.
1.
2.
3.
4.
5.
6.
7.
8.
9.
10.
11.
12.
13.
14.
15.
16.
17.
18.
19.
20.
21.
22.
23.
24.
25.
26.
27.
28.
29.
30.
31.
32.
33.
34.
35.
36.
37.
38.
39.
40.
41.
42.
43.
44.
45.
46.
47.
48.
49.
50.
51.
52.
53.
54.
55.
56.
57.
58.
59.
60.
61.
62.
63.
Daabo AM, Ibrahim SS, Khalid A, Alkhabbaz A, Hamzah H, Basem A, et al. The Effect of Nacelle Shape and Blade Geometry on the Performance of Small Scale Wind Turbine. J Sustain Res. 2024;6(2):e240035. https://doi.org/10.20900/jsr20240035

Copyright © 2024 Hapres Co., Ltd. Privacy Policy | Terms and Conditions