Location: Home >> Detail
J Sustain Res. 2025;7(3):e250054. https://doi.org/10.20900/jsr20250054
 ,
Robert C. Rickards 2
,
Robert C. Rickards 2
1 Doctoral School of Regional and Economic Sciences, Széchenyi István University, Győr 9026, Hungary
2 Department of Business Administration—Public Management, German Police University, Muenster 48149, Germany
* Correspondence: Bence Lukács
Background: Development of objective, quantitative sustainability reporting scores for international companies has to be based on legal, regulatory, and public policy standards as well as focused exclusively on environmental, social, and governance (ESG) issues. The key performance indicators (KPIs) developed here differ from traditional agencies’ rating schemes in that they are equally applicable across industrial sectors. They measure performance in terms of several environmental Global Reporting Initiative (GRI) indicators. The KPIs quantify performance by systematically linking corporate revenues with sustainability metrics, thereby yielding readily comparable, numerical scores.
Methods: This report illustrates their utility with data on carbon dioxide (CO2) emissions from leading companies within the S&P Global ESG ranking for 2023.
Results: The findings reveal significant gaps in managing Scope 3 emissions, which dominate the value chain and present the greatest challenge for corporate sustainability. These disparities highlight the need for improved data transparency and harmonized reporting standards to ensure consistent and actionable sustainability assessments.
Conclusions: By bridging these gaps, the KPIs enable more equitable comparisons across industries and encourage better alignment of corporate strategies with global climate objectives. The additional transparency and insights in turn afford investors, managers, policy makers, and other stakeholders’ better information for their decision making.
ESG, environmental, social, and governance; KPI, key performance indicator; GRI, Global Reporting Initiative; CO2, carbon dioxide; TBL, triple-bottom line; SCC, social cost of carbon; GHG, greenhouse gas
The concept of sustainability has become a pivotal consideration for businesses, investors, and policymakers alike. Among other reasons, that is because corporate sustainability ratings assess an enterprise's ESG performance. Rating scores serve as the basis for relative rankings of various enterprises. They thereby directly affect an entity’s financial flexibility and market valuation as well as investor sentiment toward it. However, given that they use sector-specific metrics to evaluate companies, traditional ESG rating systems frequently are inconsistent, opaque, and lack comparability across both different industries and rating agencies [1]. Furthermore, the ratings and scores do not indicate in financial terms either the benefits a firm’s goods and services afford its customers or the costs to the environment of producing them.
This paper addresses those deficiencies by developing a consistent, transparent, and sector-independent set of corporate sustainability KPIs. These KPIs rely heavily on quantitative environmental data in examining the relationship between corporate revenues and the GRI’s widely recognized sustainability performance standards. A distinctive feature of the approach is its simultaneous assessment of both financial and sustainability indicators, which yields better insights into corporate performance. The study’s findings demonstrate that the KPIs are useful for dealing with a considerable challenge confronting many businesses: identifying inconsistencies in corporate sustainability, especially with respect to CO2 emissions. Accordingly, they make a significant contribution to the corporate sustainability literature.
The main objective of this research is to create sector-agnostic KPIs that link corporate revenues clearly with sustainability metrics, thus enabling consistent cross-sector comparability. The KPIs will provide businesses with practical insights for improving environmental efficiency and aligning operations with sustainability objectives. For investors, they will provide a clear framework against which corporate performance can be weighed up against financial outcomes, thereby facilitating informed decision-making and accountability in sustainability practices.
The next section briefly reviews the literature on corporate sustainability rating systems. Following it is a description of the abovementioned environmental indicators and financial variables employed in developing the KPIs. Thereafter, the KPIs are applied to a sample of top-rated companies, the results presented, and then subsequently discussed. The final section summarizes implications of the findings and suggests avenues for further research.
Literature ReviewAccurately assessing their sustainable performance is a significant challenge confronting most businesses [2]. Doing so involves implementation of integrated systems of indicators and metrics [3]. A variety of methodologies for assessing sustainability performance are available [4,5] including ones based on customer feedback, financial data, internal processes, and growth and learning aspects [3]. Moreover, incorporating additional nonfinancial KPIs on environmental and social activities into assessments has become standard practice [6].
Consequently, ESG ratings have emerged as an important tool for evaluating corporate sustainability performance. They provide an overall assessment of a company's behavior in relation to ESG parameters, encompassing such aspects as financial resilience, equity/liquidity risk, and market performance [7]. A superior ESG rating indicates greater financial flexibility and enhanced shareholder value, while also signaling lower equity and liquidity risks [8]. From a financial perspective, companies with a high rating consequently stand to benefit from a reduction in the costs of capital and debt [9]. In addition, ESG ratings serve as predictors of financial performance when considered in the context of environmentally responsible stewardship and social corporate responsibility [10]. So, such ratings have implications for both investors and enterprises. For investors, they exert a significant influence on market sentiment and trading volume [11]. For firms, ESG ratings assist in the management of stakeholder value maximization and minimization of the associated risks as well as demonstrating the sustainability of their business models. Among other exposures, ESG ratings facilitate the mitigation of systemic, credit, legal, and downside risks [12]. Companies with higher ESG ratings also may enjoy more credibility with market participants thanks to their nonfinancial reporting.
Third-party audits of sustainability reports bolster confidence in the disclosed information, which attracts socially responsible investors and positively influences their preferences [13,14]. That being the case, ESG ratings ought to be of the highest quality and transparent in their methodology. In practice, though, great discrepancies are apparent in the ratings issued by different agencies [15]. Their diverging scores result from “varied definitions of ESG constructs, differences in ESG performance assessment methodology, and the absence of transparency in the rating process” [16]. Failure to measure the costs and benefits of a firm’s activities in monetary terms contributes further to the opacity of audited reports.
Consequently, one team of investigators has suggested a new set of balanced KPIs based on the triple bottom line (TBL) framework, which evaluates sustainability across supply chains by integrating social, environmental, and economic performance dimensions [17]. The set provides comprehensive coverage of the sustainability pillars and has been shown to be effective in several supply chains. Integrating sustainability dimensions into corporate strategy with a set of suitable KPIs enables firms to achieve strategic alignment and, subsequently, competitive advantage [18,19]. Adoption of appropriate KPIs thus not only enables proper measurement of sustainability performance but also provides long-term value creation for an organization by aligning its strategies with sustainability goals [20].
A second research group has conducted a bibliometric analysis to examine the relationship between digital technologies and corporate sustainability by reviewing 1251 publications from 1995 to 2024. It flags key technologies such as blockchain, artificial intelligence, big data, and fintech as the most important contributors to the improvement of sustainability goals. The study’s results provide a foundation for policymakers and practitioners to harness digital technologies in a way that can respond effectively to environmental and social challenges [21].
A third group of collaborators has examined the integration of climate-related disclosures in the automotive sector within the existing IFRS taxonomy, focusing on the potential impact of the ISSB's IFRS S2 Climate-related Disclosures proposal [22]. They say that the current reporting prototypes primarily affect the Notes sections of financial statements, emphasizing the lack of detailed emissions data beyond compliance declarations for final products. Their findings highlight the need for mandatory disclosure criteria and enhanced harmonization between sustainability and financial reporting standards to improve transparency and provide stakeholders with more actionable information.
In this regard, a fourth research team has explored the relationship between corporate investments and their environmental impact in the European vehicle manufacturing industry, focusing on Scope 1, 2, and 3 emissions [23]. Digital reporting through XBRL allows the analysis to demonstrate that tangible and intangible investments significantly influence Scope 1 emissions, while Scope 2 and 3 are dependent on systemic and exterior determinants. These findings underline the importance of transparent reporting and strong disclosure standards for better alignment of corporate investment strategies with sustainability goals and improved comparability across companies.
Carbon dioxide emissions represent a pivotal consideration in the context of corporate sustainability and most rating schemes. Several studies have emphasized the importance of incorporating CO2 costs into decision-making processes to facilitate a low-carbon transition and offset the adverse effects of such emissions. Such macroeconomic considerations regarding CO2 emissions underscore the necessity for sustainable energy production to yield a beneficial impact on the environment. Discussions on policy measures relative to CO2 emissions also encompass debate on the relative effectiveness of quantitative measures, such as cap-and-trade systems, and price measures that include carbon taxes [24].
Recent advances in climate finance have moved progressively toward forward-looking and market-based measures of companies' exposure to climate transition risk. The conventional backward-looking metrics, including carbon intensity and emissions, have been faulted for their inability to forecast outcomes and for their lack of standardization [25]. Thus, new financial products as well as empirical models have been developed to enhance the measurement of firms' exposure to climate-related risks.
A recently proposed framework describes a novel financial measure that captures the exposure of an enterprise to climate risks, particularly carbon-based risks. This metric is the “carbon beta.” It assesses the sensitivity of an enterprise’s stock returns relative to the returns on a low-carbon portfolio. A rise in carbon beta means that the firm is more sensitive to decarbonization movements in the market. That is because its value will decrease when investors demand lower-carbon assets or when carbon risk premiums lead to higher prices. Carbon beta therefore is a valuable measure for investors wishing to capture the financial impact of a company’s carbon intensity and responsiveness to the transition to a low-carbon economy [26].
A related study has shown that retail investors react to unusually warm local temperatures by searching for information about 'global warming' and selling carbon-intensive stocks. This behavior indicates that investors update their beliefs and that weather shocks can drive pricing effects [27,28]. Carbon beta similarly is associated closely with emission-intensive-industry in the form of green innovation proxies, like energy consumption [29]. Pertinent findings agree with equilibrium models showing that climatic issues redirect consumers' and investors' appetites from brown to green assets [30,31]. Thus, the research literature has begun to gravitate toward employing market-based metrics like carbon beta as a multi-purpose tool, not just for asset pricing, but also for ESG portfolio construction, policy analysis, and climate hedge strategy development [32].
Hence, it is crucial to be aware of the long-term consequences different policy approaches may have in effectively reducing CO2 emissions, including their social costs. For that reason, policy instruments such as carbon taxes and emission trading schemes have been the subject of much research. These instruments are designed to facilitate the management of CO2 emissions and the internalization of their social costs [33].
If in a market economy annual sales revenue represents the benefit products yield customers and the size of a company’s carbon footprint is known, one then can use the SCC or carbon taxes to analyze the cost-benefit relationships involved. Proceeding in this fashion establishes a basis for transparent, meaningful intercompany comparisons. It also facilitates intracompany analysis of the emissions’ origins, whether they be direct, result from internal consumption of external purchases, or arise from up- or downstream activities. Accordingly, the two research questions posed here are:
(1)
(2)
One can combine these two research questions in the following testable null hypothesis:
H: The environmental costs of a company’s CO2 emissions are lower than the benefits of the goods and services it produces.
The methodological approach developed in this study is grounded in, and directly extends, several strands of the prior literature that emphasize the need for transparent, comparable, and monetized measures of sustainability performance. Building on frameworks such as the TBL and the GRI’s environmental indicators, our method operationalizes the theoretical proposition that sustainability assessment should integrate both environmental impact and economic value in a sector-neutral fashion [17,26]. Prior research has underscored the shortcomings of traditional ESG ratings due to inconsistent definitions, lack of comparability, and limited disclosure of methodological assumptions [15]. To address these deficiencies, we adopt revenue-normalized CO2 emissions as a performance indicator, thereby enabling inter-firm and inter-sector comparisons grounded in widely accepted reporting standards. This approach also aligns with recent literature advocating monetization of carbon impacts through social cost benchmarks and carbon pricing mechanisms, which provide an economic interpretation of environmental externalities [24,33]. Consequently, the methodology is not only consistent with established sustainability theories but also responds to documented gaps in the field by offering a transparent, replicable, and financially relevant measurement framework.
The approach presented here differs from the methodology employed by ESG raters. It starts with seven accounting items from the GRI’s environmental Pillar E. As evident in Table 1, three of those items reflect the high priority placed on CO2 emissions. Yet, none of the accounting items is specific to a given industry. That means the KPIs developed from them are sector-agnostic and thus generally applicable.
Consequently, the KPI set in this study has the GRI Standards as its basis and is guided by principles set out in the EU Taxonomy for environmentally sustainable activities. The indicators selected—Scope 1 (GRI 305-1), Scope 2 (GRI 305-2), and Scope 3 (GRI 305-3) GHG emissions—were chosen because of their widespread adoption, standardization potential, and relevance for climate footprint calculation. All KPIs were calculated by dividing reported CO2-equivalent emissions by a financial performance metric, specifically annual sales revenue, to render them comparable across firms of different sizes and industries.
To ascertain whether firms are operating within sustainable boundaries, these revenue-normalized emission numbers are juxtaposed against two benchmarks, the Social Cost of Carbon (SCC) and the European Union Emissions Trading System’s (EU ETS) average carbon price. These thresholds form the basis of a comparison between economic benefit (revenue per ton of CO2 produced) and social cost, thereby determining a binary performance outcome. The monetization of sustainability performance ensures that it is not only an operational measure, but also an economically relevant signal linking environmental disclosures and financial materiality.
In Table 1. the GRI 302-1, 303-3, 303-5, 306-3 are the main environmental accounting items of the ESG framework of the Global Reporting Initiative, in addition to GRI 305-1, 305-2, 305-3, which are the Scope 1-2-3 emissions accounting items.
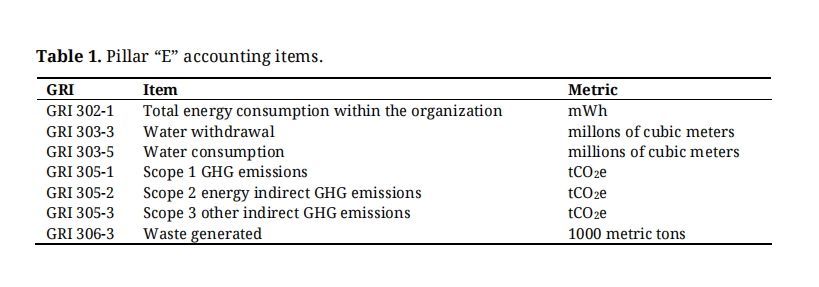 Table 1. Pillar “E” accounting items.
Development of the KPIs involved collecting data on the accounting items and annual sales revenue (turnover) for the companies studied from their annual financial and ESG reports. The selection criteria for the companies included in this research were designed to ensure a consistent yet diverse sample. Firms were selected from the top 1% of enterprises in the S&P Global ESG rankings for 2023. The focus was on those enterprises with complete, publicly available data on Scope 1, 2, and 3 GHG emissions, annual sales revenue, and environmental performance indicators, as defined by the GRI framework. Due to missing data, the subsequent analysis excluded the four other accounting items in Table 1.
The environmental and financial data used to create the KPIs were taken primarily from publicly available company reports and assurance verified ESG databases. These included annual sustainability reports, integrated financial reports, and separate ESG disclosures published by the companies themselves. Where these disclosures were available, the ones in the GRI or EU Taxonomy compliant formats were prioritized to ensure methodological consistency. Scope 1, 2, and 3 GHG emission data, as well as annual sales revenue, were gathered by hand from these sources. To minimize bias and enhance comparability, only firms with reported (rather than estimated) data for all three scopes of emissions were taken into the core analysis.
One of the primary limitations of this study stems from the absence of standardization in reporting Scope 3 emissions. The study focuses on Scope 1, 2, and 3 GHG emissions from the GRI’s environmental pillar, providing a comprehensive assessment of corporate carbon footprints across diverse industries. These emissions are critical for understanding direct, energy-related, and value-chain impacts, making them central to global climate change efforts and aligned with frameworks like the Paris Agreement and the EU Emission Trading System.
Unlike Scope 1 and 2 emissions, which typically are grounded in internal metering and energy purchase statistics, Scope 3 emissions often are missing or incomplete. Organizations differ widely in what they include under Scope 3, with some reporting only upstream supplier emissions. Such methodological disparities introduce a risk of underreporting or overgeneralization, affecting the validity and comparability of Scope 3-related KPIs. In the absence of globally mandated disclosure standards, these inconsistencies limit the interpretability of cross-company and cross-industry comparisons. Therefore, results for Scope 3 emissions should be interpreted cautiously. Additionally, the inconsistencies underscore the need for aligned, assurance-ready Scope 3 disclosures in evolving regulatory frameworks such as the CSRD and ISSB. Nevertheless, focusing on overall carbon emissions establishes a consistent approach and lends the research results global relevancy. Those results will reveal critical gaps in corporate sustainability practices, particularly with regard to all three Scope emissions in the value chain.
Scope 1, 2, and 3 items are particularly important from a sustainability perspective due to their relevance in measuring CO2 emissions. Scope 1 covers direct GHG emissions originating from sources that are owned or controlled by the entity. It includes, for instance, fuel combustion in company-owned vehicles or facilities. Scope 2 encompasses GHG emissions produced by the generation of purchased electricity, steam, heating, or cooling consumed by the enterprise. Scope 3 comprises all other indirect emissions occurring within the company’s value chain. They consist of both up- and downstream activities, such as transportation, waste disposal, and emissions generated from production of purchased goods and services.
Carbon emissions have a long-term, irreversible impact on the earth’s climate [34]. Among other effects, this impact involves both higher sea levels and significant reductions in precipitation during dry seasons. Elevated CO2 levels also cause more frequent and intense extreme weather events, for example tropical cyclones [35] regardless of global temperature increases [36,37]. Hence, temperature goals aimed at limiting global warming constitute an inadequate response to an urgent situation. So, the international community needs to take vigorous action to limit CO2 emissions.
Next, using the businesses’ data, the ratios below of emissions per dollar of annual sales revenue were calculated. These ratios allow for meaningful sustainability and financial comparisons across enterprises.
(1)
(2)
(3)
Inverting the ratios, in turn, yields measures of economic efficiency. They show the amount of sales revenue that a company generates per ton of CO2 emitted in the year under consideration.
(4)
(5)
(6)
The economic costs involved then were monetized using: (1) the SCC; and (2) the European Union's average annual carbon price. The SCC emissions is the overall financial burden that a specific action places on society. It consists of both private and external costs, such as costs to the environment or public health. The estimated social cost per kg of CO2 emissions in US dollars ranges from $0.041–$0.146 [38], to $0.051 [39], and $0.185 [40]. On the other hand, the European Union's average annual carbon price was $0.089 in 2022 and $0.094 in 2023 [41]. Placing the monetized costs in relationship to the amount of sales revenue earned in connection with the respective GHG emissions yields ratios indicating economic efficiency in terms of costs incurred relative to the value of the benefits received. Only ratios with values below 1.0 indicate net benefits to society. That is:
(7)
(8)
(9)
(10)
(11)
(12)
Table 2 lists the companies examined together with their annual sales revenue, ESG rating and E pillar score. According to S&P, these enterprises’ ratings put their ESG performance in the top 1% globally in 2023 [42]. The sample encompasses 31 of 67 businesses in that 1%, chosen purposively to vary widely by industry, location, and data availability on Pillar E items.
Table 3 displays descriptive statistics on the most recently available emissions data collected from the enterprises’ annual and/or ESG reports. It is noteworthy that for each GHG Scope category, the standard deviation is larger than the mean. That suggests skewed distributions. Given that the medians, in turn, are smaller than the corresponding means, a minority of businesses must be responsible for most of the reported emissions. The range on the examined parameters is wide. The firms (and their industries) with the lowest and highest Scope 1 discharges are: Home Product Center Public Company Limited (retailing) 215 tCO2 and The Siam Cement Public Company Limited (construction materials) 24,329,050 tCO2, respectively. Comparable information for Scopes 2 and 3 is: Indra Sistemas S.A. (IT services) 6583 tCO2 and The Siam Cement Public Company Limited (construction materials) 2,754,817 tCO2; Home Product Center Public Company Limited (retailing) 23,798 tCO2 and Hyundai Motor Company (automobiles) 105,790,785 tCO2.
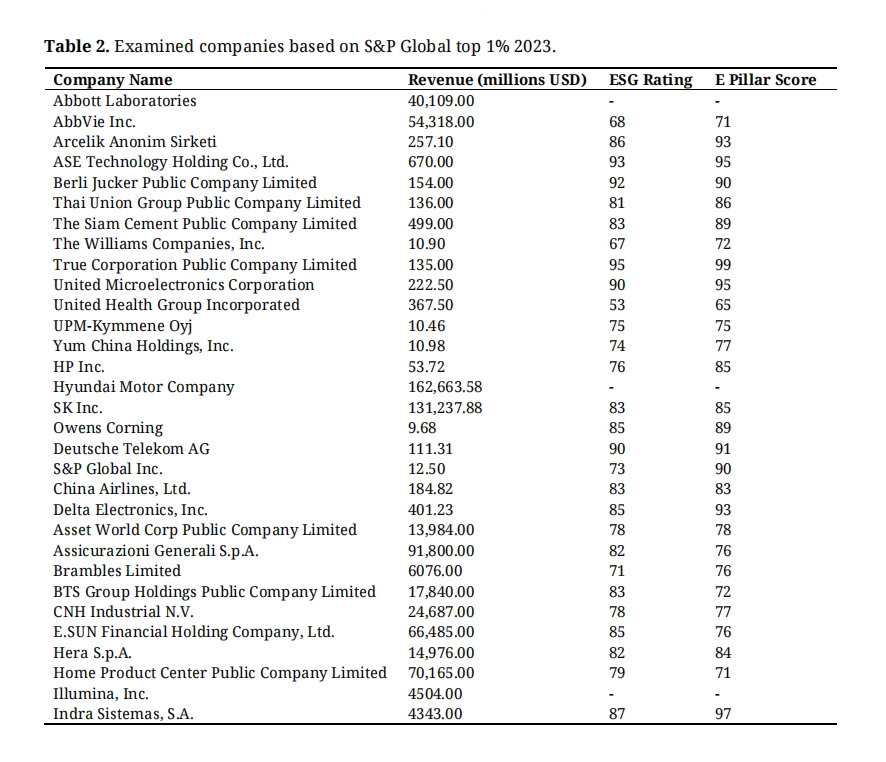 Table 2. Examined companies based on S&P Global top 1% 2023.
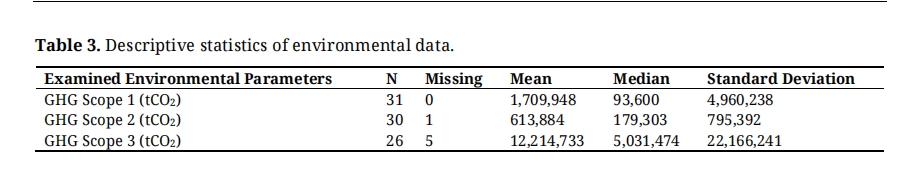 Table 3. Descriptive statistics of environmental data.
Tables 4 and 5 present descriptive statistics on the amount of CO2 emissions per $1000 of sales revenue for the companies under study and the amount of sales revenue per kg of CO2 discharged. Again, in both tables, the standard deviations are larger than the means, while the means are larger than the medians. Hence, in Table 4 a minority of the best-in-class firms are emitting more CO2 relative to sales revenue than are their peers. It also is apparent that Scope 3 (up- and downstream value chain) emissions are much larger than Scope 1 and 2 discharges.
Again, values for the examined parameters vary greatly. The firms (and their industries) with the lowest and highest ratios for Scope 1 releases are: SK Inc. (industrial conglomerate) 0.000024 tCO2/k$ and The Siam Cement Public Company Limited (construction materials) 1.7133 tCO2/k$, respectively. Equivalent data for Scopes 2 and 3 are: Deutsche Telekom AG (telecommunication services) 0.000148 tCO2/k$ and Asset World Corp. Public Company Limited (hotels, resorts, and cruise lines) 0.2489 tCO2/k$; Assicurazioni Generali S.p.A (insurance) 0.000433 tCO2/k$ and HP Inc. (computers, peripherals, and office electronics) 6.98 tCO2/k$.
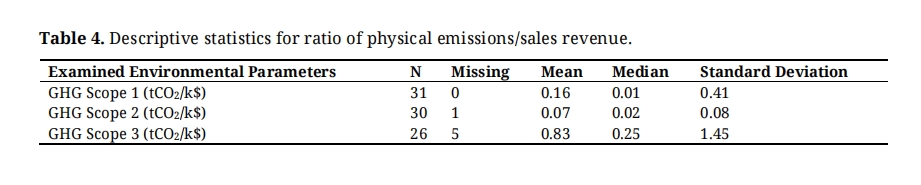 Table 4. Descriptive statistics for ratio of physical emissions/sales revenue.
In Table 5, the low median values indicate that most firms earn only small amounts of revenue per kgCO2 emitted. Nevertheless, the large standard deviations in the cases of Scope 1 and Scope 2 point to at least a few corporations with exceptionally high revenues relative to their discharges. The very low values in the instance of Scope 3 reflect the fact that up- and downstream value chains lie mostly outside ownership of the businesses under investigation.
Once more, the numbers for the environmental parameters differ markedly. The firms (and their industries) with the lowest and highest figures linked to Scope 1 emissions are: The Siam Cement Public Company Limited (construction materials) 0.000584 $/kgCO2 and SK Inc. (industrial conglomerate) 41.03 $/kgCO2. the corresponding details for Scopes 2 and 3 are: Asset World Corp Public Company Limited (hotels, resorts, and cruise lines) 0.0040167 $/kgCO2 and Deutsche Telekom AG (telecommunication services) 6.75 $/kgCO2; HP Inc. (computers, peripherals, and office electronics) 0.0001431 $/kgCO2 and Assicurazioni Generali S.p.A (insurance) 2.31 $/kgCO2.
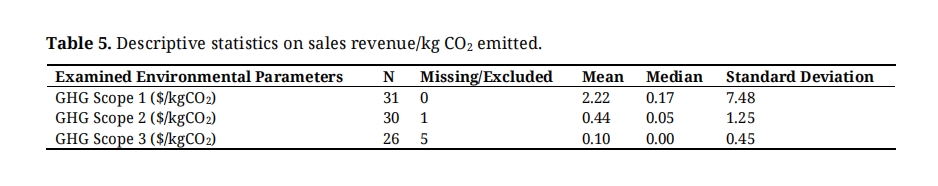 Table 5. Descriptive statistics on sales revenue/kg CO2 emitted.
Table 6 shows the number of companies for which the calculated $/kgCO2 values exceed various estimates of the SCC. For example, in the case of Scope 1, 22 of the 31 enterprises sampled had a better revenue per kgCO2 ratio than the SCC when the latter is in the range $0.041–0.051 per kg. The other 9 corporations, though, earn less revenue per kgCO2 than their SCC. So, these latter businesses are underperforming from a sustainability perspective. For a higher estimated SCC in the range of $0.146–0.185/kg, there are correspondingly fewer firms (18 and 14, respectively) whose revenues per kg of CO2 emitted surpass the social cost of such releases. For Scope 2 emissions, markedly fewer businesses clear the SCC bar, while the SCC standard for Scope 3 discharges proves too high for almost all the examined companies to attain. To summarize, about two-thirds of the best-in-class enterprises meet the sustainability criteria with regard to their direct emissions and about one-half do likewise with their external energy purchases. Yet scarcely any of their up- and/or downstream value chain emissions are within acceptable boundaries.
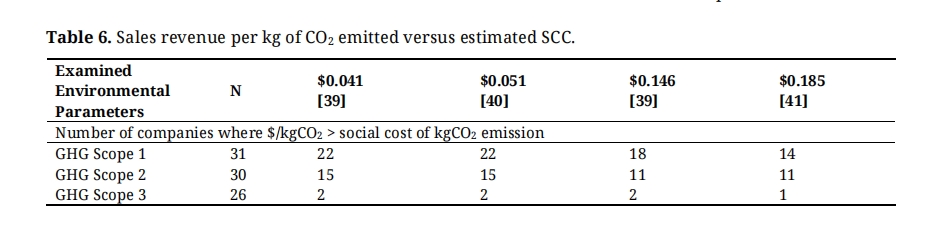 Table 6. Sales revenue per kg of CO2 emitted versus estimated SCC.
Table 7 compares the entities’ sales revenue per kg of CO2 emitted with the European Union Emission Trading System’s average annual carbon price in 2022 and 2023 [41]. A pattern similar to the one in Table 6 is apparent. A little fewer than two-thirds of the subject businesses meet the standard for Scope 1, roughly half do so for Scope 2, and all but one fail to meet the benchmark on Scope 3.
The findings have several actionable implications. For companies, they highlight the importance of improving operational and supply chain efficiency in order to keep pace with evolving carbon pricing mechanisms. The results also remind policymakers to focus on incentive designs and regulations that actually will reduce emissions across all scopes, especially Scope 3. Furthermore, they call attention to the need for uniform reporting standards that would enhance the consistency and reliability of emissions data—one of the key building blocks essential for business strategy formulation and regulatory compliance. Implementing such measures would bring enterprises closer toward meeting sustainability goals in a financially feasible way.
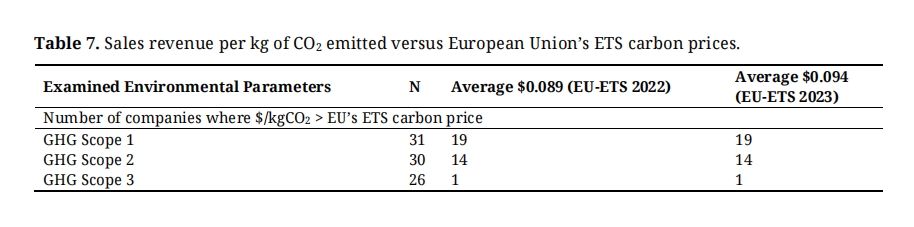 Table 7. Sales revenue per kg of CO2 emitted versus European Union’s ETS carbon prices.
The data show that there is a lot of variation in how well companies are doing with respect to the environment. This diversity suggests that some companies affect the environment much more than other firms do. For instance, construction materials and the automotive industry have relatively high Scope 1 and Scope 3 emissions, indicating the energy intensity of their operations and difficulty in mitigating up- and downstream emissions. On the other hand, sectors like telecommunications and financial services have relatively low emissions, probably because their activities are less carbon intensive. These differences underscore the need for sectoral strategies in sustainability reporting and mitigation.
The research presented here differs markedly from most prior investigations into corporate sustainability. Many of those efforts have focused on absolute and relative enterprise ESG scores and their possible association with investment risk reduction, heightened profitability, and/or better stock market performance. As noted in the literature review, the lack of common definitions, comparability, and transparency issues have decreased the utility of ratings and given rise to a need for benchmarks. A rater’s overall view of a firm seems to influence measurements in specific ratings categories too [15]. Geography may be an additional factor because ratings discrepancies may be lower in Europe than in other regions such as China [43]. Deconstruction of overall scores into granular components, together with a best-in-class approach to benchmarking, promises to be a more fruitful way to analyze ESG data [44].
The current research has disaggregated the GRI’s Pillar E into its basic components and monetized them. That facilitated development of sector-agnostic KPIs relating CO2 costs incurred to benefits produced by the operations of a wide range of companies ranked in the top 1% of the S&P Global ESG Ratings for 2023. Application of those KPIs to the corporations’ reported information yields an unsettling picture of many best-in-class rated enterprises damaging the environment more than benefiting their customers.
This disturbing picture is consistent with the growing body of literature on the economic consequences of carbon emissions, which therefore advocates inclusion of the SCC in corporate sustainability assessments [38,45]. By considering the revenues generated per unit of CO2 in relation to a range of SCC benchmarks, this approach provides a clearer, more readily comprehensible measure of an enterprise's economic efficiency and environmental impact than traditional rating schemes do. Thus, the approach taken here captures the current state of market dynamics, while simultaneously providing a forward-looking perspective on a firm’s long-term sustainability.
Of particular interest are the findings concerning Scope 3 emissions. Measuring and reporting all indirect emissions within a company's value chain are daunting tasks [46,47]. Enterprises must rely on data shared by their supply chain partners or third-party data (such as industry averages, statistics released by governments, or regulatory disclosures) to make estimates, which may be more or less complete and reliable. Improvements with regard to data completeness, reliability, standardization, and harmonization would be worthy goals not just for future research pertaining to Scope 3 releases. They also would mitigate some of the current uncertainties and risks associated with ESG ratings [16,40]. Investors then may find it easier to align their investment portfolios with sustainability objectives.
The KPIs developed in this study provide significant tools for corporate decision-makers by integrating sustainability metrics into strategic planning and regulatory compliance frameworks. For example, companies can use these metrics to pinpoint operational inefficiencies, prioritize investments in cleaner technologies, or benchmark performance against competitors. By linking emissions directly to revenue, the KPIs allow firms to evaluate the economic trade-offs of sustainability initiatives, enabling data-driven decisions on resource allocation. With such KPIs, policymakers might craft performance-based incentives, like tax credits for companies reaching threshold revenue-to-emissions ratios, or penalties for falling below the thresholds. The KPIs could form the basis of carbon pricing schemes—such as cap-and-trade systems-designed to tie financial performance more closely to environmental performance. It is in aligning corporate and policy objectives that such KPIs foster not just compliance but actual progress toward global carbon-reduction targets.
The proposed ESG KPI framework improves significantly on traditional ESG rating models by surmounting their inherent constraints through a methodical, transparent, and finance-integrated approach. In comparison with traditional models’ opaque processes, the new framework offers sector-neutral KPIs on the basis of GRI-based standard indicators that allow industrial peer comparisons on a common basis. It increases transparency because its calculation process utilizes disclosed Scope 1–3 emissions normalized by revenue. The valuation of environmental harm in terms of the SCC and EU carbon prices is an important innovation that converts qualitative ESG information into economically relevant indicators. Stakeholders can use this information to determine whether a company's economic production is worth its environmental cost. However, by including (the hitherto excluded or only occasionally reported) Scope 3 emissions, the model measures end-to-end value-chain effects too. Thereby, it reveals gaps in sustainability performance critical to the planet’s survival. By linking sustainability performance to economic efficiency in this fashion, its KPIs facilitate better investment decisions, benchmarking, and policymaking. The approach thus offers a pragmatic, outcome-oriented substitute for traditional ESG scores, environmental sustainability reporting, and financial decision-making.
The study has addressed two fundamental questions: first, whether the economic benefits derived from companies' goods and services exceed the environmental costs of their CO2 emissions; and second, what the main sources of these costs are. The findings indicate that for the majority of firms within the S&P Global ESG top 1%, revenue per kilogram of CO2 emissions from direct operations (Scope 1) and purchased energy consumption (Scope 2) frequently exceeds benchmark values such as the SCC and EU ETS prices. In contrast, Scope 3 emissions, which encompass indirect, value-chain-related discharges, almost always outstrip the SCC. In other words, these up- and downstream activities have the largest, and mostly unaddressed, adverse environmental impact. Accordingly, although certain enterprises demonstrate a net-positive environmental contribution for their core operations, the external portions of their value chains generate even larger, net-negative, carbon-related costs. This fact means one can reject H at least in part because the overall costs of the best-in-class businesses’ emissions surpass the value of their products’ benefits. The finding furthermore underscores the need for enhanced Scope 3 transparency and mitigation efforts.
This study’s results align with earlier findings that quantify the U.S. corporate sector’s carbon burden at 131% of total equity value. Those results note further that 77% of firms face carbon costs exceeding their market capitalization [48]. By linking company revenues to standardized CO2 performance indicators, the current study similarly reveals substantial misalignments between economic benefits and environmental costs, particularly due to unmanaged Scope 3 emissions. While the prior analysis monetizes carbon as a financial externality, the sector-agnostic KPI framework proposed here provides a complementary, scalable tool for evaluating the trade-off between revenues earned and environmental costs incurred across industries.
In the short term, subsequent studies might expand application of the KPIs developed here to the remaining 99% of entities covered by the S&P Global ESG Ratings. That would generalize the study’s results while possibly gaining new insights into specific industries. Special attention could be given to sectors with particular emission profiles, such as agriculture or renewable energy, or to companies operating in emerging markets where sustainability challenges may be substantially different. Efforts also ought to be channeled into refining methodologies for data collection and analysis, especially Scope 3 emissions, by improving estimation models and gaps in supply chain transparency to increase the reliability and applicability of the KPIs.
Long-term studies might focus on longitudinal research that would track changes in corporate sustainability performance as a function of dynamic regulatory and market pressures, while providing insights into long-term trends and the effects of policy intervention. Research into causality between ESG ratings and financial performance would help in highlighting how different rating methodologies affect investment decisions and corporate strategies. Adding social and governance components to the KPIs would allow for a more integrated approach to corporate sustainability. Furthermore, this model could be expanded to monetize the other GRI environmental metrics referred to previously but excluded from the present analysis. That would provide an avenue to build holistic, sector-agnostic KPIs with more substantial insight into the extended environmental and economic consequences of corporate performance.
Practical ImplicationsFirms can utilize the KPIs developed here as diagnostic tools to identify inefficiencies across their operational and value chain emissions. By monetizing their sustainability impacts, firms can perceive more clearly the cost-benefit trade-offs involved, spend more efficiently on cleaner technology, and select more sustainable suppliers. The KPI ratios also simplify benchmarking among industry peers, encouraging competition with regard to transparency and responsibility. Investors can use these KPIs to enhance ESG screening, going beyond opaque rating systems to quantify direct emission efficiency per dollar of value created. The monetized presentation (such as revenue per kg CO2 vs. SCC or carbon price) plainly identifies over- and underpricing of sustainability performance. Consequently, it facilitates climate risk analysis and thereby construction of environmentally friendly investment portfolios. Additionally, decision makers can use these KPIs to inform policy measures such as performance-based subsidies, tax credits, or carbon pricing systems. This set of KPIs also provides a foundation for mandatory sustainability disclosures on harmonized frameworks such as CSRD, ISSB, or EU taxonomy-based reporting.
This research represents a novel approach to corporate sustainability rating that is not sector-specific. Although currently focused exclusively on CO2 emissions, it nonetheless offers a better means for rating one aspect of sustainability performance across diverse companies and industries than traditional rating systems do. The results reveal that enterprises have varying degrees of success in integrating the reduction of greenhouse gases into their daily operations. While some businesses demonstrate exemplary performance relative to social cost and carbon pricing benchmarks, other firms exhibit less satisfactory outcomes. At any rate, nearly all the best-in-class corporations perform poorly with respect to GHG Scope 3 indirect emissions.
Among the strengths of the proposed approach is that one can utilize it to apply meaningfully a single KPI across industries confronted with various sustainability challenges. Doing so creates a basis for fair comparisons among companies across sectors, not on the physical scale of total emissions but on the grounds of monetary value per unit of environmental expense. This solution offers a scalable, transparent medium for cross-sector benchmarking and decision-making.
The present study has several limitations. First, reliance on self-reported ESG data is problematic because companies may differ materially in terms of the quality, granularity, and consistency of their disclosures. Such variability in disclosures can affect cross-industry and cross-regional data comparability and may have implications for the reliability of the results. Second, the present study deals with just three emissions-related measures, Scopes 1, 2, and 3. It does not consider other essential environmental indicators such as water usage, generated waste, or energy efficiency. The fact that KPIs do not reflect corporate sustainability performance holistically is an important shortcoming. Third, the sample selected includes only companies ranked in the top 1% of S&P Global ESG Ratings. Because they are best-in-class performers, they almost certainly do not reflect adequately the imbalance between the high costs of environmental damage arising from the relatively smaller benefits industry in general currently is producing.
The sector-agnostic KPIs developed and applied here nonetheless highlight some of the significant challenges associated with decarbonizing the world’s economy. They also will be useful to individuals seeking more sustainable investments. Furthermore, the KPIs will aid managers in evaluating their firm’s performance against that of its peers, recognizing areas for improvement, and setting more targeted, attainable goals for their sustainability efforts. Policymakers, too, will find the KPIs helpful in formulating incentives and regulations encouraging business sustainability across the board. Finally, the KPIs described above could inform the design of more transparent and readily comparable ESG reporting standards for bridging the gap between ESG ratings and actual sustainability outcomes.
The dataset of the study is available from the authors upon reasonable request.
Conceptualization, BL; Methodology, BL and RCR; Software, BL; Validation, BL, RCR; Formal Analysis, BL; Investigation, BL; Visualization, BL; Supervision, RCR.
The authors declare that there is no conflicts of interest.
1.
2.
3.
4.
5.
6.
7.
8.
9.
10.
11.
12.
13.
14.
15.
16.
17.
18.
19.
20.
21.
22.
23.
24.
25.
26.
27.
28.
29.
30.
31.
32.
33.
34.
35.
36.
37.
38.
39.
40.
41.
42.
43.
44.
45.
46.
47.
48.
Lukács B, Rickards RC. Developing a consistent and transparent corporate sustainability rating system with a sector-agnostic approach. J Sustain Res. 2025;7(3):e250054. https://doi.org/10.20900/jsr20250054.

Copyright © Hapres Co., Ltd. Privacy Policy | Terms and Conditions


