Location:Home >> Detail
Med One. 2018; 3: e180004. https://doi.org/10.20900/mo.20180004
 ,
Ozlem Balci Ekmekci2,
Hakan Ekmekci2,
Orkide Donma2
,
Ozlem Balci Ekmekci2,
Hakan Ekmekci2,
Orkide Donma2
1 Department of Paediatrics, Faculty of Medicine, Namik Kemal University, Tekirdag, Turkey
2 Department of Medical Biochemistry, Cerrahpasa Medical Faculty, Istanbul University, Istanbul, Turkey
*Corresponding Author: Prof. Dr. Mustafa Metin Donma.
Increased prevalence of obese children has been observed in developed and to a lesser degree in developing countries. Childhood obesity is important because it provides a basis for the development of chronic diseases in adulthood. As a result of the increased obesity prevalence, the number of children with metabolic syndrome (MetS) is also increased. The aim of this study is to evaluate markers that differ between morbid obese (MO) and MO + MetS children. A total of eighty prepubertal children, thirty with normal body mass index (NW), twentyfive MO and twenty five MO + MetS, were included into the study. Groups were constituted using age- and sex-dependent BMI percentile tables created by WHO. Anthropometric measurements were recorded. Body mass index values were calculated. Routine biochemical parameters were performed. Leptin, adiponectin, resistin, vaspin, chemerin, progranulin, tumor necrosis factor-α, interleukin-6, monocyte chemotactic protein, high sensitive C-reactive protein levels were determined by ELISA. Statistical analyses were performed using SPSS. Values of p < 0.05 were statistically significant. Chemerin, hsCRP, leptin and adiponectin levels were higher (p ≤ 0.01) in MO and lower (p ≤ 0.01) in MO + MetS groups than those of NW group, respectively. Progranulin was the only parameter showing severe statistical significance between all groups (p ≤ 0.001). Higher values for vaspin were obtained in children with MO + MetS than those of NW group (p ≤ 0.05). Upon evaluation of markers affecting obesity, progranulin was reported as the unique parameter, which differs between MO and MO + MetS children. The evaluation of this parameter will be more informative than the other diagnostic parameters of MetS.
In recent years, increased prevalence of overweight and obese children has been observed throughout the world. The number of morbid obese (MO) children is also being increased. Severely obese children are at high risk of suffering obesity-related comorbidities such as metabolic syndrome (MetS) characterized by central obesity, insulin resistance, dyslipidemia and hypertension. Obesity, as a metabolic and a low-grade inflammatory disease, is associated with altered adipokine secretion. Some adipokines may act as early markers for the persistence of obesity from childhood into adulthood [1-6].
Adipokines, cytokines and chemokines may be promising markers for the treatment of obesity and obesity-related diseases. Molecules such as leptin, adiponectin, resistin, tumor necrosis factor α (TNF-α), interleukin 6 (IL-6), high sensitive C-reactive protein (hs CRP), monocyte chemoattractant protein-1 (MCP-1) and vaspin may contribute to pathophysiology of obesity-related diseases. In addition to these parameters, new markers reported to affect obesity have been introduced [2, 7-9]. However, there are a great number of markers. They are closely interrelated. The same molecule may be secreted from more than one site. They may exert paracrine, autocrine and/or endocrine effect. All of these factors make obtaining unbiased results difficult.
The studies investigating the status of the parameters such as chemerin and progranulin on children is rare in comparison with those performed on adult population [8-10]. Any study comparing the normal levels with the levels determined on MO children with MetS (MO + MetS) and those without MetS in pre-pubertal period could not be detected during the literature survey performed. It is known that some biological markers easy to use for the early diagnosis of MetS in order to take preventive measures before the child develops diabetes (T2D), MetS or cardiovascular diseases (CVDs) are needed. Early identification of children at risk is therefore very important.
In this study, the possible differences in a number of markers thought to be associated with obesity were investigated in prepubertal MO as well as MO + MetS children and the findings were compared to those of children with normal body mass index (NW) for the first time. The concentrations of previously well-recognized adipokines involved in obesity as well as those available with inconsistent data were determined. The aim of this study is to suggest new prediagnostic markers and enlighten the relations between these parameters and anthropometric measurements showing alterations in MO + MetS.
Eighty prepubertal children (aged between 5.8-9.5 years) admitted to Namik Kemal University, Medical Faculty Hospital, Department of Pediatrics were included into the scope of the study. All the children were in Tanner stage 1. Participants were divided into three groups; being thirty NW (17 girls and 13 boys), twenty-five MO (13 girls and 12 boys) and twenty-five MO + MetS (13 girls and 12 boys). These groups were constituted using age- and sex- dependent body mass index (BMI) percentile tables created by World Health Organization [11]. Normal weight group comprised the children, whose values vary between 15th -85th percentiles. Those having the values above 99th percentile were included in the remaining two MO groups. The children with acute or chronic inflammatory, hepatic, renal and malignant diseases were excluded from the scope of the study.
Metabolic syndrome was diagnosed based upon the criteria suggested by International Diabetes Federation [12, 13]. Two of the following criteria were expected to be present in children having ≥90 percentile for waist circumference (WC): Fasting blood glucose (FBG) ≥ 100 mg/dL, triacylglycerols (TRG) ≥ 150 mg/dL, high density lipoprotein cholesterol (HDL-C) ≤ 40 mg/dL , systolic blood pressure (SBP) ≥ 130 mm Hg, diastolic blood pressure (DBP) ≥ 85 mm Hg. Aside from well-known criteria set for MetS diagnosis, the study population was also evaluated by using other supporting criteria proposed for children aged 2 to 11 years in very recent reports [14, 15].
Parents were informed in a detailed manner and written informed consent forms were taken prior to the study. The procedures followed were in accordance with the ethical standards of the responsible institutional committee on human experimentation and with the Helsinki Declaration of 1975, as revised in 2008. The study protocol was confirmed by Namik Kemal University Medical Faculty Ethical Committee.
The weight and height measurements were taken by standard instruments. BMI values were calculated. Circumferences of waist, hip, head and neck were measured and recorded. Their ratios were calculated. Blood pressures were measured using standard mercury sphygmomanometer.
Blood samples were obtained in the morning after an overnight fasting. Routine hematological and biochemical parameters were determined in autoanalyzers.
Serum resistin levels were measured using Human Resistin enzyme-linked immunoassay (ELISA) kit (AssayPro LLC St. Charles, MO, USA). Intra-assay and inter-assay coefficient of variation were 4.6 % and 7.0 %, respectively. Serum IL-6 levels were measured using Human IL-6 ELISA kit (AssayPro LLC St. Charles, MO, USA). Intra-assay and inter-assay coefficient of variation were 2.7 % and 7.4 %, respectively. Serum TNF-alpha levels were measured using Human TNF-alpha ELISA kit (AssayPro LLC St. Charles, MO, USA). Intra-assay and inter-assay coefficient of variation were 2.6 % and 7.96 %, respectively. Serum vaspin levels were measured using Human Visceral Adipose Tissue-Derived Serine Protease Inhibitor (Vaspin) ELISA kit (Aviscera Bioscience, Inc., Santa Clara, CA, USA). Intra-assay and inter-assay coefficient of variation were 4-6 % and 8-10 %, respectively. Serum C Reactive Protein levels were measured using CRP HS ELISA kit (DRG Dignostics GmbH, Germany). Intra-assay and inter-assay coefficient of variation were 2.3- 7.5 % and 2.5-4.1 %, respectively. Serum leptin levels were measured by Leptin (Sandwich) ELISA kit (DRG Dignostics GmbH, Germany). Intra-assay and inter-assay coefficient of variation were 6.91 % and 8.66 %, respectively. Serum monocyte chemoattractant protein 1 levels were measured using Human MCP-1 Platinum ELISA kit (Affymetrix eBioscience, Bender Med Systems GmbH Vienna, Austria). Intra-assay and inter-assay coefficient of variation were 4.7 % and 8.7 %, respectively.Serum adiponectin levels were measured using human adiponectin ELISA kit (AssayPro LLC St. Charles, MO, USA). Intra-assay and inter-assay coefficient of variation were 3.0 % and 8.3 %, respectively. Serum chemerin levels were measured using human chemerin ELISA kit (Aviscera Bioscience, Inc., Santa Clara, CA, USA). Intra-assay and inter-assay coefficient of variation were 4-6 % and 8-10 %, respectively. Serum progranulin levels were measured using human progranulin ELISA kit (Aviscera Bioscience, Inc., Santa Clara, CA, USA). Intra-assay and inter-assay coefficient of variation were 4-6 % and 8-10 %, respectively.
Statistical analyses were performed using SPSS Statistics 20. Data were expressed as mean±SD. Shapiro Wilk test were used to test the normality of the data. The differences among the three groups were determined using one-way ANOVA + post hoc Tukey tests. Correlation tests were performed. Statistical degree of significance was determined as p < 0.05.
The children aged 5.8-9.5 years were divided into three groups; NW (Group 1, n = 30), MO (Group 2, n = 25) and MO + MetS (Group 3, n = 25). There was no statistically significant difference among the gender ratios as well as mean ages of the groups (p ≥ 0.05). The anthropometric measurements were summarized in Table 1.
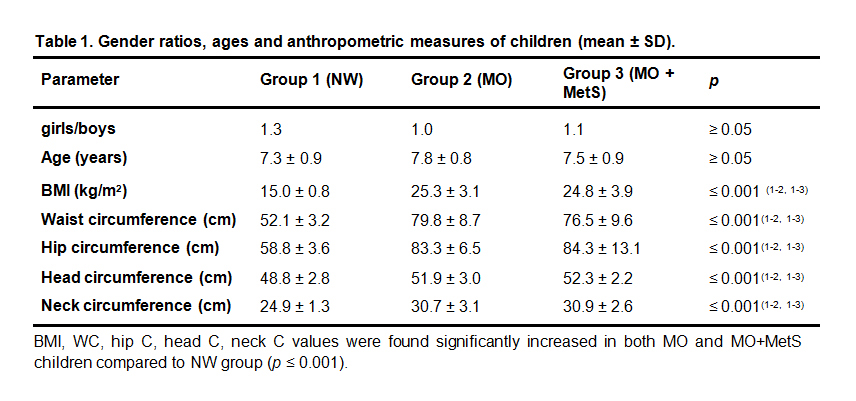 Table 1. Gender ratios, ages and anthropometric measures of children (mean ± SD).
BMI, WC, hip C, head C, neck C values were found significantly increased in both MO and MO + MetS children compared to NW group (p ≤ 0.001).
The adipokine, cytokine and chemokine values measured in groups were tabulated in Table 2.
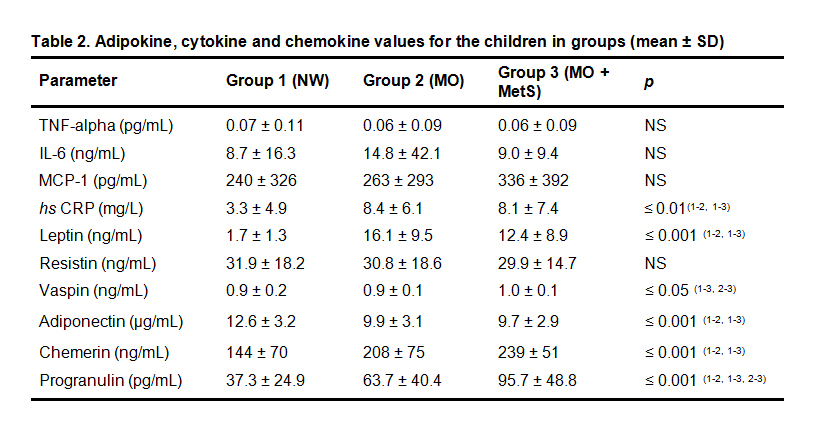 Table 2. Adipokine, cytokine and chemokine values for the children in groups (mean ± SD)
Any statistically significant difference was not found among the groups in terms of TNF-α (p = 0.903), IL-6 (p = 0.649), MCP-1 (p = 0.571) and resistin (p = 0.922) levels (p ≥ 0.05). hsCRP (p = 0.009 for NW vs MO, p = 0.017 for NW vs MO + MetS) and leptin (p = 0.001 for NW vs MO, p = 0.001 for NW vs MO + MetS) levels exhibited significant increases in both MO and MO + MetS groups compared to those of NW children (p ≤ 0.01 and p ≤ 0.001), respectively. Vaspin levels were the same in Group 1 and Group 2 whereas higher values (p = 0.022 for NW vs MO + MetS) were obtained in Group 3 (p ≤ 0.05). Chemerin levels measured in MO and MO + MetS groups (p = 0.002 for NW vs MO, p = 0.001 for NW vs MO + MetS) were higher than those in NW group. (p ≤ 0.001). Significantly reduced adiponectin levels were found in MO and MO + MetS groups (p = 0.005 for NW vs MO, p = 0.003 for NW vs MO + MetS) compared to those of Group 1 (p ≤ 0.001). As an interesting finding, an increasing tendency from Group 1 towards Group 3 were observed in progranulin levels (p = 0.042 for NW vs MO, p = 0.001 for NW vs MO + MetS, p = 0.012 for MO vs MO + MetS) (p ≤ 0.001) (Fig. 1).
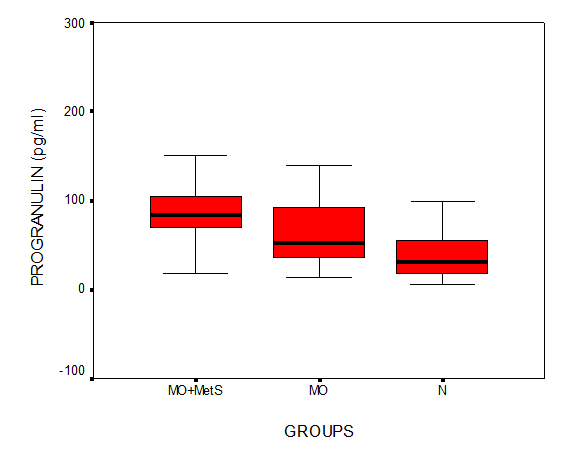 Fig. 1 Boxplots for progranulin levels of the groups
In MO + MetS group, an important and valuable relation, which was not detected in NW as well as MO was found. In this group, WC was negatively correlated with adiponectin (r = -0.515, p = 0.010) (Fig. 2).
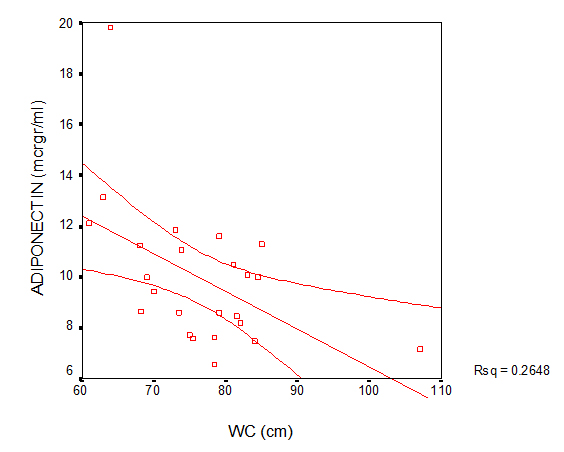 Fig. 2 Correlation plot for the association between waist circumference and adiponectin in MO + MetS group
A strong negative correlation was observed between adiponectin and progranulin in NW group. The correlation was significant at the 0.01 level (r = -0.539; p = 0.004). This was lost in MO and MetS groups (r = -0.095; p = 0.646 and r = 0.064; p = 0.760, respectively).
With the rising prevalence of obesity in childhood, the prevalence of MetS may also increase. MetS in children is a good predictor in children for the development of T2D and CVDs in their adulthood [16, 17]. Particularly recently introduced adipokines constitute an important matter of discussion. Obesity is an important health problem associated with low-grade inflammation, which provides a basis for life threatening chronic diseases. It is characterized by decreases in adiponectin, increases in proinflammatory molecules such as hsCRP, IL-6, TNF-α, resistin and variations in angiopoietin-like proteins. Such a profile is involved in the obesity pathogenesis and obesity-related diseases such as early atherogenesis [18-28].
In a study performed on obese children aged 4-12 years, increased leptin and resistin levels were recorded [29]. The development of MetS in children has been informed as a good predictor for T2D development as well as CVDs in adulthood. The increased secretion of IL-6 and TNF-α by enlarged adipose tissue in obesity largely exhibit proinflammatory effects in atherosclerosis pathogenesis [16, 30]. The values did not differ between the groups also for TNF-α and IL-6. However, leptin levels exhibited significant increases in both MO and MO + MetS groups compared to those of NW children (p ≤ 0.001).
Obese individuals are, mostly, not leptin deficient instead, they exhibit high leptin levels. These high levels fail to control body weight. Elevated leptin has a proinflammatory effect and is associated with weight gain. This is a process, which is called “leptin resistance”, which may be partly responsible for the disturbed body weight regulation, impaired carbohydrate and lipid metabolisms and intestinal nutrient utilization. High leptin levels may also be interpreted as a secondary increase in an attempt to overcome leptin resistance. Leptin resistance is important due to its close relation with obesity, because high leptin levels in obesity predict the risk of T2D, MetS and CVDs [29, 31, 32, 33].
It is suggested that both MCP-1 and TNF-α are markers of systemic inflammation, which underlies a mechanism linking obesity and obesity-associated diseases [34-37]. TNF-α plays role in pathophysiology of obesity-associated problems [38, 39]. In addition, TNF-α stimulates the adipose tissue secretion of MCP-1 [40]. MCP-1 acts as a chemoattractant, sustains the inflammatory cycle by stimulating the recruitment of monocytes to inflammed adipose and vascular tissues [41-43]. In a study, elevated MCP-1 and TNF-α levels were observed in obese children [44]. In our study, although statistically insignificant, highly elevated MCP-1 values were observed in MO + MetS group compared to those in NW and MO groups.
Resistin is one of the adipocyte-secreted hormones, which are associated with obesity and obesity-related alterations. Resistin levels are related to body fat composition and elevated in adipose tissue of MO children. On the other hand, there are studies reporting that statistically significant changes were not observed between obese, overweight and NW children aged 6-8 years [45, 46].
Associations have been detected between circulating resistin and childhood obesity-related inflammatory and cardiometabolic events. Higher resistin and CRP levels were found in severe obese in comparison with moderately obese children. In children with MetS, resistin, IL-6, CRP and TNF-α levels were found to be higher than those detected in NW and obese children. The values measured for metabolic and cardiovascular risk markers including WC were higher than those measured for children in NW and obese groups [5, 17, 47]. In our study, the differences between the resistin concentrations of the groups were not statistically significant. However, hsCRP levels exhibited significant increases in both MO and MO + MetS groups compared to those of NW children (p ≤ 0.01).
Adiponectin is characterized as an antiinflammatory and antiatherogenic adipokine. It is suggested as MetS and cardiovascular risk marker. In severely obese group, more reduced adiponectin levels were observed than moderately obese group. Reduced adiponectin levels were reported in prepubertal obese children aged 8.8. Low adiponectin levels observed in MetS act to prepare a basis for proatherogenic profile [5, 17, 29, 48-50]. The results of our study agree with these findings. The levels in MO and MO + MetS groups did not differ from one another. However, in MO and MO + MetS groups, adiponectin levels statistically lower than those of NW children were obtained.
Chemerin plays a role as a chemoattractant protein and proinflammatory factor, but is also associated with adipocyte differentiation and stimulation of lipolysis. Chemerin mostly acts as a proinflammatory adipokine. However, chemerin also serves as a stimulator of adiponectin secretion and adipokine gene expression is reduced in chemerin knockdown cells. Based upon these properties, chemerin links immune system, adipose tissue and inflammation [17, 51, 52].
Chemerine is reported to have some roles in obesity pathogenesis and related cardiometabolic abnormalities. In a study, high chemerin levels were measured in obese children and thus, this parameter may be related to obesity, inflammation and endothelial activation [53]. Our results agree with the results of this study. Significantly increased values were detected in MO and MO + MetS groups compared to NW group.
The potential links between obesity and cancer need further explanation. Elevated progranulin levels may promote tumor growth. Increased progranulin levels may have an explanatory potential about the link between obesity and cancer. Progranulin excess in peripheral tissues is linked to obesity [54-58]. In our study, it has been demonstrated that progranulin was the only parameter, which shows significant difference among all groups (p ≤ 0.001). These findings emphasize the proinflammatory effect of progranulin and suggest that progranulin may be used as a distinctive marker between NW - MO, NW - MO + MetS, and MO - MO + MetS.
In conclusion, progranulin may be introduced as a parameter which discriminate MO + MetS children from MO children without MetS. To authors’ best knowledge, this study is the first to suggest that the coevaluation of progranulin and adiponectin will be more informative for the purpose.
This study was supported by Namik Kemal University Scientific Research Fund Projects Coordination Unit Project No: NKUBAP.00.20.AR.14.16. The funders had no role in study design, data collection and analysis, decision to publish, or preparation of the manuscript.
The authors declare that there is no conflict of interest regarding the publication of this paper.
1.
2.
3.
4.
5.
6.
7.
8.
9.
10.
11.
12.
13.
14.
15.
16.
17.
18.
19.
20.
21.
22.
23.
24.
25.
26.
27.
28.
29.
30.
31.
32.
33.
34.
35.
36.
37.
38.
39.
40.
41.
42.
43.
44.
45.
46.
47.
48.
49.
50.
51.
52.
53.
54.
55.
56.
57.
58.
Donma M M, Ekmekci O B, Ekmekci H, Donma O. Evaluation of the Markers Affecting Obesity in Children. Med One. 2018 Apr 25; 3: e180004. https://doi.org/10.20900/mo.20180004

Copyright © 2020 Hapres Co., Ltd. Privacy Policy | Terms and Conditions


