Location: Home >> Detail
Adv Geriatr Med Res. 2026;8(1):e260005. https://doi.org/10.20900/agmr20260005
 ,
Eric Gan ,
Joshua Mijares ,
Manoj Bhagwat ,
Chris Gale
,
Eric Gan ,
Joshua Mijares ,
Manoj Bhagwat ,
Chris Gale
Department of Medicine, Indiana University Health System, Indianapolis, IN 46204, USA
* Correspondence: Neil Jairath
Background: Hospitalized adults face multiple immobility-related adverse outcomes, yet existing risk tools address single outcomes with modest discrimination. A unified multi-outcome framework is needed. Methods: Retrospective cohort study at a large academic health system (2013–2023). Adults with complete mobility assessments (AM-PAC “6-Clicks” or Barthel Index; N = 9842) were included. Seven regularized logistic regression models predicted functional decline, venous thromboembolism (VTE), falls, pressure injuries, prolonged length of stay, post-acute discharge, and 30-day readmission using admission-time predictors. Models were developed (80%) and validated (20%) with cross-validation. Performance was compared with Braden, Morse, Padua, Charlson, and LACE scores. Results: Outcome incidences ranged from 1.1% (VTE) to 33% (prolonged stay). After recalibration, the Immobility Harm Risk Score (IHRS) demonstrated good discrimination (AUC 0.72–0.82) with excellent calibration (slopes 0.96–1.01). IHRS outperformed legacy instruments by 0.04–0.16 AUC units with positive net reclassification indices (+0.19 to +0.59). Decision curve analysis confirmed clinical benefit across relevant threshold ranges. Temporal validation showed stable discrimination (ΔAUC < 0.02). Conclusion: The IHRS provides a practical, multi-outcome risk stratification framework at admission. This single-center study requires external validation; performance is strongest in patients aged ≥ 65 years.
COPD, chronic obstructive pulmonary disease; IQR, interquartile range; LOS, length of stay; SD, standard deviation; AUC, area under the receiver operating characteristic curve; CI, confidence interval; LOS, length of stay; VTE, venous thromboembolism
Hospitalization frequently precipitates immobility [1–3], which initiates a cascade of adverse outcomes. Prolonged bed rest and reduced mobility contribute to functional decline (deconditioning) [4–6], venous thromboembolism [7–9], falls [10–12], and pressure injuries [13–15]. Among older inpatients, low mobility during hospitalization is common—affecting 30–50% of patients depending on definitions used [1,4,16]—and is independently associated with functional decline, new institutionalization, and mortality after adjustment for illness severity and baseline function [4,17,18]. A meta-analysis of hospital-associated disability estimates that approximately 30% of older adults experience decline in one or more activities of daily living during acute hospitalization, with immobility identified as a key modifiable mediator [6].
The pathophysiology linking immobility to adverse outcomes operates through multiple mechanisms. Prolonged bed rest induces rapid skeletal muscle atrophy, with measurable strength losses occurring within 48–72 h of immobilization [19,20]. Venous stasis from reduced lower extremity movement increases thrombotic risk—landmark trials in immobilized medical inpatients report symptomatic deep vein thrombosis rates of 1–1.5% even with pharmacologic prophylaxis [7,8,21]. Falls represent a visible manifestation of deconditioning, with lower mobility levels correlating with higher fall incidence in hospital quality-improvement data [10,22]. Reduced repositioning frequency and tissue perfusion impairment from immobility contribute to pressure injury development [13,23]. Early mobilization interventions have demonstrated efficacy in reducing these harms among critically ill patients, supporting the biological rationale that movement mitigates downstream morbidity [24–26].
Despite the established burden of immobility-associated adverse outcomes, current risk assessment approaches have important limitations. Single-outcome tools such as the Morse Fall Scale [27], Braden Pressure Injury Scale [28], and Padua VTE Score [29] were developed for specific populations and demonstrate variable discrimination when applied to heterogeneous medical-surgical cohorts. Recent validation studies of the Morse Fall Scale report AUCs of 0.60–0.65 with sensitivity-specificity tradeoffs that limit clinical utility for case-finding [27,30]. Meta-analyses of the Braden Scale show pooled AUCs of 0.64–0.72 with substantial heterogeneity across settings, particularly underperforming in ICU populations [28,31]. The Padua Score, derived in an Italian medical cohort, has shown only moderate external validity (AUC 0.60–0.70) in North American populations [29,32].
More recently, machine learning and EHR-based prognostic models have been developed for individual adverse events, including falls [33], pressure injuries [34], and readmissions [35]. However, most remain single-outcome, site-specific, or require complex computational infrastructure incompatible with standard clinical workflows [36]. Few address immobility-associated adverse outcomes as an integrated clinical domain, despite the shared underlying pathophysiology and overlapping risk factors.
We developed the Immobility Harm Risk Score to address this gap—an interpretable, multi-outcome, admission-time risk stratification framework that leverages routinely available EHR data to simultaneously estimate risk for seven immobility-associated adverse events. In this study, we report the model’s development and internal validation, compare its performance against established single-outcome instruments, and assess calibration and temporal stability.
This was a retrospective prognostic study following TRIPOD guidelines for prediction model development with internal validation (Type 1b) [37]. The study included adult inpatients at a large integrated academic health system comprising multiple hospitals, using linked electronic health record data from 2023 Jan 1 through 2023 Dec 31.
Cohort ConstructionFigure 1 displays the cohort derivation. From 847,523 total encounters during the study period, we sequentially excluded observation and emergency department-only stays (n = 312,456), patients aged < 18 years (n = 42,805), obstetric admissions (n = 68,917), psychiatric admissions (n = 21,167), elective rehabilitation admissions (n = 16,087), stays < 24 h precluding mobility assessment (n = 77,218), admissions lacking baseline mobility documentation within 24 h (n = 278,234), admissions lacking discharge mobility assessment (n = 12,847), records missing > 20% of key predictors (n = 4123), patients with <6 months post-discharge follow-up (n = 2847), and duplicate patients (n = 980, one randomly selected admission retained per patient).
The final analytic cohort included 9842 unique hospitalizations. Each hospitalization represents a unique patient; among 10,822 patients with eligible admissions, 980 had more than one qualifying hospitalization during 2013–2023, and one admission per patient was randomly selected to avoid within-subject correlation. The requirement for complete baseline and discharge mobility assessments—present in approximately 10% of otherwise eligible admissions—reflects current clinical workflows where standardized mobility measurement remains inconsistently documented. This design decision was necessary for developing mobility-centered prediction models but limits generalizability to populations with similar documentation practices.
 Figure 1. Cohort Derivation. Flow diagram showing sequential exclusion criteria applied to derive the final analytic cohort of 9,842 patients from 847,523 total encounters.
All predictors were measured at or within 24 h of admission and selected a priori based on literature review, clinical plausibility, and data availability. No post-admission variables were used as predictors. Table 1 provides a comprehensive list of predictor variables.
Demographics: Age (years), sex, self-reported race and ethnicity.
Mobility and Function: AM-PAC “6-Clicks” Basic Mobility T-score, a standardized measure (population mean = 50, SD = 10) documented by physical therapy, occupational therapy, or nursing within 24 h of admission [38]. When AM-PAC was unavailable (n = 832, 8.5%), Barthel Index scores were mapped to equivalent T-scores using published crosswalk algorithms [39]. Baseline mobility was categorized as “Independent” (T-score ≥ 45), “Needs Assistance” (T-score 35–44), or “Dependent” (T-score < 35).
Clinical Context: Admission diagnosis category using Clinical Classifications Software Refined (CCSR) groupings; ICU versus ward location at 24 h; admission urgency; admission source.
Comorbidities: Charlson Comorbidity Index and individual comorbidity indicators from ICD-9/10 codes documented in the 12 months preceding admission [40].
Medications: Binary indicators for parenteral anticoagulants, benzodiazepines, antipsychotics, opioids (including morphine milligram equivalents), anticholinergics, and systemic corticosteroids documented within 24 h.
Cognitive Status: Delirium or confusion on admission, identified through nursing screens or positive CAM-ICU within 48 h.
 Table 1. Complete Predictor Set for IHRS Models.
Seven outcomes were defined using validated code sets and structured EHR documentation: Box 1 provides a summary of all seven outcomes with their operational definitions.
 Box 1. Summary of Immobility Harm Risk Score Outcomes.
Functional decline (deconditioning): Decrease in functional mobility from admission to discharge among patients discharged to community settings (home or home with services). Defined as decline of ≥4.5 T-score points on AM-PAC Basic Mobility (the minimal detectable change at 90% confidence [38,41]) or ≥10 points on Barthel Index in patients with Barthel-based assessments [42]. These thresholds are clinimetrically equivalent, both representing approximately 0.5 standard deviations of measurement—the established boundary between measurement error and true change. Patients discharged to post-acute facilities were analyzed separately (see below), as their functional trajectory is captured differently.
Venous thromboembolism (VTE): Acute deep vein thrombosis or pulmonary embolism identified by ICD-10 codes (I26.x, I82.4x, I82.5x, I82.9x) with confirmatory imaging within 72 h.
Inpatient falls: Date- and time-stamped events from the institutional safety reporting system.
Hospital-acquired pressure injuries: Stage 2 or greater documented by wound care nursing during admission.
Prolonged length of stay: Calendar-day stay exceeding 7 days.
Post-acute facility discharge: Discharge to skilled nursing facility, inpatient rehabilitation, or long-term acute care per standardized disposition codes.
30-day readmission: Unplanned readmission within 30 days, excluding scheduled procedures per CMS Planned Readmission Algorithm v4.0.
Missing DataRecords missing >20% of key predictors were excluded during cohort construction. Among included records, remaining missing values for continuous predictors (<5% for any variable; Supplementary Table S4) were imputed using predictive mean matching (10 imputations, 20 iterations). Binary predictors with missingness were modeled with indicator variables. Outcomes were not imputed.
Model DevelopmentWe estimated seven independent logistic regression models, each with L2 (ridge) regularization [43,44], using the same set of admission-time predictors for all seven outcomes. Ridge penalization was chosen over L1 (LASSO) or elastic net regularization because the predictor set was selected a priori on clinical grounds and we aimed to retain all variables in the model rather than perform automated variable selection; ridge regression shrinks coefficients toward zero without excluding predictors, preserving interpretability across outcomes [43,44]. This architecture was selected over multi-task learning frameworks [45] or ensemble methods [46] to maximize transparency, facilitate integration with commercial EHR systems, and permit outcome-specific probability estimation and recalibration. Multi-task learning, which jointly estimates parameters across correlated outcomes, was not formally compared; exploratory analyses suggested minimal improvement given modest inter-outcome correlations (ϕ = 0.10–0.25) and adequate sample size for independent estimation, but formal comparison was outside the scope of this development study.
Continuous predictors were modeled with restricted cubic splines (3 knots). Categorical variables were one-hot encoded. Class imbalance was addressed via inverse probability weighting. Regularization strength was selected via nested 5-fold cross-validation optimizing AUC. Variance inflation factors were examined for continuous predictors; no VIF exceeded 5.0, and the Charlson Comorbidity Index was retained alongside individual comorbidity indicators because ridge regularization accommodates moderate collinearity by distributing coefficient weight across correlated predictors rather than inflating individual estimates.
Sample size adequacy was assessed per Riley et al. criteria [47], requiring ≥10 events per candidate variable for the smallest outcome. With 108 VTE events and approximately 35 candidate predictors after encoding, this criterion was marginally satisfied.
The cohort was randomly split 80%/20% stratified by outcomes. Models were developed on the 80% training sample (n = 7874) and validated on the 20% holdout (n = 1968). Ten-fold cross-validation within the training sample provided optimism-corrected estimates.
RecalibrationRaw model predictions underwent Platt scaling recalibration [48] to correct for systematic miscalibration induced by regularization and class weighting. Recalibration models were fit within cross-validation folds to prevent data leakage.
Temporal ValidationTo assess stability across time and practice changes (including the COVID-19 pandemic), we performed temporal validation by training on 2013–2019 admissions (n = 6233) and testing on 2020–2023 (n = 3609).
Comparator InstrumentsWe compared IHRS performance against established instruments: Braden Scale for pressure injuries [28], Morse Fall Scale for falls [27], Padua VTE Score for thromboembolism [29], Charlson Index for prolonged stay [40], and LACE Index for readmission [49]. Comparator scores were reconstructed retrospectively from structured EHR data using published point assignments.
Statistical AnalysisDiscrimination: Area under the receiver operating characteristic curve (AUC) with 95% confidence intervals from 2000 bootstrap replicates.
Calibration: Calibration slope and intercept from logistic regression of outcomes on predicted log-odds, with ideal values of 1.0 and 0.0 respectively [48]. Mean predicted versus observed event rates assessed calibration-in-the-large.
Overall accuracy: Brier score, compared to the null model (prevalence × [1 − prevalence]).
Decision curve analysis: Net benefit calculated across clinically relevant threshold ranges to assess clinical utility [50].
Reclassification: Continuous net reclassification index (cNRI) comparing IHRS to legacy instruments [51].
Subgroup analyses: Discrimination by age (≥65 vs. <65), sex, race (White vs. non-White), and admission unit (ICU vs. non-ICU).
Analyses used Python 3.10 (Python Software Foundation). Logistic regression models were fit using scikit-learn 1.3.0 (LogisticRegression with penalty = ‘l2’ and solver = ‘lbfgs’); Platt scaling recalibration used CalibratedClassifierCV. Restricted cubic splines were generated with patsy 0.5.3 (cr function). Multiple imputation used the mice package via rpy2 interface. Additional libraries included pandas 2.0.3, numpy 1.24.3, and scipy 1.11.2. Analysis code is available from the corresponding author upon request.
The analytic cohort included 9,842 unique hospitalizations from 2013–2023 (Table 2). Mean age was 64 ± 14 years; 52% were female; 72% identified as White, 14% as Black, and 7% as Hispanic. Common comorbidities included diabetes (26%), heart failure (21%), COPD (18%), and cancer (14%). Median Charlson Index was 2 (IQR 1–3).
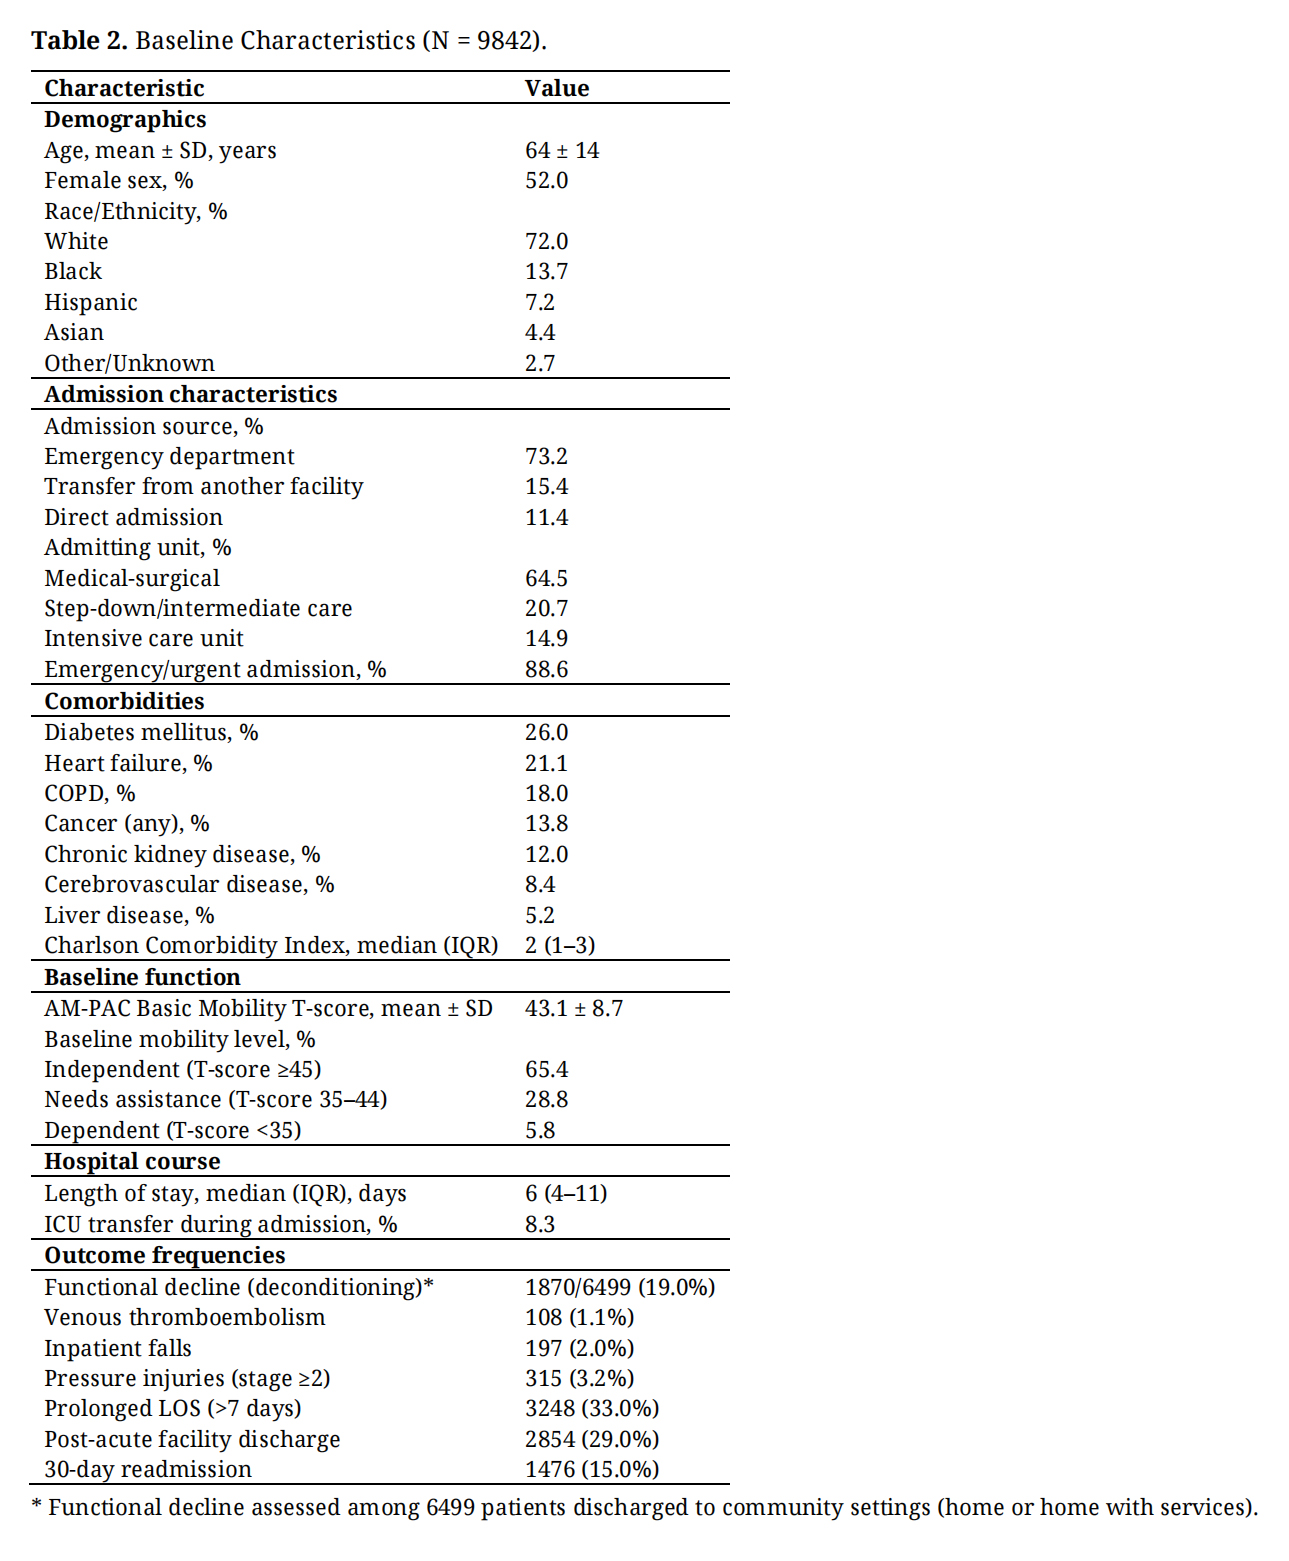 Table 2. Baseline Characteristics (N = 9842).
Mean AM-PAC Basic Mobility T-score at admission was 43.1 ± 8.7, indicating lower baseline mobility than the general population (normative mean = 50). Twenty-nine percent of patients required assistance with mobility at baseline; 6% were dependent.
Most admissions (73%) originated from the emergency department. Admitting units were medical-surgical (65%), step-down (21%), and ICU (15%). Median length of stay was 6 days (IQR 4–11).
Outcome IncidenceOutcome rates were: functional decline 19.0% (n = 1,870 among 6,499 community discharges), VTE 1.1% (n = 108), falls 2.0% (n = 197), pressure injuries 3.2% (n = 315), prolonged LOS 33.0% (n = 3248), post-acute discharge 29.0% (n = 2854), and 30-day readmission 15.0% (n = 1476).
Model PerformanceAfter recalibration, IHRS demonstrated good discrimination across all outcomes, with AUCs ranging from 0.72 to 0.82 (Table 3). Strongest discrimination was observed for deconditioning (AUC 0.82, 95% CI 0.81–0.84), post-acute discharge (0.81, 0.80–0.81), and pressure injuries (0.80, 0.77–0.83). Acceptable discrimination was achieved for VTE (0.77, 0.76–0.79), prolonged LOS (0.76, 0.75–0.77), falls (0.74, 0.70–0.78), and readmission (0.72, 0.71–0.74).
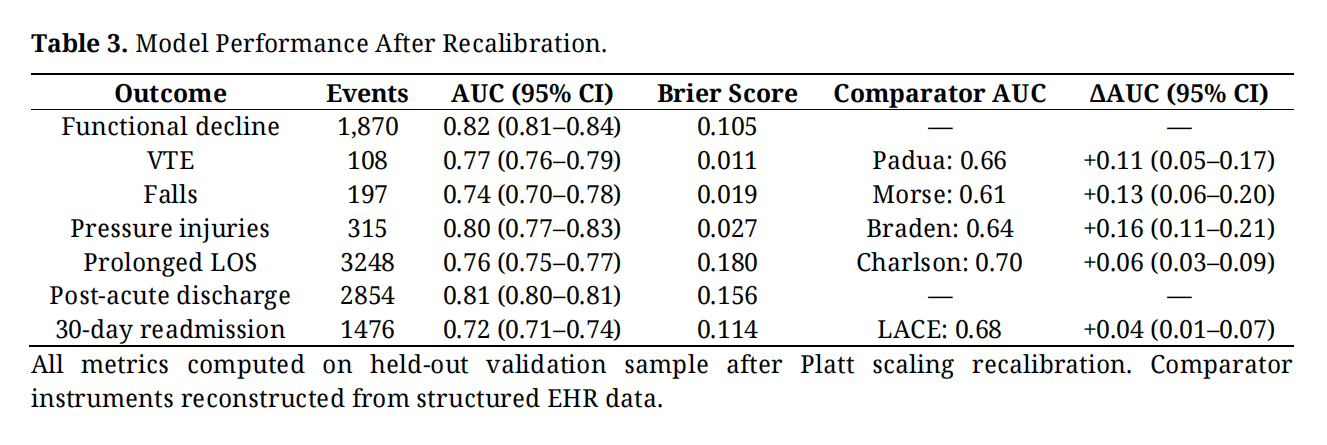 Table 3. Model Performance After Recalibration.
Recalibrated predictions showed excellent calibration (Figure 2; Table S5). Calibration slopes ranged from 0.96 to 1.01; intercepts ranged from −0.19 to +0.03. Mean predicted probabilities matched observed event rates for all outcomes (maximum absolute difference 0.001). Brier scores ranged from 0.011 (VTE) to 0.180 (prolonged LOS), all substantially better than null models.
 Figure 2. Calibration Plots. Observed versus predicted probabilities for each outcome after Platt scaling recalibration. Points represent deciles of predicted risk; point size reflects sample size in each decile. Dashed line indicates perfect calibration.
IHRS outperformed established comparators for all applicable outcomes (Table 3): pressure injuries (AUC 0.80 vs. Braden 0.64, Δ = +0.16, 95% CI 0.11–0.21), VTE (0.77 vs. Padua 0.66, Δ = +0.11, 95% CI 0.05–0.17), falls (0.74 vs. Morse 0.61, Δ = +0.13, 95% CI 0.06–0.20), prolonged LOS (0.76 vs. Charlson 0.70, Δ = +0.06, 95% CI 0.03–0.09), and readmission (0.72 vs. LACE 0.68, Δ = +0.04, 95% CI 0.01–0.07). All ΔAUC comparisons were statistically significant (DeLong test p < 0.05).
Continuous NRI values indicated improved classification for both events and non-events (Table S8): pressure injuries (+0.59), falls (+0.38), VTE (+0.26), prolonged LOS (+0.24), and readmission (+0.19).
Decision Curve AnalysisDecision curve analysis demonstrated that IHRS provided greater net benefit than comparator instruments across clinically relevant threshold ranges (Figure 3). For pressure injuries, IHRS showed net benefit superior to the Braden Scale across thresholds from 1.5% to 10%. For VTE, IHRS outperformed the Padua Score at thresholds between 0.5% and 2%. Net benefit advantages were consistent for falls (vs. Morse) and readmission (vs. LACE).
 Figure 3. Decision Curve Analysis. Net benefit of the Immobility Harm Risk Score (IHRS) compared with legacy instruments across clinically relevant threshold ranges for (A) pressure injuries vs. Braden Scale, (B) VTE vs. Padua Score, (C) falls vs. Morse Fall Scale, and (D) 30-day readmission vs. LACE Index. The IHRS demonstrates greater net benefit than comparators across most threshold ranges.
Models trained on 2013–2019 and tested on 2020–2023 showed stable discrimination (Table S6). All ΔAUC values were within ±0.02, suggesting robustness despite practice changes during the COVID-19 pandemic.
Subgroup AnalysesDiscrimination was generally consistent across demographic subgroups (Table S9), though performance for deconditioning was notably stronger in patients aged ≥ 65 years (AUC 0.90) compared to <65 years (0.63), reflecting higher event rates and stronger predictive signal among older adults. This finding suggests the IHRS for functional decline is most appropriately applied to older hospitalized patients. Performance was similar across sex and race categories for most outcomes.
In this single-center development and validation study, the Immobility Harm Risk Score provided a practical admission-time framework for estimating risk across seven immobility-associated outcomes using routinely collected EHR data. The model demonstrated good discrimination (AUC 0.72–0.82), excellent post-recalibration calibration, temporal stability, and consistent improvements over established single-outcome instruments.
Clinical InterpretationThe IHRS addresses a conceptual gap between how clinicians understand immobility-associated harm—as an interconnected syndrome—and how hospitals currently assess risk through siloed tools. By applying a common predictor framework to multiple outcomes, the IHRS enables identification of patients at elevated risk for functional decline, thromboembolism, falls, pressure injuries, prolonged hospitalization, institutional discharge, and readmission simultaneously.
Performance gains over legacy instruments were most pronounced for pressure injuries (+0.16 AUC vs. Braden) and falls (+0.13 AUC vs. Morse), outcomes for which existing tools have shown limited external validity [28,30]. The inclusion of standardized mobility measurement (AM-PAC T-scores) likely contributed to these improvements, as baseline functional status captures physiologic reserve not assessed by disease-specific risk factors alone.
The functional decline outcome warrants specific interpretation. Our definition captured meaningful mobility decline among patients discharged to community settings—those expected to resume independent living. Patients discharged to post-acute facilities were analyzed as a separate outcome, as their care trajectories differ fundamentally. The 19% deconditioning rate among community discharges aligns with prior estimates of hospital-associated disability [6] and identifies a population who may benefit from targeted rehabilitation or transitional care. Notably, model performance for deconditioning was substantially stronger in patients aged ≥65 years (AUC 0.90 vs. 0.63 in younger patients), suggesting the IHRS is most useful for identifying deconditioning risk in older hospitalized adults.
Model CalibrationThe need for recalibration deserves emphasis. Raw predictions from regularized models with class weighting were systematically miscalibrated—a common finding when techniques optimized for discrimination are applied without calibration adjustment [48]. After Platt scaling, calibration was excellent. Hospitals implementing the IHRS must plan for local recalibration using institutional data before deployment for individual-level probability communication.
Comparison with Prior WorkOur approach differs from prior EHR-based prediction models in prioritizing multi-outcome utility and interpretability over maximal single-outcome performance. Deep learning approaches have achieved AUCs of 0.80–0.90 for individual outcomes like pressure injuries [34] but require specialized infrastructure. The IHRS uses standard logistic regression, facilitating integration with commercial EHR platforms.
We implemented seven independent models rather than a joint multi-task framework. While multi-task learning can improve rare-outcome prediction by leveraging outcome correlations, pairwise outcome correlations were modest in our data (ϕ = 0.10–0.25) and sample size was adequate for independent estimation. The simpler architecture permits outcome-specific recalibration and transparent probability interpretation.
LimitationsSeveral limitations merit consideration. First, this represents single-center development and internal validation. External validation across health systems with different populations, EHR platforms, and documentation practices is essential before broader adoption. Second, the cohort was restricted to patients with documented baseline and discharge mobility assessments—approximately 10% of otherwise eligible admissions. This reflects current clinical reality where standardized mobility measurement remains inconsistent; performance in unselected admissions without mobility documentation is unknown. Third, comparator instruments were reconstructed retrospectively from EHR data rather than prospectively documented, potentially disadvantaging these tools relative to real-world use. Fourth, the temporal validation period (2020–2023) included COVID-19–related practice changes; generalizability to non-pandemic settings requires confirmation. Fifth, the model predicts risk but does not specify interventions—demonstrating that IHRS-guided protocols reduce harm requires prospective implementation studies. Sixth, model performance for deconditioning was notably stronger in older adults (≥65 years); clinical implementation should consider that predictions may be less reliable in younger patients.
ImplicationsFor hospitals with established mobility assessment workflows, the IHRS offers a mechanism to prioritize mobilization resources, particularly for older patients at risk for functional decline. Implementation should include local recalibration, clinical decision support integration, and prospective monitoring. For health systems without routine mobility assessment, these findings underscore the value of standardized functional measurement—AM-PAC “6-Clicks” can be completed in under 2 min and provides prognostic information beyond demographics and comorbidities alone [38].
Regarding clinical operationalization, we envision the IHRS deployed as an automated clinical decision support tool embedded within the EHR, computing risk scores at admission from routinely documented data elements without requiring manual calculation. The model’s logistic regression architecture permits straightforward implementation as a scoring algorithm within EHR platforms (e.g., Epic BestPractice Alerts or Cerner MPages). We propose a three-tier risk stratification: low risk (<10th percentile of predicted probability), moderate risk (10th–75th percentile), and high risk (>75th percentile), with tier-specific clinical pathways. Low-risk patients would receive standard care and mobility encouragement. Moderate-risk patients would be flagged for structured mobility protocols, daily reassessment, and prophylactic interventions (e.g., VTE chemoprophylaxis review, pressure injury prevention bundles). High-risk patients would trigger multidisciplinary consultation including physical therapy, wound care, and discharge planning within 24 hours of admission. These thresholds require prospective validation before clinical adoption; we plan to publish a freely accessible online risk calculator and implementation toolkit following external validation.
Future DirectionsExternal validation in geographically diverse populations is the essential next step. Prospective implementation studies should evaluate whether IHRS-guided interventions reduce immobility-associated harms. Investigation of patient-facing applications for shared goal-setting merits exploration.
The Immobility Harm Risk Score provides a feasible, interpretable, multi-outcome risk stratification framework at hospital admission that outperforms single-outcome legacy tools. The model requires site-specific recalibration and performs best for deconditioning prediction in patients aged ≥ 65 years. External validation and prospective implementation studies are needed before widespread adoption.
This study was approved by the Institutional Review Board (protocol #38324, approved 3/5/2024). Waiver of informed consent was granted in accordance with 45 CFR 164.512(i)(2)(ii) as the research involved no more than minimal risk and could not practicably be conducted without the waiver.
Declaration of Helsinki STROBE Reporting GuidelineThis study adheres to the Transparent Reporting of a multivariable prediction model for Individual Prognosis or Diagnosis (TRIPOD) guidelines for prediction model development and internal validation (Type 1b). A completed TRIPOD checklist is provided in Supplementary Table S1 [37].
The following supplementary materials are available online, Table S1: TRIPOD Checklist for Prediction Model Development and Validation, Table S2: Predictor Definitions, Table S3: Outcome Definitions, Table S4: Missing Data Patterns, Table S5: Calibration Metrics After Recalibration, Table S6: Temporal Validation (Train 2013–2019, Test 2020–2023), Table S7: Decision Curve Analysis: Net Benefit at Key Thresholds, Table S8: Net Reclassification Index vs. Comparators, Table S9: Subgroup Performance (Functional Decline).
Deidentified data supporting this study are available from the corresponding author upon reasonable request, subject to institutional data use agreements.
NKJ conceived and designed the study, performed data analysis, and wrote the manuscript. EG, JM, and MB contributed to data acquisition and cleaning. CG provided clinical expertise on mobility assessment and rehabilitation protocols. All authors reviewed and approved the final manuscript.
NKJ is founder and CMO of KinetiTec, Inc. The authors have no additional conflicts of interest.
This research received no specific grant from any funding agency in the public, commercial, or not-for-profit sectors.
The authors thank the clinical informatics team for assistance with data extraction.
1.
2.
3.
4.
5.
6.
7.
8.
9.
10.
11.
12.
13.
14.
15.
16.
17.
18.
19.
20.
21.
22.
23.
24.
25.
26.
27.
28.
29.
30.
31.
32.
33.
34.
35.
36.
37.
38.
39.
40.
41.
42.
43.
44.
45.
46.
47.
48.
49.
50.
51.
Jairath N, Gan E, Mijares J, Bhagwat M, Gale C. Development and Internal Validation of the Immobility Harm Risk Score for Predicting Inpatient Immobility-Associated Outcomes: A Retrospective Cohort Study. Adv Geriatr Med Res. 2026;8(1):e260005. https://doi.org/10.20900/agmr20260005.

Copyright © Hapres Co., Ltd. Privacy Policy | Terms and Conditions


