Location: Home >> Detail
Crop Breed Genet Genom. 2026;8(3):e260018. https://doi.org/10.20900/cbgg20260018
 ,
Paolo Vitale 1 ,
Pacome Judon 2 ,
Leonardo Abdiel Crespo Herrera 1 ,
Andrzej Kilian 3 ,
Ng Eng Hwa 1 ,
Jose Crossa 4
,
Paolo Vitale 1 ,
Pacome Judon 2 ,
Leonardo Abdiel Crespo Herrera 1 ,
Andrzej Kilian 3 ,
Ng Eng Hwa 1 ,
Jose Crossa 4
1
2
3
4
*
Genomic selection (GS) has become an important tool for accelerating genetic gain in wheat breeding by enabling the prediction of target traits using genome-wide molecular markers. However, the large-scale implementation of GS in public breeding programs remains constrained by the cost of high-density genotyping platforms. Medium-density targeted genotyping approaches provide a cost-effective alternative while maintaining prediction accuracy. In this study, we evaluated the performance of a public wheat mid-density genotyping platform (Wheat DArTag 3.9K EIB 2.0) for GS by comparing it with a previously deployed higher-density genotyping-by-sequencing (GBS) platform. The analyses were conducted using five consecutive years of CIMMYT Elite Yield Trials comprising more than 5000 elite spring wheat lines evaluated across multiple irrigated, drought, and heat-stressed environments. Trait predictability was assessed for agronomic, phenological, and disease resistance traits using the genomic best linear unbiased prediction (GBLUP) model under several cross-validation scenarios, including within-year and across-year predictions. After quality filtering, the DArTag platform retained approximately 1600–1800 SNPs, whereas the GBS platform retained approximately 6500–9600 SNPs. Across traits and years, no consistent superiority of GBS over DArTag was observed, and correlations between genomic estimated breeding values (GEBVs) obtained from both platforms were high, indicating that both genotyping systems would lead to highly similar selection decisions. The results suggest that, in elite wheat germplasm characterized by long-range linkage disequilibrium and strong realized genomic relationships, medium-density targeted genotyping platforms can retain most of the predictability achieved by higher-density systems. Overall, the public Wheat DArTag 3.9K EIB 2.0 platform represents a scalable and cost-effective solution for implementing GS in operational wheat breeding programs.
Genomic selection (GS) has transformed modern plant and animal breeding by enabling the prediction of breeding values using genome-wide molecular markers distributed throughout the genome [1]. In contrast to marker-assisted selection, which targets a limited number of loci, GS captures the combined effects of thousands of markers simultaneously and is particularly effective for complex quantitative traits controlled by many loci of small effects. In breeding programs, GS is implemented by combining phenotypic and genotypic information from a training population to estimate marker effects or genomic relationships, which are then used to predict genomic estimated breeding values (GEBVs) for selection candidates without phenotypic records [2]. The ability of GS to accelerate breeding cycles, increase selection intensity, reduce phenotyping costs, and improve genetic gain has led to its widespread adoption in crops and livestock species.
In wheat breeding, GS has become particularly attractive because grain yield, stress adaptation, and disease resistance are highly quantitative traits strongly influenced by genotype-by-environment interactions (G × E) and often exhibit moderate heritability. GS enables breeders to select promising lines at earlier generations, reduce the need for extensive multi-location phenotyping, and improve operational breeding efficiency [2,3]. Consequently, many public and private wheat breeding programs have integrated genomic prediction into routine selection pipelines [4,5].
The accuracy of genomic prediction depends on several biological and operational factors, including trait heritability, the size and composition of the training population, the relatedness between training and testing populations, the statistical model used, and the ability of the genotyping platform to capture genome-wide linkage disequilibrium (LD) with quantitative trait loci (QTL) affecting the trait of interest [2]. To maximize genome coverage, many GS studies have relied on high-density genotyping technologies such as genotyping-by-sequencing (GBS) and large SNP arrays [6,7]. These technologies can generate tens of thousands of genome-wide markers and have proven highly useful for genomic prediction in wheat and other crops. However, the routine implementation of GS in large breeding programs remains constrained by genotyping costs. Public breeding programs often evaluate thousands to tens of thousands of breeding lines annually, making high-density genotyping economically challenging, particularly in developing countries. Importantly, increasing marker density does not always translate into higher prediction accuracy. Several studies have shown that subsets of informative markers can provide prediction abilities comparable to those obtained with substantially larger marker datasets [8,9]. In many breeding populations, especially elite germplasm with relatively narrow genetic backgrounds, genomic prediction accuracy depends more on realized genomic relationships and LD patterns than on extremely dense genome-wide marker coverage.
Bread wheat (Triticum aestivum L.) is particularly suitable for medium-density genotyping approaches. It is a predominantly self-pollinating species characterized by extended LD and large haplotype blocks, allowing fewer markers to capture substantial proportions of the genetic variation across the genome. Although wheat possesses a very large genome of approximately 17 Gb, most of the genome consists of repetitive DNA sequences [10,11]. Consequently, ultra-high marker density may not always be necessary for effective genomic prediction. Empirical evidence supports this hypothesis. Reducing marker density from approximately 17,000 markers to 5000 markers maintained similar genomic prediction accuracies in elite spring wheat germplasm [12]. Similarly, carefully selected marker subsets have been shown to substantially reduce genotyping costs while preserving prediction performance [9].
These observations have stimulated interest in developing cost-effective low- and medium-density genotyping platforms specifically optimized for genomic selection and breeding deployment. Among these technologies, DArTag represents a targeted genotyping-by-sequencing approach based on molecular inversion probes (MIPs), allowing flexible and modular incorporation of genome-wide and trait-associated markers [13,14]. The DArTag technology enables scalable genotyping at reduced cost while maintaining broad genome coverage. In addition, targeted platforms provide opportunities to integrate diagnostic markers associated with major genes and QTL relevant for breeding applications.
As part of the CGIAR Excellence in Breeding (EIB) initiative, a public wheat mid-density genotyping platform (Wheat DArTag 3.9K EIB 2.0) was developed to support GS and molecular breeding applications in wheat. The platform integrates genome-wide distributed SNPs together with trait-associated and gene-based markers relevant to wheat improvement. Nevertheless, despite the increasing interest in reduced-density genotyping strategies, relatively few studies have evaluated the operational performance of medium-density targeted platforms across multiple years, environments, and traits in large elite wheat breeding populations. A recent study [15] evaluated the predictive performance of three different marker platforms, including GBS, DArTag, and skim-sequencing for target traits in wheat breeding. The authors found that none of the marker platforms consistently outperformed the others, however, GBS markers and skim-sequencing require access to high-performance computing and larger data storage capacity for sequence data. As computational resources become more widely available, the authors highlighted the potential of skim-seq technology for future applications in plant breeding programs.
The CIMMYT Global Wheat Program provides an ideal framework for evaluating such technologies because it routinely deploys GS across diverse stress and irrigated environments and evaluates thousands of elite breeding lines annually [4]. Given the long-range (LD) and strong realized genomic relationships characteristic of elite wheat germplasm, we hypothesized that a carefully designed mid-density targeted genotyping platform would retain most of the genomic prediction ability achieved by higher-density GBS platforms while substantially reducing genotyping costs.
Therefore, the objective of this study was to evaluate the performance of the public Wheat DArTag 3.9K EIB 2.0 platform for genomic prediction across multiple years, environments, and traits in the CIMMYT elite spring wheat breeding program and to compare its prediction performance with a previously deployed higher-density GBS platform.
For this study, genotypic and phenotypic data derived from five consecutive years of CIMMYT’s Elite Yield Trials (EYT) were used. EYTs present second-year (Stage 2) yield trials of CIMMYT’s spring bread wheat breeding program in Mexico, each comprising around 1000 entries. Lines were derived from selected bulks in early breeding generations, subsequent head-rows at F4 and individual genotype selections from F5 yield trials. The EYTs were planted annually under multiple contrasting environments at the Norman E. Borlaug Research Station (CENEB) in Ciudad Obregón, Sonora, Mexico, by modulating planting dates and irrigation. Beds under optimal conditions (b5ir) were established on raised beds with optimal irrigation, corresponding to approximately 500 mm of available water applied in five irrigation events, and were sown within the optimal planting window (late-November to mid-December). Flat optimal environments (f5ir) were conducted under flat planting conditions with optimal irrigation (five events) and optimal sowing dates. Intermediate drought conditions (b2ir) involved trials grown on raised beds with partial irrigation, providing approximately 260 mm of available water across two irrigation events, and were sown at the optimal planting time. Severe drought conditions (drt) consisted of trials established on raised beds with approximately 180 mm of available water and optimal sowing dates. For late-heat-stress environments (blht), trials were sown in February, outside the optimal planting window, thereby exposing the crop to terminal heat stress despite optimal irrigation. Early heat stress environments (beht) were sown in October, earlier than the optimal planting period, to impose early-season heat stress, also under optimal irrigation conditions. EYTs were sown, each comprising candidate lines and two high-yielding checks, arranged in an incomplete block alpha-lattice design with two replications. The data used in this study included trial evaluations for grain yield (GY), days to heading (DH), and days to maturity (PM) on a plot basis during the annual winter crop cycles Y18–19, Y19–20, Y20–21, Y21–22, and Y22–23. In addition, EYTs were phenotyped for several diseases in the subsequent summer season, including stem rust (SR), yellow rust (YR), Fusarium head blight (fhb), Septoria tritici blotch (STB), and spot blotch (SB) either in Mexico (mex), Njioro, Kenia (ken) or Ludhiana, India (ind) using standard protocols as described in [16–19]. GY was recorded from two field replicates, while all other agronomic and disease traits were evaluated in a single replicate according to routine CIMMYT breeding protocols.
As reported by [20], the best linear unbiased estimates (BLUEs) for each genotype were estimated using the ASREML-R package via the following mixed linear model:
where yijlk is the observed yield data in different selection environments, μ is the model intercept, gi is the genotypic effect of the ith line, tk is the kth trial effect, rj(k) corresponds to the jth replication effect within the ith trial, bl(kj) is the lth block effect within the kth replication and the ith trial, εijlk is the residual error assumed to be independent and identically distributed (IID) εijlk ~N(0,σε2) .
Broad-sense heritability (H2) was estimated for GY from the variance components as , where is the genotypic variance, is the residual variance, and r is the number of replicates.
Genotyping-By-SequencingGenotyping-by-Sequencing relies on relatively low per-sample cost, high-throughput, next-generation sequencing of genomic subsets targeted by restriction enzymes [6]. The restriction enzymes serve to reduce genome complexity. The approach is simple, quick, without ascertainment bias. By using methylation-sensitive restrictions enzymes, repetitive regions of genomes can be excluded, and lower copy regions targeted [21]. The GBS genotyping across the five evaluated EYTs in this study provided a data matrix of 18,239 SNPs.
DArTag Panel Design and GenotypingFor the DArTag SNP panel design, around 10,000 consensus sequences were compiled across the wheat genome. Sequences were derived from diverse sources and included (1) consensus sequences available from previously designed or published gene-based Kompetitive Allele Specific PCR (KASP) assays tested or used in the CIMMYT Wheat Molecular Breeding Laboratory, (2) tag sequences and published sequences of SNPs significantly identified in previous CIMMYT genome-wide association studies using GBS or the Illumina iSelect 90K array [7] platforms, and (3) tag sequences and published sequences of SNPs distributed across the wheat genome. The sequences underlying the genome-wide distributed SNPs were selected from approximately 12,000 GBS markers available for 46,000 CIMMYT historical elite bread wheat lines genotyped between 2012 and 2019, filtered for a 5% rate of missing values, a minor allele frequency > 0.35, marker clustering, genome position and overall discrimination power. The same filtering criteria were applied to 1102 CIMMYT elite bread wheat lines genotyped with the Illumina iSelect 90K array. Further, 500 consensus sequences from a total of 3000 sequences (provided by E. Akhunov, at Kansas State University, Manhattan, KS, USA) derived from exome sequencing [22] were submitted and approximately 2000 sequences included in the AxiomTM 35K Wheat Breeders Genotyping Array [23]. For the final selection of a set of 3.9K SNPs in the DArTAG panel, the SNP names, source category, the physical position of the SNP on the reference wheat genome IWGSC RefSeq v.1.0 [10] and the consensus sequences are given online (https://excellenceinbreeding.org/toolbox/services/wheat-39k-mid-density-genotyping-services-0).
DArTag technology uses MIPs to target the SNPs selected in the panel. The selected sequences are amplified, and sequenced. All five EYTs were also genotyped with the DArTag platform.
Genomic PredictionThe genotypic data were filtered. Markers with more than 50% missing data and markers with a minor allele frequency lower than 5% were removed. Subsequently, genotypes with more than 50% missing data were also excluded. The remaining missing values were imputed by using random drawing from the possible genotypes of the marker, with probabilities equal to the frequency of each genotype. Finally, markers with more than 10% heterozygous scores were eliminated. The genomic relationship matrix (G) was created using the filtered datasets. The marker matrix X, with individuals in rows and markers in columns, was first centered and scaled. G among individuals was then computed as:
where p is the number of markers retained after filtering for each genotyping platform and year.
Cross-Validation (CV) was used to compare the two genotyping platforms. CV allows multiple predictions with the same dataset by changing the training set (TRN) and test set (TST) with each iteration. CV also provides more data-to-estimate prediction ability and increases the significance of the measures. First, prediction ability was evaluated within each individual EYT cycle using five-fold cross-validation. This analysis was conducted separately for the five cycles Y18–19, Y19–20, Y20–21, Y21–22, and Y22–23. Second, forward prediction scenarios were evaluated by using one year as the TRN to predict the subsequent year as the TST, specifically Y18–19 to predict Y19–20 and Y21–22 to predict Y22–23. Finally, a breeding-program scenario was evaluated by using previous years as the training population to predict the most recent year, Y22–23.
The Genomic Best Linear Unbiased Prediction (GBLUP) model introduced by [24] was used for genomic prediction.
GBLUP has the advantage of relative simplicity, limited computing time, and well-known optimality properties of mixed models for selection, with the formula:
where Y is a vector of phenotypes, X is a design matrix relating the fixed effects of each individual, b is a vector of fixed effects, Z is a design matrix allocating records to genetic values, u is a vector of additive genetic effects for an individual, and e is a vector of random normal deviates with variance σe2. Furthermore, var(u) = Gσu2 where G is the genomic relationship matrix, and σu2 is the genetic variance for this model. The prediction ability was obtained by calculating the Pearson correlation coefficient between the predicted GEBVs and the BLUES for each CV scenario using the two genotyping platforms, GBS and DArTag.
All data filtering, imputation and statistical analyses were carried out using the RStudio vs. 2023.06.2 (2023) software. The FPGC package was used for data filtering and imputation and the BGLR package, to run the predictions [25].
Table 1 summarizes the number of individuals and markers retained after filtering each EYT and genotyping platform. For the DArTag platform, the number of individuals retained ranged from 978 to 1119, with an average of about 1058 individuals per year. The number of DArTag markers retained ranged from 1569 to 1874, averaging 1729 markers across EYT.
For the GBS platform, the number of retained individuals was slightly higher than for the DArTag, ranging from 1008 to 1113, with an average of 1069 individuals per year. In contrast, the number of GBS markers was substantially higher, ranging from 6280 to 9637, with a mean of 8555 markers. As expected, datasets combining multiple years contained larger number of individuals. For example, the Y18–19/Y19–20 CV included 2099 individuals for DArTag and 2098 for GBS. The dataset combining all five years comprised 5316 individuals for DArTag and 5349 individuals for GBS.
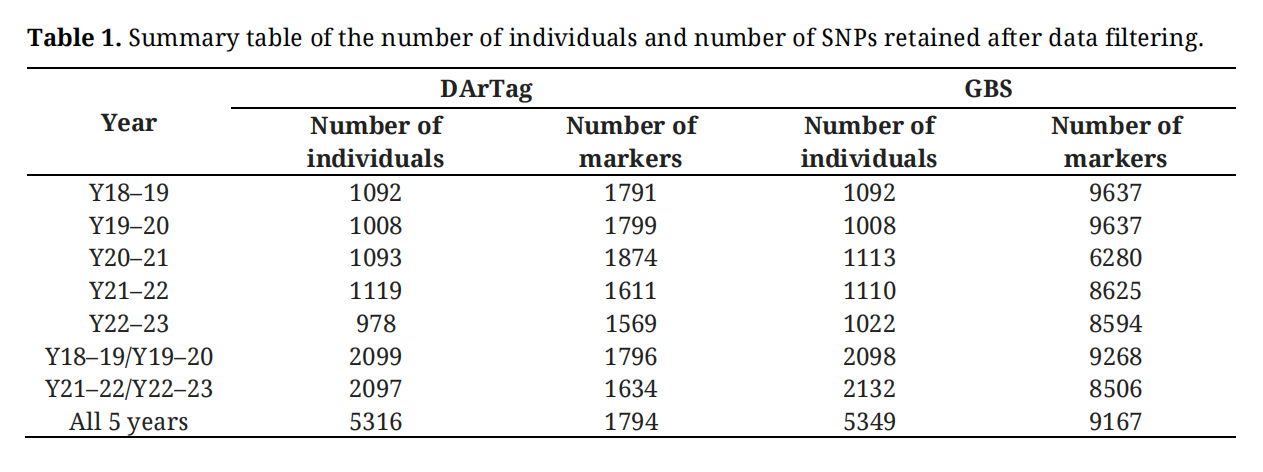 Table 1. Summary table of the number of individuals and number of SNPs retained after data filtering.
Figure 1 presents the results of the Principal Component Analysis (PCA) performed on genotyping data from the five consecutive years of EYT using the GBS platform. The first two principal components, PC1 and PC2, explained 10.44% of the total genetic variation, accounting for 5.96% and 4.48% of the variation, respectively. The PCA plot exhibits a triangular distribution of data points, with each point representing an individual line evaluated in the EYTs. No distinct clustering or separation of lines according to year is evident, as substantial overlap is observed among all five groups. This pattern indicates a high degree of genetic similarity among EYT lines across years and suggests limited population structure within the breeding program. The absence of year-specific clusters is consistent with the continuous recycling of germplasm and the gradual introduction of new genetic variation, resulting in a relatively stable genetic base over time.
Overall, the PCA results reveal that the breeding population has maintained a consistent genetic composition across the five-year period, with no major shifts in population structure. These finding highlights both the genetic continuity of the program and the broad sharing of genetic backgrounds among lines evaluated in different years. Similar clustering patterns were observed for the DArTag dataset (data not shown). This result is consistent with the strong agreement between the genetic relationship matrices derived from the two platforms, which exhibited a Pearson correlation coefficient of 0.843.
Descriptive statistics for all 15 traits evaluated over the five growing cycles are shown in Table S1. Considerable variation among years was observed for most traits. Grain yield showed a wide range of values, with annual means ranging from 2.0 to 8.7 t/ha indicating a strong influence of environmental conditions on yield performance.
Grain yield across testing environments followed consistent patterns throughout the study period. The fully irrigated environment (gy.b5ir) generally produced the highest yields, whereas water-limited environments, including reduced irrigation (gy.b2ir) and drought stress conditions (gy.drt), consistently resulted in lower yield performance. These trends reflect the strong effect of water availability on grain production and demonstrate the contrasting environmental conditions represented in the testing network.
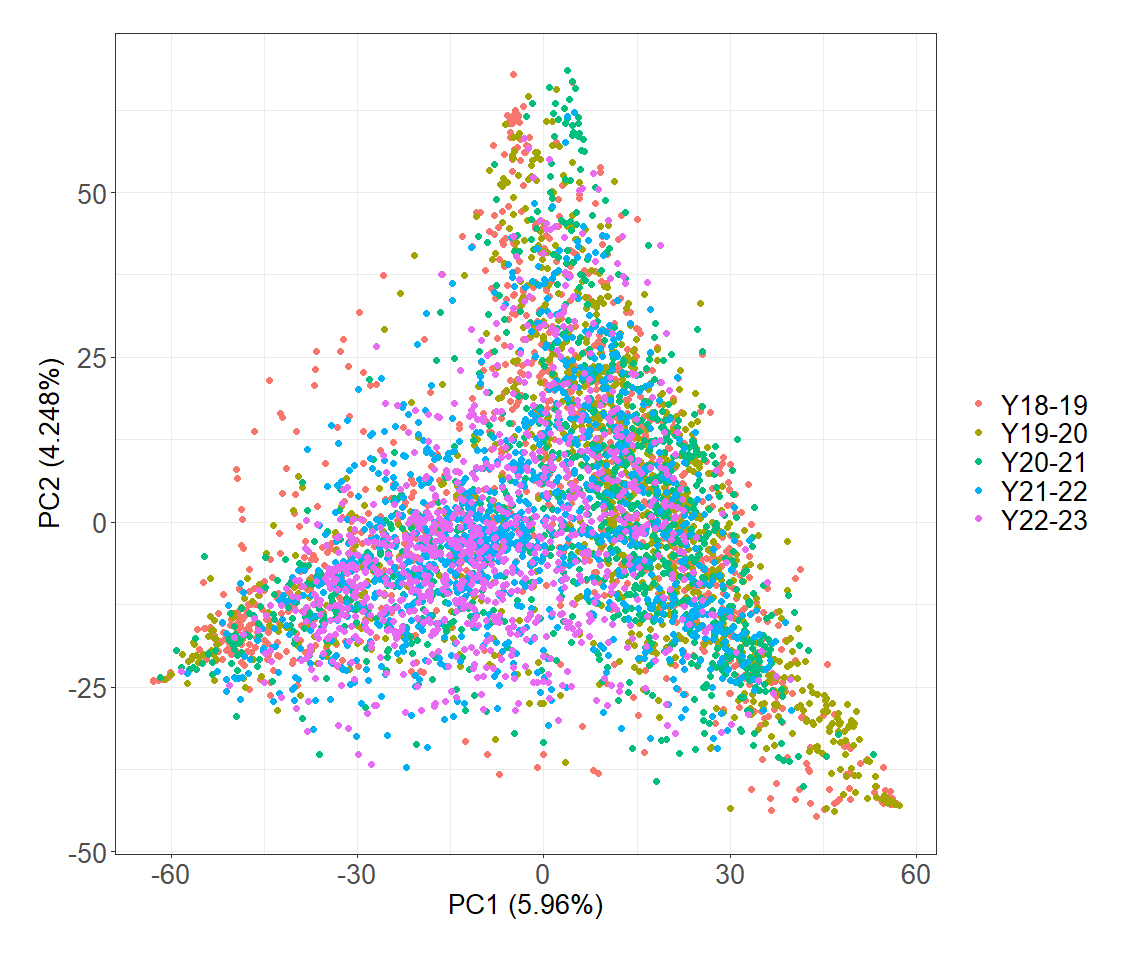 Figure 1.
Principal component analyses of five years of EYTs using GBS markers, PC1: Principal Component 1, PC2: Principal Component 2. Different colors denote the five trial years (Y18–19, Y19–20, Y20–21, Y21–22, and Y22–23).
Figure 1.
Principal component analyses of five years of EYTs using GBS markers, PC1: Principal Component 1, PC2: Principal Component 2. Different colors denote the five trial years (Y18–19, Y19–20, Y20–21, Y21–22, and Y22–23).
Disease resistance traits also showed substantial year-to-year variation. For example, the average stem rust severity in Kenya (sr.ken) ranged from 0.0 to 90.0%, with an overall mean of 26% across years. The Fusarium head blight index (fhb.index) showed particularly pronounced variation, with yearly means ranging from 12.1 to 58.0.
In contrast, phenological traits were relatively stable across years. Days to heading (dh.b5ir) ranged from approximately 78 to 85 days, while days to maturity (pm.b5ir) varied with means between 123 and 131 days.
Comparison of Prediction Abilities between DArTag and GBSPrediction abilities obtained from within-year CV analyses for multiple traits using both the DArTag and GBS genotyping platforms are summarized in Table 2. Prediction abilities ranged from 0.12 to 0.71, depending on the trait and year of evaluation and the genotyping platform. Across most traits, the two platforms produced comparable prediction abilities. Although some pairwise differences between platforms were statistically significant, their magnitude was generally small, and no consistent advantage of either platform was observed across traits, years, or prediction scenarios.
For GY (e.g., gy.b5ir, gy.f5ir, and gy.b2ir), prediction abilities ranged from 0.23 to 0.59. Small significant differences among genotyping platforms were observed in specific cases. For example, in Y21–22, DArTag achieved a significantly higher prediction ability for grain yield under full irrigation (gy.b5ir; 0.38) compared with GBS (0.34). Conversely, in Y18–19, GBS provided significantly higher prediction ability for grain yield under reduced irrigation (gy.b2ir; 0.59) than DArTag (0.53).
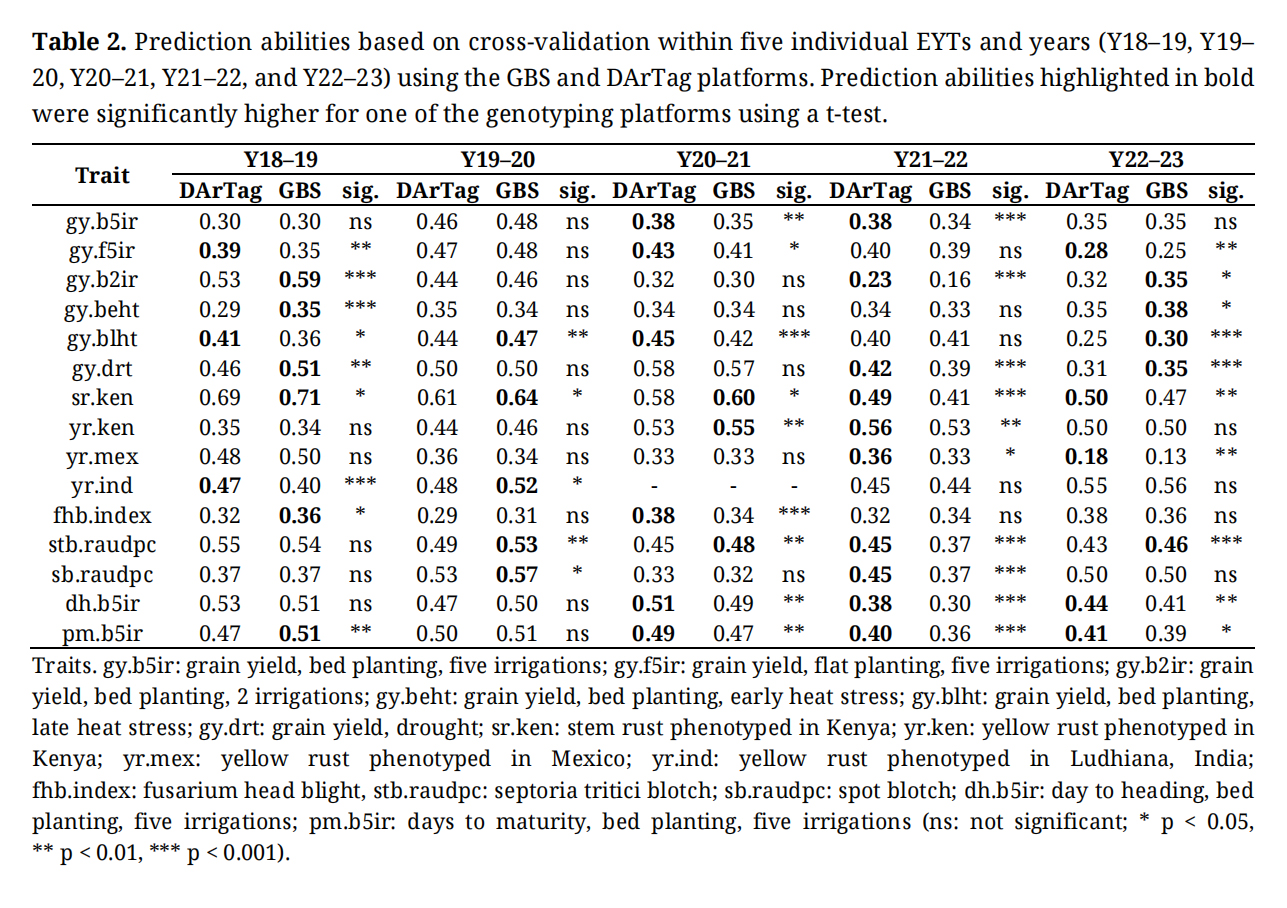 Table 2.
Prediction abilities based on cross-validation within five individual EYTs and years (Y18–19, Y19–20, Y20–21, Y21–22, and Y22–23) using the GBS and DArTag platforms. Prediction abilities highlighted in bold were significantly higher for one of the genotyping platforms using a t-test.
Table 2.
Prediction abilities based on cross-validation within five individual EYTs and years (Y18–19, Y19–20, Y20–21, Y21–22, and Y22–23) using the GBS and DArTag platforms. Prediction abilities highlighted in bold were significantly higher for one of the genotyping platforms using a t-test.
Disease resistance traits showed variable levels of predictability. Prediction abilities for FHB (fhb.index) and SB (sb.raudpc) were generally moderate, ranging from approximately 0.30 to 0.50. In contrast, SR resistance (sr.ken) exhibited some of the highest prediction abilities observed in the study, reaching a maximum of 0.71 for GBS in Y18–19, which was significantly higher than the corresponding value obtained with DArTag (0.69).
Phenological traits, such as PM (pm.b5ir), displayed moderate prediction abilities, typically ranging from 0.40 to 0.50. Significant differences between platforms were detected in some years, particularly in Y18–19 and Y22–23, although no consistent advantage of either platform was evident.
Overall, the significance and magnitude of differences between platforms varied according to the trait and year of evaluation, with no clear or consistent pattern across datasets.
These results suggest that the relative performance of DArTag and GBS is influenced by the genetic architecture of individual traits and the environmental conditions of a given year. Despite its substantially lower marker density, DArTag generally achieved prediction abilities comparable to those obtained with the higher-density GBS platform, demonstrating its suitability for genomic prediction.
Figure 2 illustrates the prediction abilities obtained with the DArTag and GBS platforms for the 15 traits, using the previous year as TRN to predict the next year, and the four previous years to predict the last year. Prediction abilities varied considerably depending on the traits and year.
From a breeding perspective, agreement in the ranking of breeding lines is more important than small differences in prediction ability. Therefore, correlations between GEBVs predicted using the GBS and DArTag genotyping platforms for all 15 traits were evaluated and are presented in Figure 3. These GEBVs were obtained from the forward prediction scenario in which lines from all four previous years (Y18–19 to Y21–22) were used as TRN and lines from Y22–23 served as TST. Each subplot corresponds to a different trait. Correlation coefficients between GEBVs derived from the two platforms were consistently high, ranging from 0.59 to 0.78, with all correlations being highly significant (p < 2.2 × 10⁻¹⁶). Correlation coefficients between GEBVs derived from forward prediction scenarios using one year as the TRN to predict the subsequent year as the TST were even higher ranging from 0.79 to 0.88 (data not shown). These results demonstrate a strong level of agreement between the GEBVs generated by the GBS and DArTag platforms and indicate that both platforms produced highly similar rankings of breeding lines. The consistently high correlations observed across all traits—including highly quantitative traits such as GY and disease resistance—highlight the robustness and consistency of both genotyping platforms for genomic prediction. Overall, these findings suggest that the lower-density DArTag platform captures much of the same predictive information as the higher-density GBS platform, resulting in highly comparable selection decisions. From a breeding perspective, this high concordance indicates that selection rankings based on DArTag would be highly similar to those obtained using GBS, despite the lower marker density of the DArTag platform.
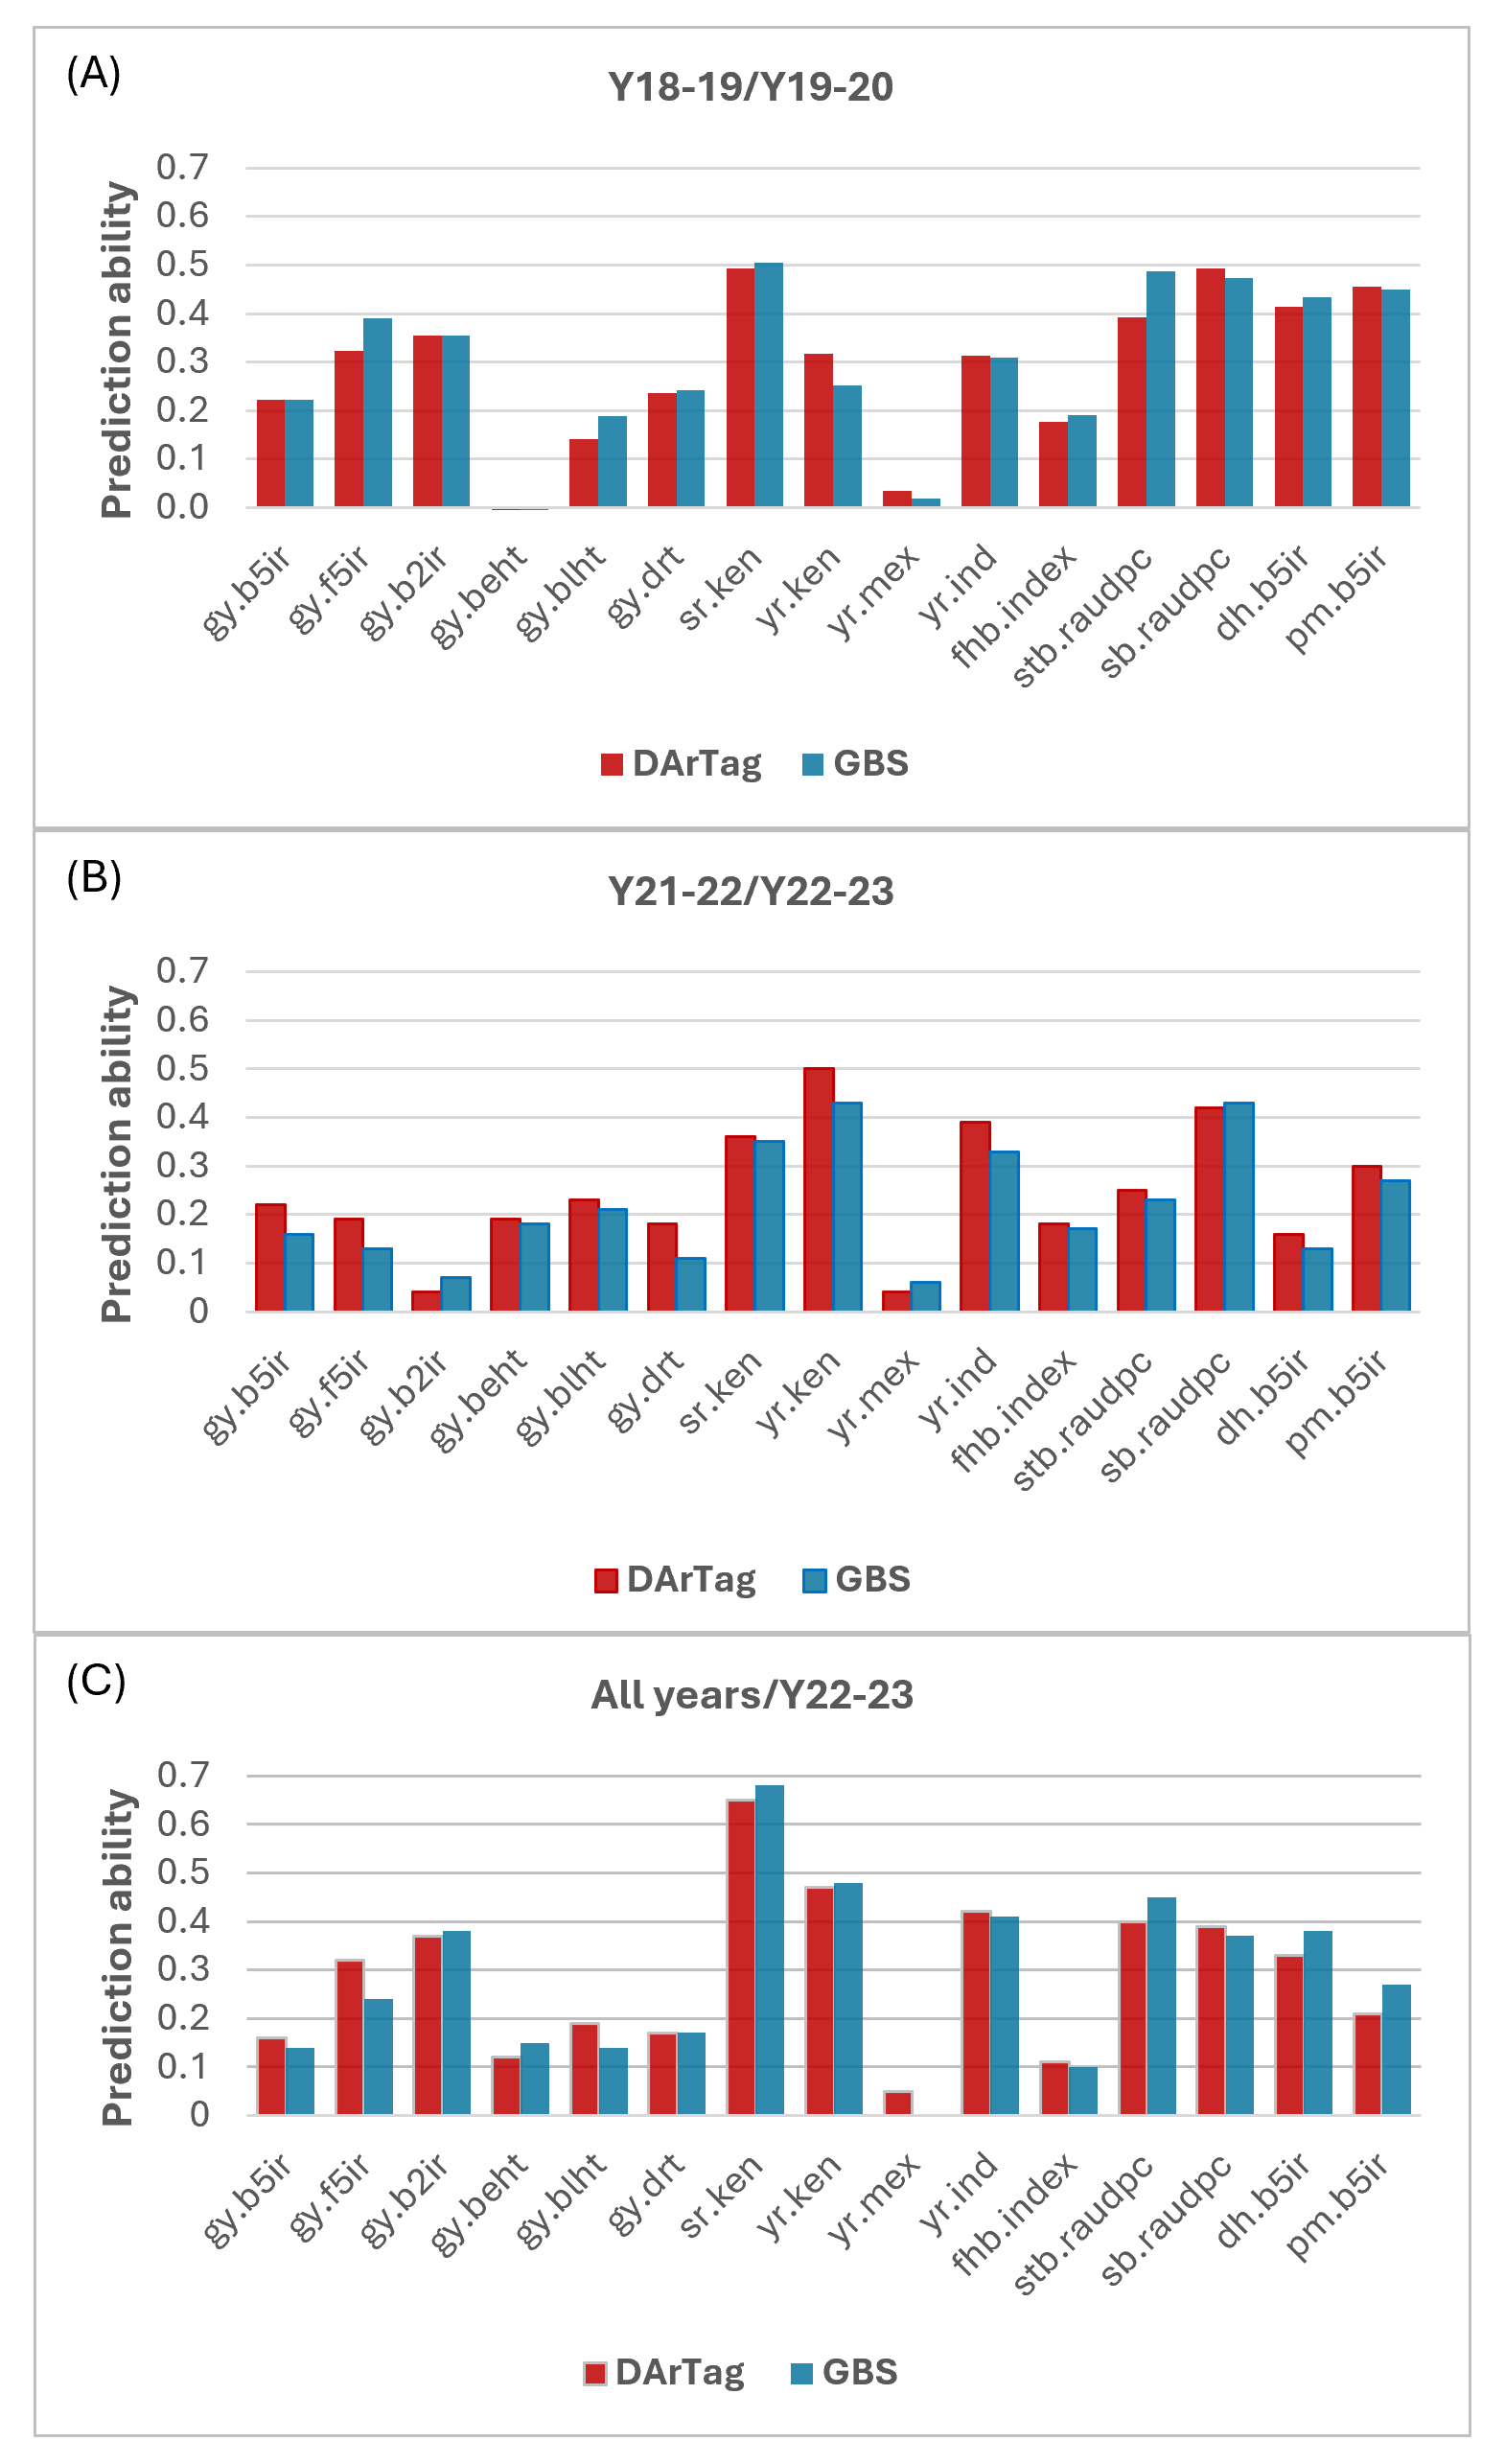 Figure 2.
Prediction abilities for 15 traits using the GBS and DArTag platforms with (A) the cycle Y18–19 in the TRN to predict Y19–20, (B) the cycle Y21–22 in the TRN to predict Y22–23 and (C) the cycles Y18–19 to Y21–22 in the TRN to predict Y22–23. Trait abbreviations are described in Table 2.
Figure 2.
Prediction abilities for 15 traits using the GBS and DArTag platforms with (A) the cycle Y18–19 in the TRN to predict Y19–20, (B) the cycle Y21–22 in the TRN to predict Y22–23 and (C) the cycles Y18–19 to Y21–22 in the TRN to predict Y22–23. Trait abbreviations are described in Table 2.
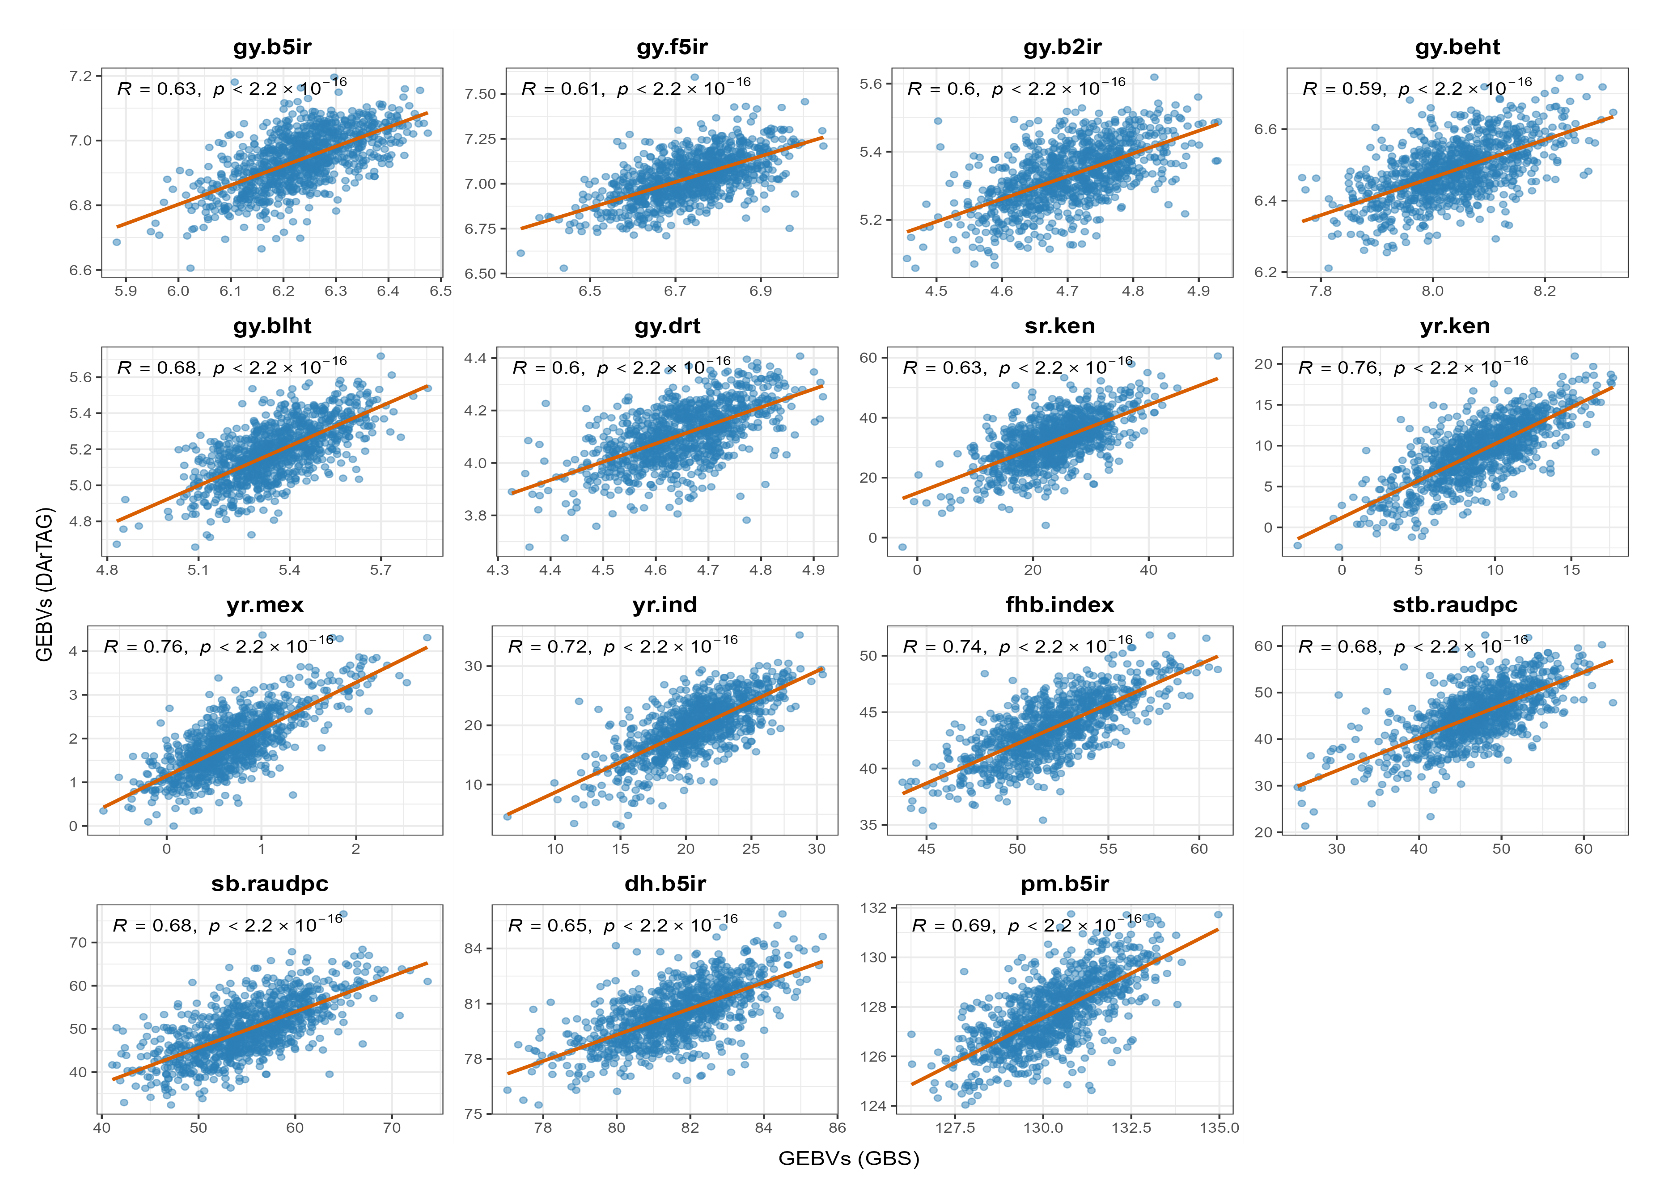 Figure 3.
Correlation between GEBVs predicted with the DArTag and GBS platform for cycle Y18–19 as TRN and Y19–20 as TST. Trait abbreviations are described in Table 2.
Figure 3.
Correlation between GEBVs predicted with the DArTag and GBS platform for cycle Y18–19 as TRN and Y19–20 as TST. Trait abbreviations are described in Table 2.
We additionally plotted the marker density along wheat chromosomes for both GBS and DArTag platforms, before and after filtering (Figure 4). The figure is divided into four panels, Figure 4A,B show the pre-filtering density for GBS and DArTag respectively, while C and D display the post-filtering density. Before filtering, our GBS dataset included 18,239 SNP (Figure 4A) and the DArTag dataset 3898 SNPs (Figure 4B). The distribution of markers appears relatively uniform across all chromosomes for both platforms, with an expected higher density of SNPs towards the telomers. After filtering, the number of markers was reduced to an average of 9167 SNP for the GBS (Figure 4C) and 1791 SNPs for the DArTag platform (Figure 4D). After filtering, both platforms retained genome-wide marker coverage with broadly comparable chromosomal distributions. This retained genome-wide coverage, together with the long-range LD and strong realized genomic relationships present in elite wheat germplasm, likely contributed to the similar genomic relationship structures and prediction abilities observed across platforms. This comparable marker coverage across the genome likely explains the equal levels of prediction abilities across platforms despite their difference in marker technology and density.
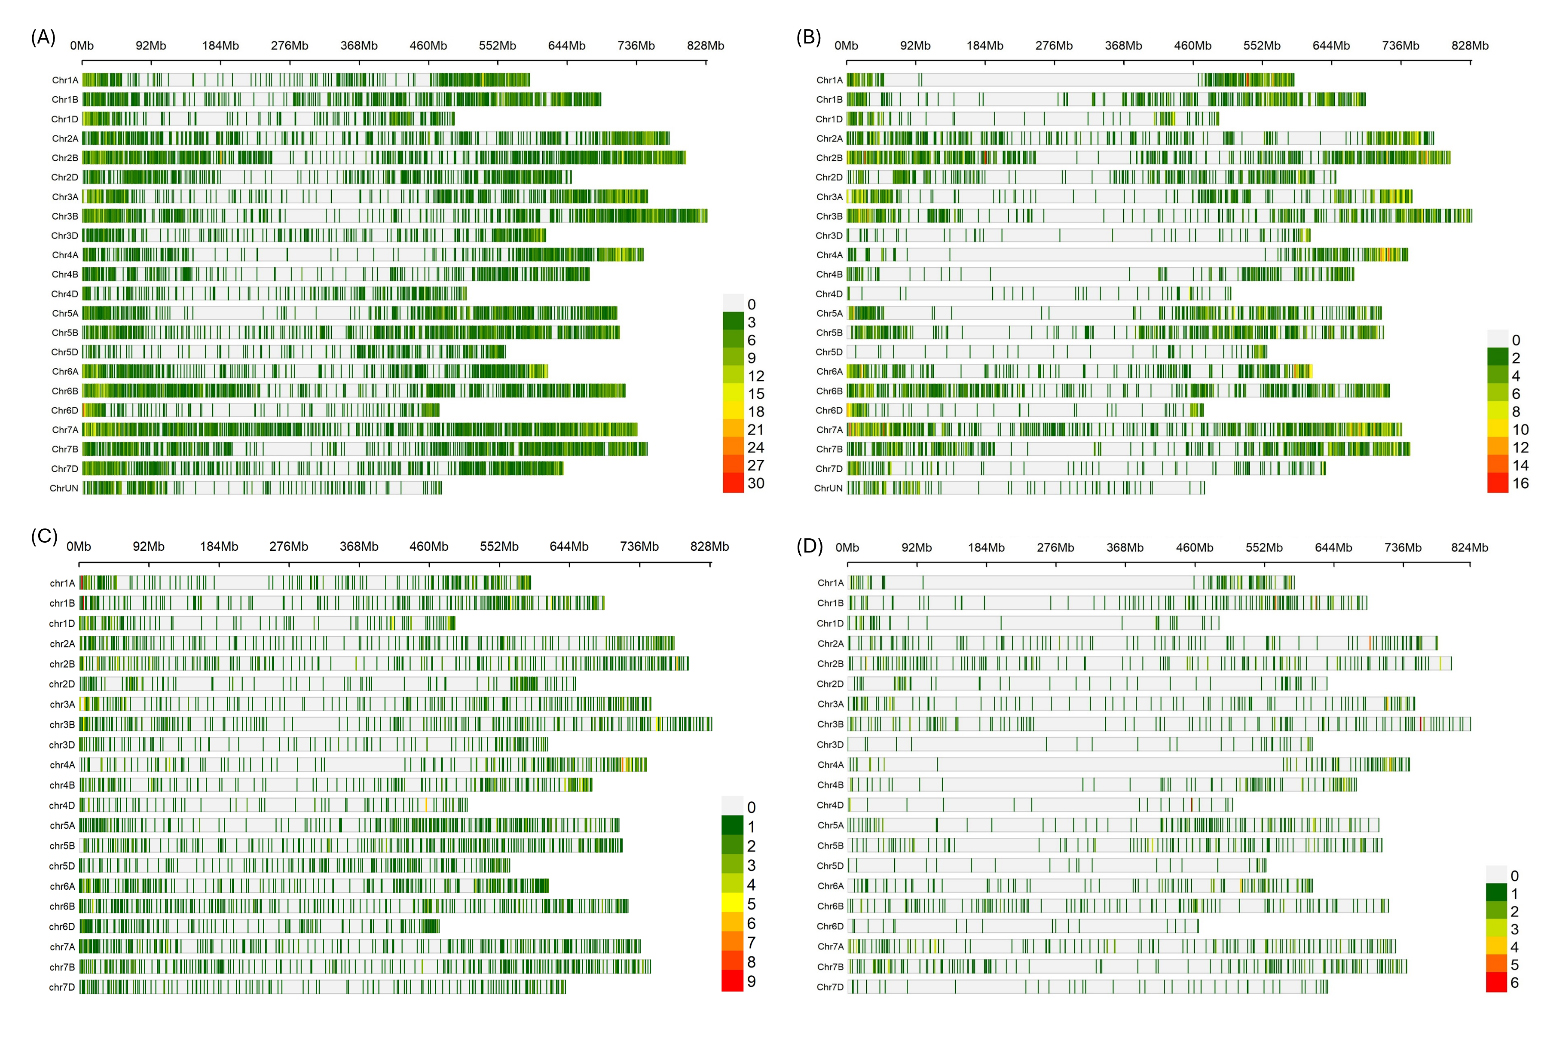 Figure 4. Marker density plot for the GBS and DArTag platforms, (A,B) before filtering, (C,D) after filtering.
The present study demonstrates that the public mid-density DArTag genotyping platform (Wheat DArTag 3.9K EIB 2.0) can achieve genomic prediction accuracies comparable to those obtained with a substantially higher-density GBS platform across a wide range of agronomic, phenological, and disease resistance traits in CIMMYT elite spring wheat germplasm. Despite the large difference in marker number after filtering (approximately 1600–1800 SNPs for DArTag versus 6500–9700 SNPs for GBS), prediction abilities across traits and environments were remarkably similar. More importantly, GEBVs derived from the two platforms exhibited consistently high correlations across all evaluated traits, indicating strong agreement in the ranking of breeding lines. These results suggest that both platforms capture largely the same genetic signal relevant for selection, leading to highly comparable breeding decisions despite substantial differences in marker density. Thus, the practical value of the DArTag platform lies not only in producing similar prediction abilities, but also in generating highly concordant GEBV rankings, which are the direct basis of selection decisions in breeding programs.
These results support the growing body of evidence suggesting that, in elite breeding populations, genomic prediction accuracy often reaches a plateau once sufficient genome-wide marker coverage is achieved [8,9]. In such populations, prediction accuracy depends less on maximizing marker density and more on adequately capturing realized genomic relationships and LD between markers and QTL. Similar observations have previously been reported in wheat demonstrating that genomic prediction abilities could be maintained with relatively smaller subsets of informative markers [12].
Bread wheat is a predominantly self-pollinating species characterized by relatively long-range linkage disequilibrium (LD). For example, the extent of LD has been estimated to be approximately fourfold greater in U.S. and CIMMYT wheat germplasm than in populations of cultivated spring and winter barley [26]. In previous CIMMYT EYTs, the average LD decay has been estimated at approximately 2 Mb [27]. Although CIMMYT elite germplasm represents a genetically diverse breeding population, recurrent selection and the continued recycling of elite parents maintain strong realized genomic relationships and sufficiently extensive LD, making medium-density marker platforms well suited for genomic prediction. Collectively, these studies indicate that optimized medium-density genotyping platforms may provide an economically efficient balance between prediction performance and operational cost in GS programs.
An important biological explanation for the comparable performance of DArTag and GBS platforms lies in the genetic structure of CIMMYT elite wheat germplasm. Bread wheat is a predominantly self-pollinating species characterized by extensive LD and large haplotype blocks [26,28]. Under these conditions, moderate marker densities may already capture a substantial portion of genome-wide genetic covariance among individuals. Consequently, increasing marker density beyond a certain threshold may provide limited additional benefit for genomic prediction, particularly when breeding populations are closely related. This interpretation is strongly supported by the principal component analysis presented in Figure 1, which revealed substantial overlap among the five years of EYTs. The absence of strong year-specific genetic structure suggests a relatively stable breeding population with consistent genomic relationships across cycles. Such continuity is expected in recurrent elite breeding pipelines where favorable haplotypes are gradually recycled and recombined over time. Consequently, genomic relationship matrices constructed from moderate-density markers can closely approximate those generated from high-density platforms.
Indeed, one of the most important findings of this study was the strong concordance between genomic relationship structures derived from DArTag and GBS. We observed high correlations between genomic relationship matrices and between GEBVs predicted using both platforms. Under GBLUP, prediction accuracy fundamentally depends on the ability of the genomic relationship matrix to accurately represent realized genetic covariance among individuals [24]. Therefore, if two marker platforms produce similar genomic relationship structures, similar prediction accuracy is expected even when marker densities differ substantially. From this perspective, the present results suggest that the DArTag platform effectively captures the major components of the genomic covariance structure of the elite wheat population.
Targeted Sequencing Platforms as a Scalable and Modular Platform for Public Wheat BreedingThe DArTag platform offers several practical advantages beyond genomic prediction alone. As part of the CGIAR EIB initiative, the Wheat DArTag 3.9K EIB 2.0 panel was designed as a modular targeted genotyping system integrating genome-wide SNPs together with gene-based and trait-associated markers relevant to wheat improvement. This design provides substantial flexibility for breeding applications because the platform can simultaneously support genomic prediction, marker-assisted selection, variety identification, fingerprinting, and quality control.
The modularity of DArTag technology has also been demonstrated in other polyploid crops, including potato and strawberry [13,14]. These studies emphasized the importance of selecting subgenome-specific markers and minimizing interference from homeologous regions in complex polyploid genomes. In the present study, a substantial proportion of markers included in the Wheat DArTag 3.9K EIB 2.0 panel were excluded during quality filtering because they lacked sufficient subgenome specificity. These markers are expected to be replaced with improved assays in the planned Version 3.0 of the panel. An additional operational advantage of targeted genotyping platforms is their adaptability. Unlike fixed SNP arrays, targeted platforms can be continuously refined by replacing poorly performing markers and incorporating newly identified trait-associated loci as breeding priorities evolve. In the present study, quality filtering removed a substantial proportion of markers from both the GBS and DArTag datasets. In addition to issues related to subgenome specificity, several other factors likely contributed to marker exclusion, including low minor allele frequency, excessive missing data, inconsistent amplification, and sequencing artifacts. Nevertheless, after filtering, both platforms retained broadly similar genome-wide marker distributions. This finding suggests that the retained DArTag markers captured the major haplotype structure of the breeding population, thereby preserving the genetic information required for accurate genomic prediction despite the substantially lower marker density relative to GBS.
To further improve the cost-effectiveness of genotyping by increasing the proportion of high-quality data generated per sample, an updated SNP panel should incorporate additional genome- and subgenome-specific markers with improved assay performance, higher call rates, to reach a balanced genome coverage, while retaining the current highly informative SNPs for genomic prediction, and adding the latest gene targets relevant to breeders. These improvements are expected to increase the overall proportion of high-quality markers passing quality control, reduce marker attrition, and further enhance the robustness and efficiency of routine genotyping for wheat breeding applications.
Implications for Genomic Selection Implementation in Public Breeding ProgramsOne of the major barriers to large-scale implementation of genomic selection in public breeding programs remains genotyping cost. Public-sector programs often evaluate thousands to tens of thousands of lines annually, making high-density genotyping economically difficult, particularly in developing countries. Although sequencing costs continue to decline, the cumulative cost of routine genomic prediction remains substantial when applied at breeding-program scale.
The present results demonstrate that substantial cost reductions may be achieved in wheat without major losses in prediction accuracy. The DArTag platform provides a considerably lower per-sample cost than high-density GBS or SNP-array technologies while maintaining similar prediction performance across a broad range of traits and environments. At present, the DArTAG panel costs approximately US$12 per sample, including DNA extraction, targeted sequencing and SNP calling and does not require larger high-throughput computing (HTC) infrastructure or specialized bioinformatics pipelines for SNP calling and data management. In contrast, GBS and SNP array platforms typically require access to HTC resources and specialized analysis software, resulting in per-sample costs exceeding US$20. In addition, the DArTag workflow typically delivers genotyping results within approximately three weeks, whereas turnaround times for GBS and SNP array platforms are more variable and depend on the service provider, availability of computing infrastructure, bioinformatics pipelines, and staff capacity for data processing and analysis. The reduction in genotyping cost can substantially increase the feasibility of implementing routine genomic selection within operational breeding pipelines. In operational breeding programs, the economic advantage of a lower-cost platform may be expressed not only as reduced total genotyping expenditure, but also as the possibility of genotyping larger numbers of candidates, increasing training population size, and improving connectedness across breeding cycles.
Several other mid-density genotyping/targeted sequencing platforms are now available for crop breeding, typically targeting 1000–5000 SNPs and bridging the gap between low-density marker assays and high-density sequencing approaches. Other technologies, such as AgriSeq (Thermo Fischer Scientific, Waltham, MA, USA), Flex-Seq (LGC Biosearch Technologies, Hoddesdon, UK) and Plex-Seq (Agriplex Genomics, Cleveland, OH, USA) provide additional cost-effective and relatively rapid genotyping solutions. While these platforms differ in marker chemistry, assay design, and analytical workflows, they share the objective of delivering sufficient marker density for routine breeding applications at substantially lower cost (with an ongoing downward trend in per-sample sequencing cost) than high-density genotyping technologies. Since only DArTag was evaluated in the present study, no direct comparison among these platforms could be undertaken.
Importantly, the value of cost-effective genotyping extends beyond economics alone. Reduced genotyping costs enable breeders to increase training population size, improve population connectivity across years, and genotype earlier-generation materials at larger scale. These factors may ultimately contribute more to long-term genetic gain than marginal increases in marker density. In many breeding scenarios, expanding the number of individuals evaluated genomically may provide greater benefits than increasing the number of markers per individual. The results also reinforce the idea that optimal genotyping strategies depend on breeding context. In more diverse germplasm panels, landraces, wild relatives, or populations with rapid LD decay, higher marker densities may still be advantageous. However, in elite breeding populations characterized by strong relatedness and long-range LD, medium-density platforms may already capture most of the useful genomic information required for accurate prediction. Consequently, breeding programs should evaluate marker density not as an absolute objective, but in relation to the genetic structure and operational goals of the target population.
Trait- and Environment-Dependent Variability in Genomic PredictionAlthough overall prediction performance was highly comparable between platforms, prediction abilities varied substantially across traits and environments. Our study encompassed a broad range of target environments representative of the CIMMYT wheat breeding program, including optimal irrigation, reduced irrigation, severe drought, early heat, and late heat stress environments in Mexico, as well as disease evaluation trials conducted in Mexico, Kenya, and India. This diversity of testing environments enabled a robust comparison of the two genotyping platforms across contrasting abiotic and biotic stress conditions. The consistent prediction performance observed across these environments demonstrates the operational robustness of both platforms for genomic selection within the CIMMYT elite wheat breeding pipeline. However, as with any genomic prediction approach, prediction accuracy remains dependent on the genetic architecture of the trait, environmental conditions, the genetic relatedness between training and testing populations, and the magnitude of genotype-by-environment interactions.
Grain yield under stress environments generally showed lower prediction accuracies than phenological traits such as days to heading and maturity. These differences are expected because grain yield is a highly complex trait strongly affected by environmental variation and genotype-by-environment interaction (G × E), whereas phenological traits are often more heritable and genetically stable across environments.
Disease resistance traits also exhibited heterogeneous prediction performance. Some traits, such as stem rust resistance, showed relatively high prediction abilities, whereas others displayed more moderate values. These differences likely reflect variation in underlying genetic architecture, including the relative contributions of major genes, oligogenic effects, and polygenic background variation. The incorporation of gene-based and QTL-associated markers within the DArTag platform may provide additional advantages for traits influenced by major resistance loci, although this aspect was not explicitly evaluated in the present study.
Importantly, no single platform consistently outperformed the other across all traits or years. This lack of systematic superiority further supports the conclusion that both platforms captured largely equivalent genomic information for prediction within the evaluated germplasm.
Future Perspectives for Optimized Genomic Prediction PlatformsThe present study highlights the potential of optimized medium-density genotyping platforms as scalable and cost-effective solutions for implementing genomic selection in wheat breeding programs. As targeted sequencing technologies continue to advance and become more widely adopted, genotyping costs are expected to decrease further, thereby increasing their accessibility for routine breeding applications. Nevertheless, additional opportunities remain to enhance prediction efficiency and maximize the value of genomic information. Future research should investigate trait-specific marker optimization strategies, the integration of functional and diagnostic markers, and dynamic panel-updating approaches that allow marker composition to evolve alongside changes in breeding populations and selection objectives [29]. Such developments could further improve the accuracy, flexibility, and long-term utility of targeted genotyping platforms for genomics-assisted crop improvement.
In addition, future genomic prediction systems will likely integrate multiple layers of biological information beyond genome-wide markers alone. Environmental covariables, high-throughput phenotyping, physiological traits or multi-omics data are increasingly being incorporated into multimodal genomic prediction frameworks [2,30]. Under such scenarios, the relative importance of ultra-high marker density may decline further because predictive performance may increasingly depend on integrated biological representation rather than solely on marker abundance.
The results presented here therefore support a broader conceptual shift in genomic selection implementation. Rather than maximizing marker density indiscriminately, breeding programs may benefit more from identifying optimized combinations of marker quality, genome coverage, training population design, and operational scalability.
In conclusion, the public Wheat DArTag 3.9K EIB 2.0 panel provides an effective and economically scalable solution for genomic selection in elite wheat breeding populations. Despite containing substantially fewer markers than GBS, the platform maintained highly comparable genomic prediction performance across multiple years, environments, and traits. These results indicate that, in elite wheat germplasm characterized by extended LD and strong realized genomic relationships, moderate-density targeted genotyping platforms can capture most of the predictive information required for effective genomic selection. The conclusions of this study apply primarily to elite CIMMYT spring wheat germplasm, where relatedness among breeding lines and long-range LD favor the use of medium-density marker platforms. In more diverse germplasm panels, higher marker density may still provide additional benefits. Beyond genomic prediction, the modular design of DArTag offers important advantages for integrated molecular breeding applications, including marker-assisted selection, fingerprinting, and quality control. The ability to continuously update targeted marker panels as breeding priorities evolve further enhances the long-term value of this technology. Overall, these results demonstrate that optimized medium-density targeted genotyping platforms, such as Wheat DArTag 3.9K EIB 2.0, provide a practical pathway for expanding genomic selection in public wheat breeding programs, particularly where genotyping cost, throughput, and scalability are critical considerations.
The following supplementary materials are available online, Table S1: Descriptive statistics of all traits evaluated across five crop cycles (Y18–19, Y19–20, Y20–21, Y21–22, Y22–23).
The dataset of the study is available from the authors upon reasonable request.
Conceptualization, SD, PV, and JC; methodology, PV; formal analysis, PJ; resources, NEH.; data curation, AK and LACH; writing—original draft preparation, PJ and SD; writing—review and editing, SD, PV and JC; All authors have read and agreed to the published version of the manuscript.
The authors declare that they have no conflicts of interest.
This research was funded by the Bill and Melinda Gates Foundation (BMGF) and the UK Foreign, Commonwealth and Development Office (FCDO; formerly UK aid from the UK Government’s Department for International Development, DFID) for supporting CIMMYT’s wheat breeding activities through the Accelerating Genetic Gains in Maize and Wheat (AGG) project (INV-003439).
We thank all CIMMYT scientific and technical staff as well as national partners (India and Kenya) for their support in generating the genotyping and phenotyping data.
1.
2.
3.
4.
5.
6.
7.
8.
9.
10.
11.
12.
13.
14.
15.
16.
17.
18.
19.
20.
21.
22.
23.
24.
25.
26.
27.
28.
29.
30.
Dreisigacker S, Vitale P, Judon P, Crespo Herrera LA, Kilian A, Eng Hwa N, et al. A Public Mid-Density Genotyping Platform for Genomic Selection in Wheat. Crop Breed Genet Genom. 2026;8(3):e260018. https://doi.org/10.20900/cbgg20260018.

Copyright © Hapres Co., Ltd. Privacy Policy | Terms and Conditions


