Location: Home >> Detail
J Sustain Res. 2024;6(2):e2400010. https://doi.org/10.20900/jsr20240010

1 School of Engineering, Polytechnic Institute of Porto, Porto 4200-465, Portugal
2 Center for Innovation in Engineering and Industrial Technology (CIETI), Polytechnic Institute of Porto, Porto 4249-015, Portugal
3 Research Center in Business and Economics (CICEE), Universidade Autónoma de Lisboa, Lisbon 1169-023, Portugal
4 Higher Institute of Business and Tourism Sciences, Porto 4050-180, Portugal
* Correspondence: José Magano.
The island of Graciosa in the Azores faces unique energy challenges due to its remote location and reliance on imported diesel fuel. As a result, a hybrid energy system has been implemented that combines wind and solar energy with energy storage and diesel generators. This article examines the expansion of the island’s hybrid energy system, by simulating four alternative scalable scenarios that take into account expected technological advances over the next 20 years, including technologies such as biomass and hydrogen. Homer Pro and PVSyst software were used for optimizing the design of the stand-alone hybrid renewable energy system, with the aim of achieving cost-effective configurations and optimizing production, storage, and power grid management. Four simulations were performed to evaluate the expansion scenarios, namely in terms of configurations, component sizing, and economic feasibility. The results show that the most balanced, cost-effective scenario is the one that combines all the energy sources considered: photovoltaic, wind, biomass, battery storage, and hydrogen. The originality of this study lies in the scenario comparison methodology used to evaluate the viability and expansion of a hybrid energy system using modern renewable energy production technologies adapted to the specific insular conditions of Graciosa Island, assessing the economic impact and taking into account the imperative of energy security. This paper provides valuable insights into the potential and challenges of hybrid energy systems on the island of Graciosa and is instrumental for projects alike in similar remote regions.
Islands are stand-alone electrical systems that face challenges in providing reliable and sustainable energy. Isolated from mainland grids, these regions rely heavily on imported fossil fuels, resulting in high energy costs and environmental concerns, and making them particularly vulnerable to energy supply disruptions [1].
In recent years, pursuing sustainable and resilient energy solutions in such locations has led to a surge in research and innovative approaches to hybrid energy systems [2–4]. The concept of a hybrid energy system involves the integration of multiple energy sources, such as solar, wind, and hydro, with conventional energy sources like thermal power plants and energy storage technologies to form an integrated and optimized energy network [5,6]. This integration aims to create a balanced and efficient energy mix that can meet the energy demands of the island’s population while reducing dependence on fossil fuels. By integrating energy storage systems into island hybrid systems, one can improve grid stability and availability, especially in the face of intermittent renewable energy sources and sudden spikes in energy demand [6].
The literature covers a wide range of hybrid energy system configurations and technologies that integrate various renewable energy sources, energy storage systems, and smart grid technologies [7,8]. Through intelligent integration and appropriate equipment identification, hybrid systems offer the potential to optimize energy production, thereby increasing the system energy reliability while reducing overall costs [9].
Several scholars make a compelling case for the pressing need to study the sizing and implementation of hybrid energy systems on islands, a topic of increasing relevance given the unique challenges and opportunities these regions face [1,3–6,10–13]. Stenzel et al. [10] explore this by examining the environmental impacts of renewable energy deployment on Graciosa Island, highlighting the need for sustainable energy transitions. Similarly, Silva et al. [12] focus on the Azores, considering energy storage as a critical component to increase renewable energy penetration and emphasizing the importance of flexibility in isolated grids. Lian et al. [11] provide a foundational understanding by reviewing sizing methodologies for hybrid systems, an effort that is critical for optimizing the mix of renewables and ensuring energy security and efficiency. Babaei et al. [4] further this conversation with a case study on Pelee Island, exploring the feasibility of integrating different battery technologies with stand-alone systems, highlighting the importance of customized energy solutions. Similarly, Hardjono et al. [6] articulate the interconnectedness of renewable energy systems with economic zones on Sebira Island, pushing the boundaries of linking energy sustainability with economic development.
On the topic of energy security, Lal and Kumar [3] assess small Pacific island states, where the call for renewable energy penetration is driven by the urgent need for self-sufficiency and resilience to external energy shocks. This thread of self-sufficiency is woven through Melo et al.’s [13] study of the Azores archipelago, where the use of photovoltaics and wind energy is posited as a cornerstone for long-term sustainability. Singh et al. [5] provide practical insights into the electrification of Kavaratti, Lakshadweep, by determining the optimal size and location of renewable installations, highlighting the role of strategic planning in renewable integration. Xu et al. [1] focus on the concept of energy export strategies for islands, investigating whether hydrogen or electricity is a more viable pathway for energy trade, thus demonstrating the potential for islands to contribute to global energy markets.
The aforementioned research provides diverse insights into the design and implementation of hybrid energy systems on islands. Stenzel et al. [10] provide a comprehensive life cycle assessment for the island of Graciosa, demonstrating the significant environmental benefits of transitioning to renewable energy, while acknowledging the significant material and energy inputs required for system construction. Silva et al. [12] highlight the central role of energy storage systems in the Azores, which increase grid flexibility and enable greater integration of renewable energy, but also pose challenges in terms of cost and maintenance. Lian et al. [12] analyze the various methodologies used to size hybrid renewable energy systems, suggesting that a mix of conventional and innovative approaches can lead to optimized systems. However, they caution that these methodologies must contend with the dynamic nature of island energy needs and resource availability. Babaei et al. [4] explore the feasibility of implementing hybrid systems on Pelee Island, highlighting the technical potential and economic viability, particularly when using lithium-ion batteries, although they note that the success of such systems depends on accurate demand forecasting and technological adaptability.
Hardjono et al. [6] present a novel approach on Sebira Island that integrates renewable energy systems with productive economic zones. This approach promises both energy and economic sustainability, although it relies heavily on external funding and policy support. Lal and Kumar [3] review energy security in small Pacific islands and find that despite robust renewable energy potential, these countries often struggle to implement effective policies and attract the investment needed for significant infrastructure changes. Melo et al. [13] assess the Azores archipelago’s potential for solar PV, wind, and storage, finding that such systems could meet a significant portion of energy demand and contribute to economic savings, despite high initial costs and complex logistics. Singh et al. [5] explore the optimization of renewable installations in Kavaratti, highlighting the careful balancing act required to match energy production with consumption patterns within the constraints imposed by geographic isolation. Xu et al. [1] consider the global role of islands in renewable energy exports, weighing the merits of hydrogen versus electricity exports. They suggest that islands could become renewable energy hubs, but this would require overcoming technological hurdles and building substantial infrastructure. In Table 1 we present a consolidated view of the aforementioned studies related to renewable energy systems and policies in island settings, highlighting their objectives, methodologies, findings, and limitations.
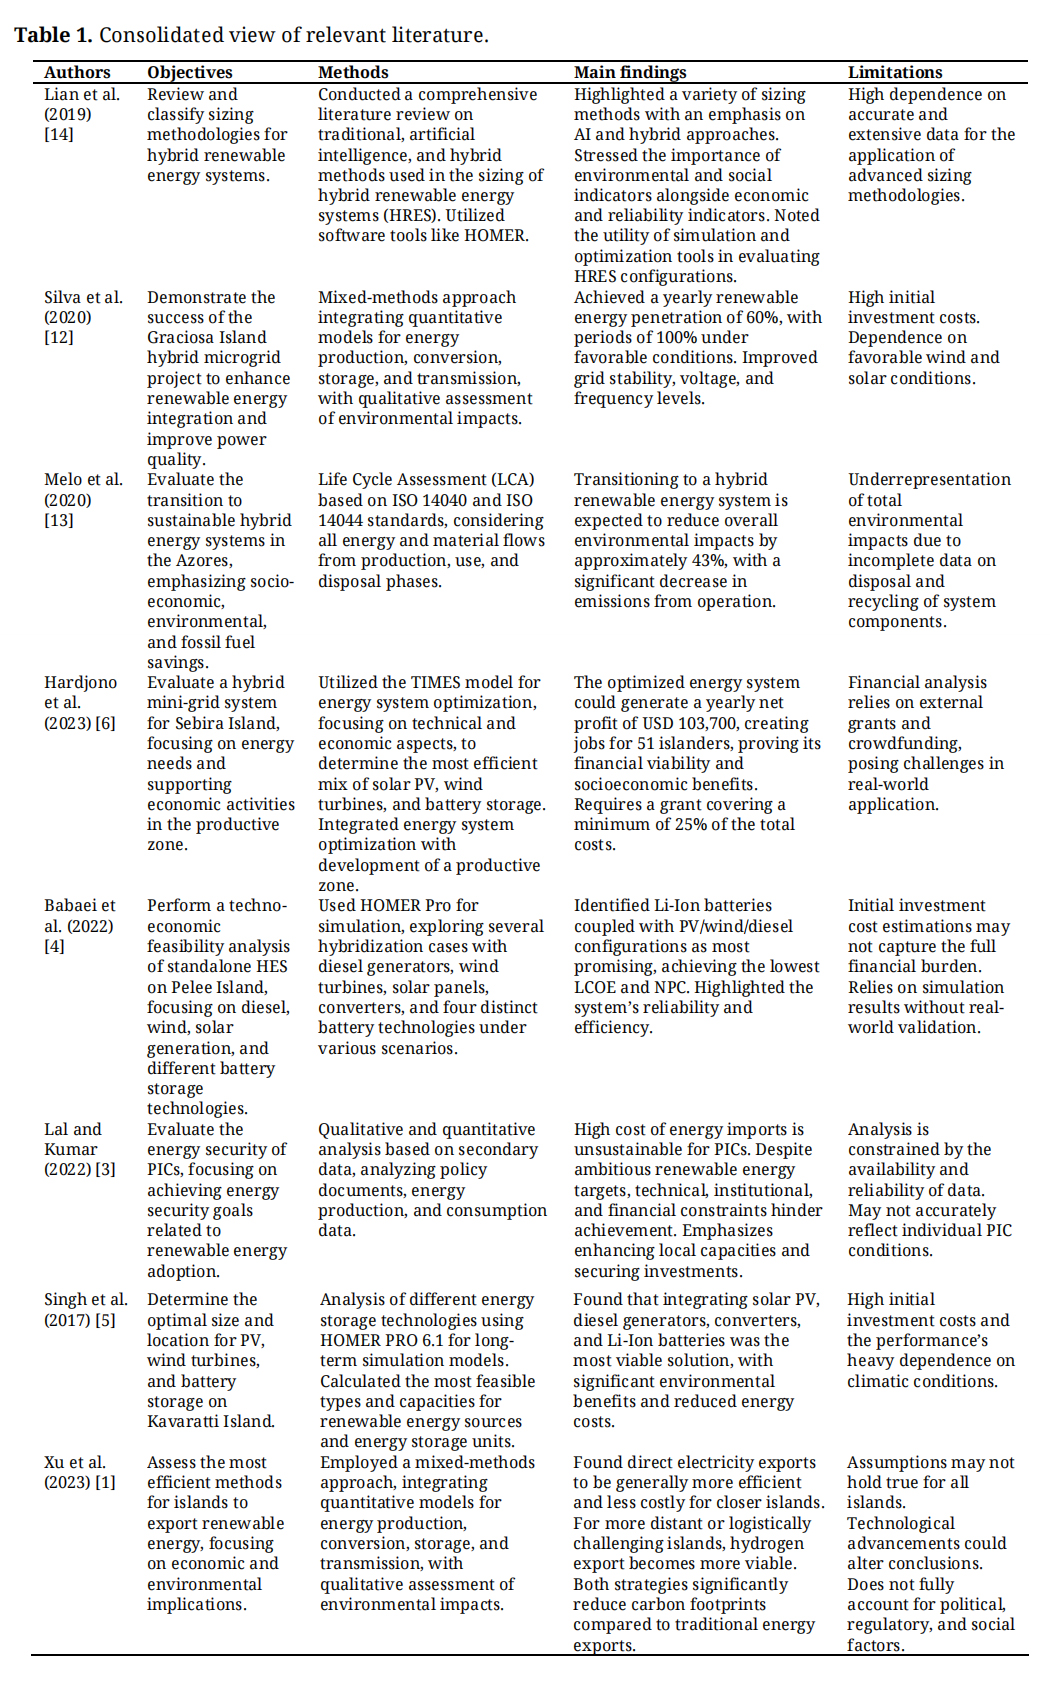 Table 1. Consolidated view of relevant literature.
The literature asserts that the quest for optimal sizing and implementation of hybrid energy systems on islands is paramount to the energy transition in these vulnerable yet capable landscapes. It also identifies the potential challenges of implementing hybrid energy systems on islands, affirming the need for nuanced, context-specific approaches supported by comprehensive planning. However, it also highlights several gaps on renewable energy systems for island contexts. For example, Lian et al. [12] note a lack of comprehensive assessments that integrate all dimensions of energy security for small Pacific Island countries (PICs), particularly regarding the adoption and effectiveness of renewable energy technologies. Babaei et al. [4] point to the underexplored area of integrating different battery technologies into stand-alone HES for remote areas, in particular the lack of assessments of their technical and economic suitability, and of addressing the combined optimization of sizing and location of renewable energy systems and storage on islands. Hardjono et al. [6] discuss the lack of exploration of the environmental trade-offs associated with integrating battery storage with renewable generation in isolated grids. Lal and Kumar [3] note the lack of detailed analysis of operational challenges and solutions for grids with high renewable penetration in real-world applications. Silva et al. [12] emphasize the need for more recent data and advanced technological applications to guide system design and implementation in remote areas, highlighting a disconnect between policy ambitions and practical outcomes in renewable energy targets. Other references that support these observations include studies by Melo et al. [13], Singh et al. [5], Stenzel et al. [10], and Xu et al. [1], all of which contribute to the understanding that there are significant gaps in current research that need to be addressed to advance the renewable energy sector in island environments.
With such gaps in mind, this paper aims to provide a comprehensive analysis of the hybrid energy system implemented on the island of Graciosa, in the Azores archipelago. It proposes the expansion of the current system to cover the energy needs of the entire island with 100% renewable energy. For this purpose, four expansion case studies have been carried out using the simulation software Homer Pro and PVSyst. First, the current scenario is analyzed, where the renewable system supplies the island with about 60%, and the fossil fuel power plant supports the remaining 40% [10]. The other four case studies examine different scenarios for evolving the grid by expanding the island’s renewable energy system to optimize production, storage, and power grid management. In this respect, this study is original in that it proposes a new approach to analyze the potential for implementing and expanding a hybrid energy system on the island of Graciosa, using current production technologies in a specific, unique context, and taking into account economic and environmental impacts, as well as energy security concerns.
Graciosa is one of the nine volcanic islands in the Azores, and it is the second smallest of the archipelago. It is a Portuguese island located approximately 1600 km west of Lisbon, mainland Portugal, and 1180 km northwest of Madeira Island. It covers an area of 60.66 km2, is 10 km long and 7 km wide, and has a population of approximately 4100 inhabitants [14].
The island has three power generation facilities to produce and deliver electricity to the power grid: a thermal power plant (TP), a wind farm (WF), and a photovoltaic power plant (PV). Figure 1 shows the geographic locations of the power generation and transmission equipment. Electricity is transmitted through two 15 kV medium voltage (MV) overhead lines (blue and red lines), a 15 kV underground network in the city of Santa Cruz town (green lines), and a 0.4 kV low-voltage distribution network. The MV grid is 67.9 km long, with 11.4 km of underground cables and 56.5 km overhead lines. The power system processes electricity in 74 transformer stations of 15/0.4 kV, including 22 for private service stations [15].
Prior to the implementation of the hybrid system, the community of Graciosa relied heavily on the diesel power plant to meet its electricity needs. This dependence had several negative environmental impacts, mainly due to the supply and combustion of diesel during the plant’s operation [10]. This thermal power plant, which is still in operation, is owned by Eletricidade dos Açores (EDA), the vertical local energy utility.
Despite the recent adoption of a hybrid system, the remaining diesel generation (40%) still accounts for over 60% of the environmental The island’s Battery Energy Storage System (BESS) allows for a smoother integration of renewable energy into the grid by mitigating the intermittency of wind and photovoltaic power plants, providing a stable and continuous power supply to the island [13]. The 7.425 MW BESS plant, with a total usable capacity of 3.2 MWh, acts as a management plant, supplying energy to the local grid, minimizing the islands’ dependence on fuel imports, and significantly reducing greenhouse gas emissions. Excess renewable energy that would otherwise be wasted is stored in BESS and can be used during periods of low renewable energy production or high demand, effectively balancing the island’s energy supply.
The BESS is a key component of the Energy Management System (EMS) and is critical to Graciosa’s efforts to achieve a sustainable and environmentally friendly energy infrastructure. This system enables intelligent demand management by monitoring and regulating energy consumption throughout the island. The EMS incorporates smart grid technology that enables efficient distribution and allocation of energy. It helps manage demand, control voltage and frequency levels, and reduce losses in the distribution system.
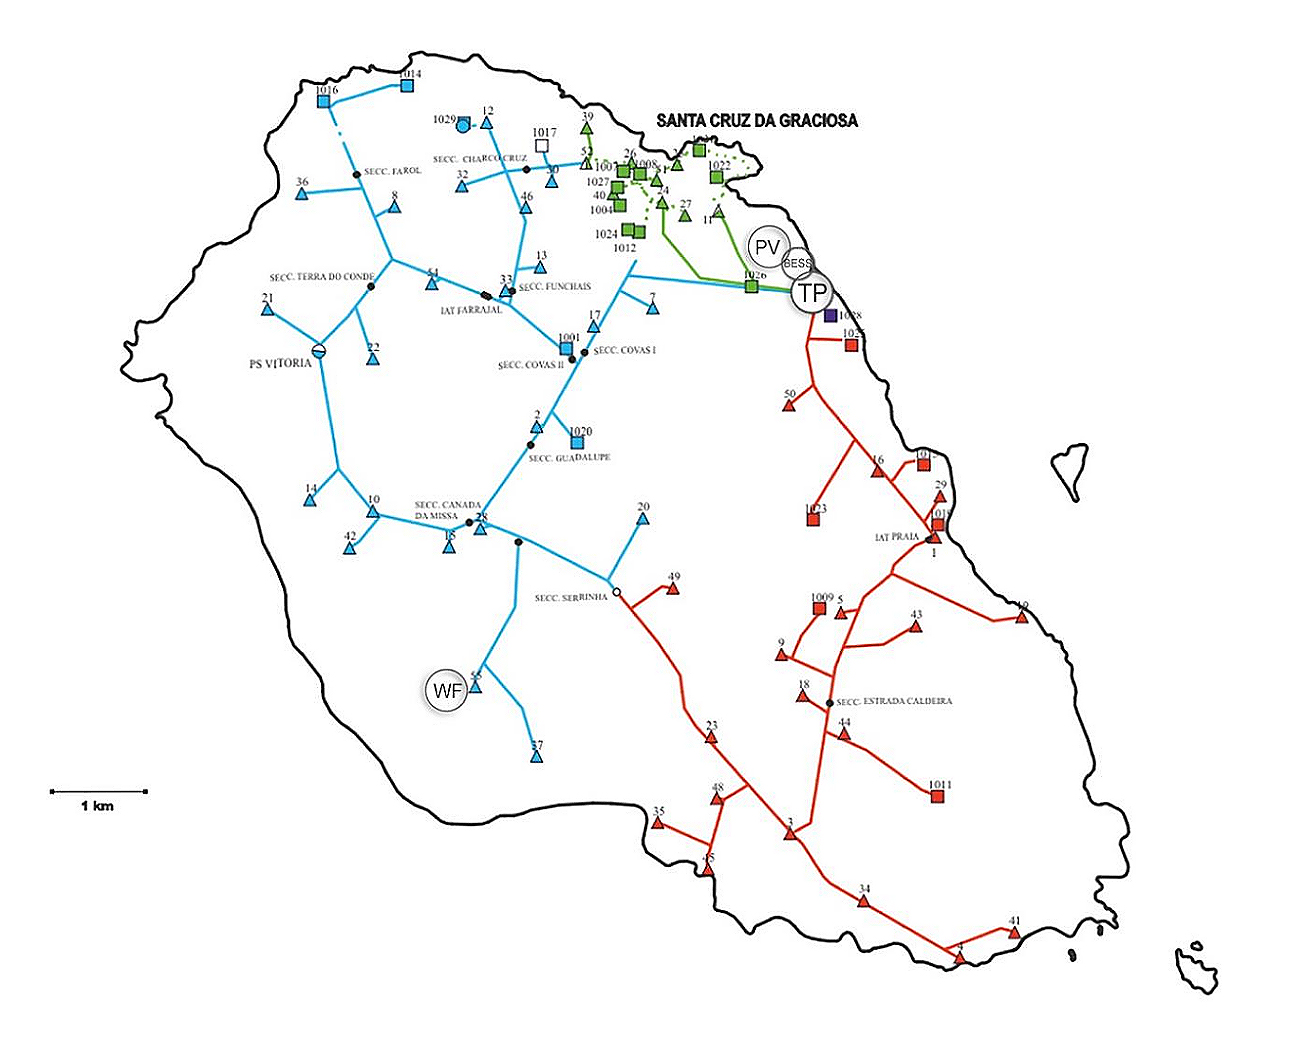 Figure 1. Geographical location of Graciosa island’s electric system. BESS—Battery energy storage system; TP—Thermal power plant; PV—Photovoltaic power plant; WF—Wind farms. Source: Eletricidade dos Açores [16].
In August 2019, a hybrid system was commissioned in Graciosa that uses renewable energy sources and energy storage technologies to balance fluctuating electricity generation and demand, and provide various system services to the grid, including frequency and voltage control and black start capability [17].
The Graciosa hybrid system, also known as the Graciólica project, combines solar and wind generation with energy storage using lithium-ion batteries, inverters, and the remaining diesel generation. These equipment values are [12]:
●
●
●
●
The Greensmith Energy Management System (GEMS) is the brain of the hybrid system in Graciosa [18]; it enables real-time monitoring of the entire energy system. It collects production, consumption, and equipment status data, and integrates and removes resources from the island’s energy grid. GEMS ensures the optimal use of the power generated and stores any surplus energy for later use, as well as regulating the grid’s frequency and voltage, with a focus on reducing diesel consumption and maximizing renewable energy.
The GEMS web interface provides a dynamic, real-time global diagram of the Graciosa hybrid system, showing individual production from the five wind turbines, three storage units, a solar plant, and six diesel generators (Figure 2). The diagram also shows load consumption and circuit breaker status.
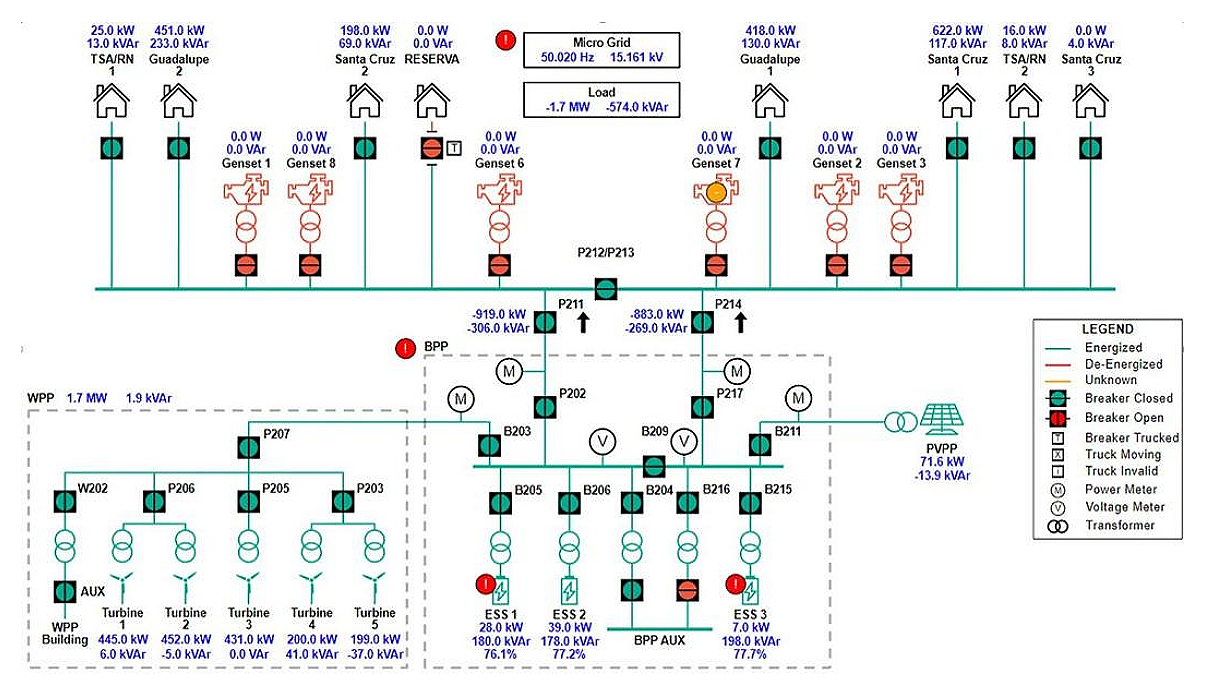 Figure 2. Diagram of Graciosa’s hybrid system. Source: GEMS’ simulation screenshot.
Today, Graciosa’s electricity system is still dependent on diesel combustion in the thermal power plant. However, deploying the hybrid system as an alternative has become increasingly attractive from an economic and environmental perspective, reducing the islands’ reliance on fuel imports, and significantly reducing greenhouse gas emissions. Graciosa’s hybrid system supplies approximately 60% of the island’s energy needs, with the remainder provided by a diesel-fueled thermoelectric plant that is used only as a last resort. Table 2 documents the energy contribution of the hybrid system’s equipment generated during the last three years since its implementation [19].
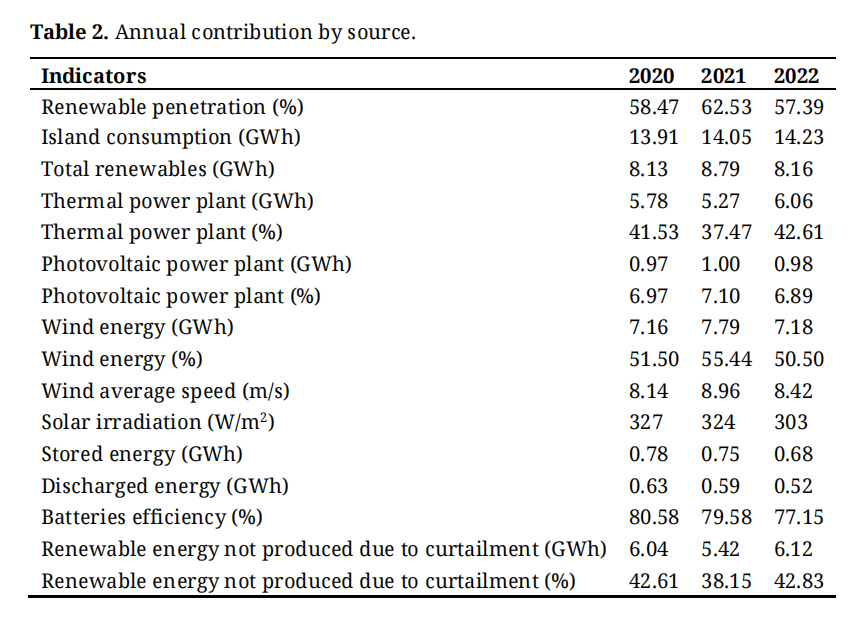 Table 2. Annual contribution by source.
Based on the data presented in Table 2, we can observe that in the last three years, the island generated 40.53% of its net electricity from thermal power plants, 6.99% from PV plants, and 52.48% from wind farms. As a result, the renewable energy penetration rate reached 59.46%. To achieve this level of renewable energy penetration, GEMS had to deploy the battery storage system as the only way to ensure proper energy management and maximize renewable energy generation.
During the three years analyzed, the renewable energy system experienced curtailment, which resulted in a significant amount of energy generated from solar and wind sources being wasted. This represents a significant portion of the total renewable energy delivered to the grid, as shown in the last two rows Table 2.
As renewable energy becomes more widespread, a new challenge has arisen in dealing with the energy that is not produced due to curtailment. On Graciosa Island, there is a situation where some of the renewable generation capacity is curtailed when the electricity grid is under unforeseen stress. This happens when there is no way to consume all the energy produced and no other options are available to balance the grid [20].
In the previous section, we highlighted some shortcomings of the Graciosa hybrid system that require analysis and correction. Specifically, there is a need to reduce diesel generation and increase battery storage operation to integrate and reduce the excess renewable electricity that is currently curtailed.
In the next section, we examine a baseline scenario (current situation) and four expansion scenarios that integrate different renewable technologies, such as solar photovoltaic (PV), wind (WF), storage systems (BESS), biomass and green hydrogen. In each scenario, we have considered different shares of renewable electricity generation.
Homer Pro and PVSyst software were used for this purpose. Homer Pro, which stands for Hybrid Optimization Model for Electric Renewables, is an efficient software program designed to optimize and analyze hybrid renewable energy systems that combine multiple energy sources such as solar, wind, and conventional generators to meet the energy requirements of a specific location or application [11]. This simulation model runs all possible combinations of the equipment we want to connect to the energy grid, with engineering and economics working side by side.
After simulating all possible system configurations, we can identify the feasible systems ranked by their lifecycle cost [21]. Homer Pro optimizes for the lowest net present cost (NPC, or lifecycle cost), the financial metric that evaluates the profitability of an investment by comparing the present value of cash inflows with the present value of cash outflows over time [22]. The NPC of each scenario in this study is the present value of all the costs of installing and operating the generation equipment over the life of the project, excluding the present value of all the revenues it generates. The software calculates the Net Present Cost of each technology and the total system according to the equation:

where CCAPEX is the initial capital cost (€), CO&M is the net operating and maintenance cash inflow (€/year), and n is the project duration (year).
Calculating the average cost per kWh of net energy produced by the system, also known as the Cost of Energy (COE) parameter, is also an essential metric in the simulation. The COE is critical to the project management, influencing budgeting, technology selection, risk management, and overall project sustainability. To calculate the COE in Homer Pro, the annual electricity cost (the total annual price of the system minus the cost of thermal production) is divided by the annual electricity output, according to the equation:

where Ctotal year is the total annual system cost (€/year), Cthermal load is the thermal production costs (€/kWh), Ethermal generated is the thermal energy generated (kWh/year), and Eelectric generated is the electric energy generated (kWh/year).
We had to enter the average daily irradiation values for each month to set up the photovoltaic plant in Homer Pro. Although Homer Pro has fairly good meteorological database, we decided to use the values obtained from PVSyst software, which has a more comprehensive database. PVSyst is an extremely versatile software tool that allows accurate simulation and optimization of different combinations of components, helping to identify the most appropriate configuration [23]. In addition, PVSyst provides financial analysis capabilities for a wide range of solar electric systems, making it particularly useful for applications in isolated and off-grid environments.
Using Homer Pro software, we were able to model various components and input data such as energy resource availability, load profiles, and economic parameters to simulate the performance of the Graciosa hybrid system. The accuracy of the simulation depends on the quality of the input data. For all the scenarios, the NPC and the COE are provided by Homer Pro as the metrics that result from the simulation, and the software uses them to list the winning simulation. Inputs included load, CAPEX, O&M costs, fuel, and the equipment’s long life. After running, Homer shows the scenario with the lowest NPC and COE.
In the following section, we describe five scenarios, their simulation models, the necessary adjustments, and the results, all compared with the same values obtained from GEMS and SREA—Azores Regional Statistics Service.
In this research, we analyzed various scenarios using Homer Pro and PVSyst software to accurately simulate hybrid system scenarios. The purpose of these scenarios was to evaluate the performance, feasibility, and economics of each generation technology scenario and to understand how various factors, such as energy demand, fuel prices, and technology efficiency, could affect the system.
The first scenario (baseline) describes the current energy situation of the island of Graciosa. The hybrid system supplies around 60% of the island’s energy needs, while the remaining 40% comes from the fossil-fueled thermal plant. The subsequent scenarios examine potential configurations for expanding and improving Graciosa’s hybrid system, which relies on renewable sources such as solar photovoltaic, wind, biomass, and green hydrogen power plants, as well as lithium batteries. Figure 3 outlines the power generation architecture for the five case studies, with the images obtained from Homer Pro simulations.
The simulations analyze the island’s energy needs from renewable sources, taking into account the power generation technologies that are already available or could be invested in. This will be the future direction for Graciosa’s energy mix to achieve zero gas emissions by 2050.
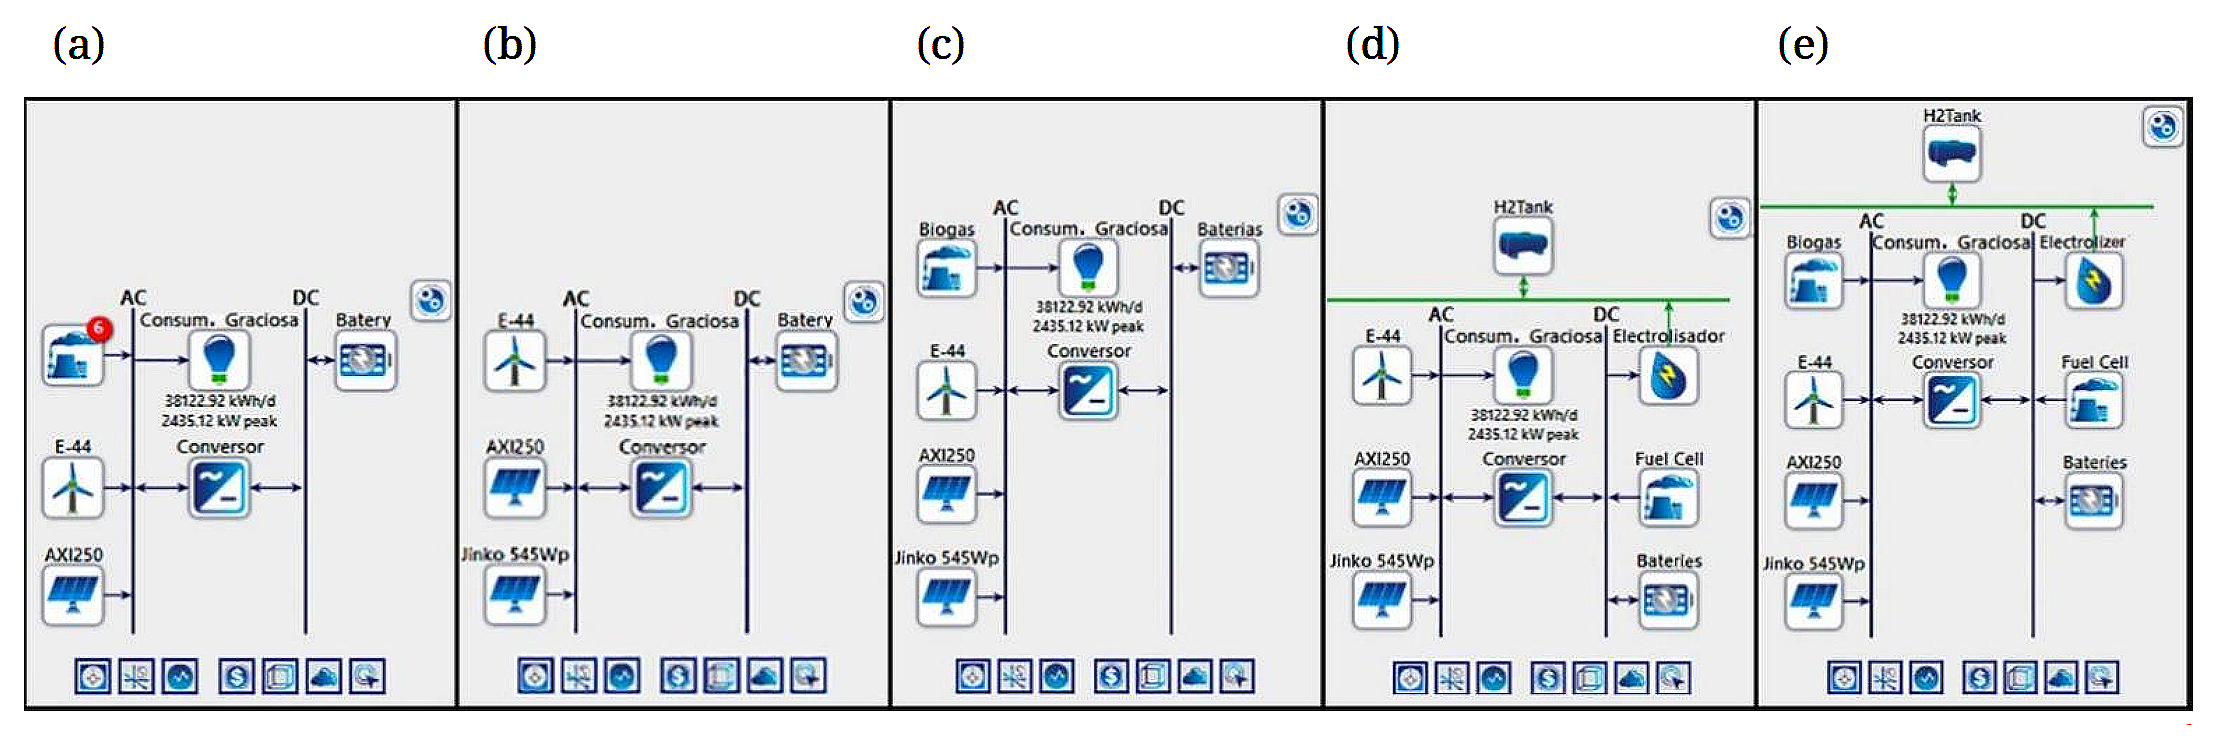 Figure 3. Power generation scenarios: (a) Photovoltaic, wind, batteries, thermal; (b) Photovoltaic, wind, batteries; (c) Photovoltaic, wind, batteries, biomass; (d) Photovoltaic, wind, batteries, hydrogen; (e) Photovoltaic, wind, batteries, biomass, hydrogen. Source: Homer Pro simulation.
The following list summarizes the assumptions made throughout the present study:
●
○
○
○
○
○
●
●
●
●
●
●
●
●
This scenario resembles the current situation on Graciosa Island, consisting of a 1 MW solar photovoltaic plant, a 4.5 MW wind farm, 3.2 MWh batteries, and a 4.7 MW thermoelectric power plant.
We collected the energy consumption data for Graciosa Island from January to December 2022 in all 15-minute intervals, resulting in 35,040 values. This data was analyzed using Homer Pro, which provided us with information on the annual, seasonal, and daily consumption profiles, as well as the island’s average daily consumption (38.122 MWh/day), average power (1.588 MW), and maximum peak load (2.435 MW). To configure the photovoltaic plant, we needed to enter the average daily irradiation values for each month. Although Homer Pro has a meteorological database, this study used the PVSyst values for later comparison. We selected the photovoltaic module currently installed in Graciosa, the AXITEC brand’s 250 Wp AC-250P/156-60S model, and entered all the facility’s parameters, such as the type of module mounting, orientation, inclination, CAPEX, and O&M costs. The “Search Space” tool in Homer was used to set the installed power at a fixed value of 1 MW for the simulation.
To simulate the wind farm, we use GEMS’s average wind speeds between 2020 and 2022. We selected the Enercon 900 kW E-44 model from the Homer library, which is currently installed in Graciosa, and specified its height, costs, losses, performance, and availability. The “Search Space” tool was set for five units of the 900 kW E-44 model, similar to the current installation.
Regarding the Graciosa battery storage facility, since Homer Library does not have the battery and inverter models installed on Graciosa, we selected three generic models of lithium-ion battery unit, similar to the real ones.
For the Graciosa thermal power plant, we selected six manufactured by Caterpillar Inc. diesel generators with a total capacity of 4652 kW, which is very close to the actual requirement. Costs were determined, including the price of diesel, a value that can vary significantly depending on region, transportation costs, and current market price [25]. The price information from the Portuguese Energy Regulator (ERSE) is for a diesel price of 1.2074 € per liter, as a reference value for the year 2022 [24].
After defining all the parameters in Homer Pro, the simulation calculated the energy production scenario for the island. Figure 3a illustrates the architecture of this case study. Table 3 contrasts the simulation results for this scenario with the actual values obtained from GEMS and SREA (the latter were calculated as the average of the values in Table 2.
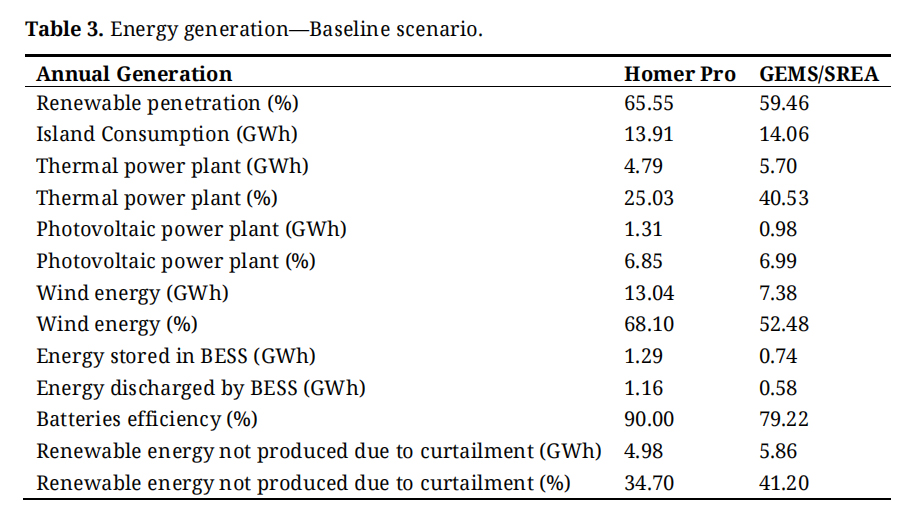 Table 3. Energy generation—Baseline scenario.
As documented in Table 3, Homer Pro’s renewable penetration is about 6.09% higher than the actual average for the last three years (2020 to 2022). However, this value is highly dependent on the losses predefined in the equipment, so we do not consider it a significant difference. Overall, this is a very satisfactory result, in line with our expectations.
The solar photovoltaic production determined by Homer Pro is 1.31 GWh/year, which corresponds to the simulation of the PVSyst software—1.32 GWh/year. The PVSyst 3D simulation of the 1 MW PV power plant showed that an area of 18,000 m² is needed to install the photovoltaic modules.
The difference in PV and wind energy generation in Homer Pro, when compared to GEMS/SREA, is due to the fact that the software does not subtract the renewable energy not produced due to curtailment. In this case, it is necessary to subtract the 4.98 GWh curtailment value from the solar (1.31 GWh) and the wind (13.04 GWh) energy. In this way, the percentages for each technology (renewable and non-renewable) would be closer to the actual values.
Regarding the thermal power plant, we simulated the six generators in Homer Pro as close as possible to the Graciosa thermal power plant, taking into account the actual costs, as described in Table 3. The total annual fuel consumption is 1,240,773 liters of diesel, which is very close to the forecast figure predicted in [11], which is 1.3 million liters.
In the BESS facility, the simulation results show various information, including the state of charge (SOC), stored energy, discharged energy, losses, and energy cost. A critical piece of data is the battery autonomy, which is 1.32 hours. It is important to note that when defining the battery, a minimum SOC of 30% was set in order to guarantee the grid security and to avoid the recurrent use of diesel generators.
In Table 4, we have a summary of the costs simulated by Homer Pro, resulting in NPC = 50,072,864.94 € and COE = 0.180 €/kWh.
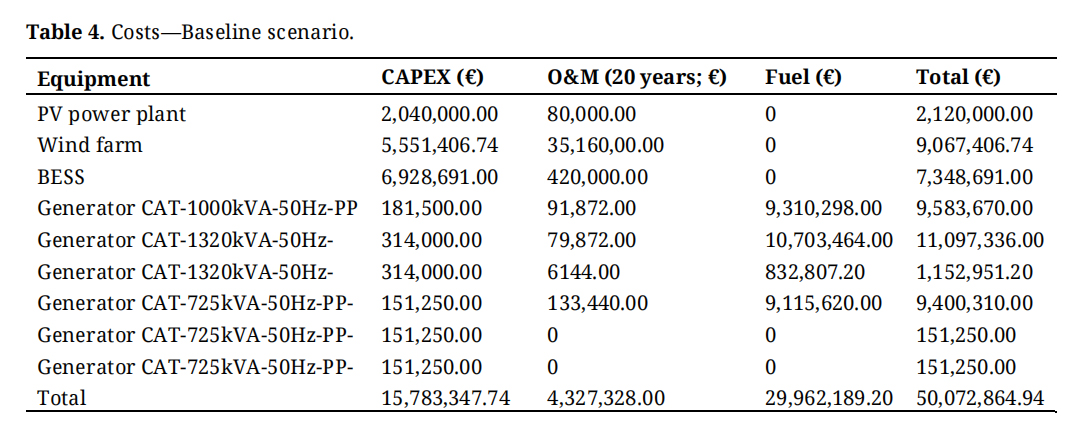 Table 4. Costs—Baseline scenario.
The main objective of the current Graciólica project is to ensure that the island’s electricity system generates between 60 and 65% renewable energy per year. The investment of the project was not designed to achieve 100% renewable energy production; additional investment is needed for this expansion.
This first scenario aims to simulate the expansion of the current hybrid system by deactivating the generation contribution of the thermal power plant. In this scenario, the island will operate entirely on sustainable energy sources, including solar and wind production technologies, supported by the battery storage system, as shown in Figure 3b.
The system components of the scenario were designed in Homer Pro, and the operation was simulated in order to minimize the total cost, considering the construction, operation, and maintenance costs during its useful life. A new set of solar photovoltaic modules was added to the simulation, as the existing 1 MW model plant in Graciosa is no longer commercialized and has low efficiency (15.4%). The current Homer Pro’s library is not up to date with the latest solar modules (with higher power ratings and efficiency), so the model JKM545M-72HL4-V from the manufacturer Jinko was added manually as a proxy. This module has a power of 545 Wp and an efficiency of 21.13%. We simulated this scenario for a CAPEX value of 1.00 €/W and an O&M cost of 1% of the CAPEX value for the new PV plant.
Homer Pro simulated the power plants and the “search space” for the existing 1 MW solar photovoltaic plant with 250 Wp AXITEC modules. For the wind farm, the same existing wind turbine model was used including CAPEX and O&M values per installed capacity. In the battery plant, the same 1 MWh generic battery configuration was used as in the previous simulation, as well as CAPEX and O&M values per power rated installed capacity. Table 5 summarizes the calculations from the winning Homer Pro simulation.
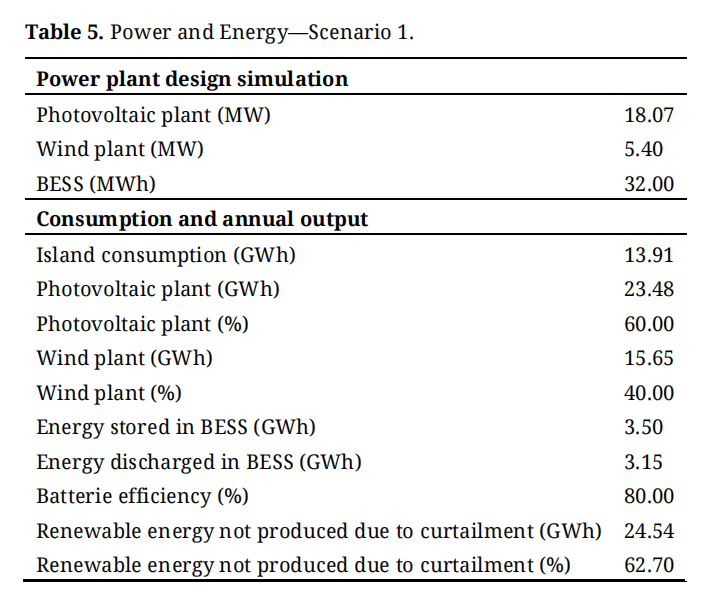 Table 5. Power and Energy—Scenario 1.
The total solar production is 23.48 GWh/year, of which 1.34 GWh refers to the existing PV plant with an installed capacity of 1 MW. The remaining 22.14 GWh/year refers to the additional 17.07 MW PV plant that needs to be built.
As in the baseline scenario, the PVSyst software was also used, resulting in a production of 23.06 GWh/year, about 0.92 GWh higher than the Homer Pro result. Since a large ground-mounted solar photovoltaic plant is involved, it is important to note that the area required for its installation is about 170,000 m2, which requires the acquisition of land next to the existing 1 MW solar photovoltaic/battery plant area, either through purchase or lease.
The wind farm generates 15.65 GWh/year from 6 ENERCON E-44 wind turbines, with a total installed capacity of 5.40 MW. Five wind turbines have already been installed on the island, requiring the installation of one additional E-44 wind turbine.
For the BESS, the simulation results predicted a storage system with a nominal capacity of 32 MWh, allowing an autonomy of 14.1 hours, with a minimum SOC of 30% set by the user to guarantee grid security since renewables are intermittent. There is no longer a thermoelectric plant to turn to.
There is a very high surplus of energy production, namely 24.54 GWh/year of renewable energy not produced due to curtailment, which represents 62.70% of the total energy that the hybrid system can have. This is due to the large intermittency of solar photovoltaic and wind renewable facilities. Even with a 32 MWh storage system, more electricity is “wasted” than the island consumes. This excess power cannot be lowered by reducing the installed production capacity, as this could jeopardize the reliability of the energy supply.
According to the winning simulations of Homer Pro, the total NPC value is 112,696,860.26 €, and the COE is 0.4053 €/kWh, taking into account the CAPEX and O&M costs. Table 6 shows that the CAPEX cost of the battery plant is very high, representing 74.36% of the total CAPEX cost of the hybrid project.
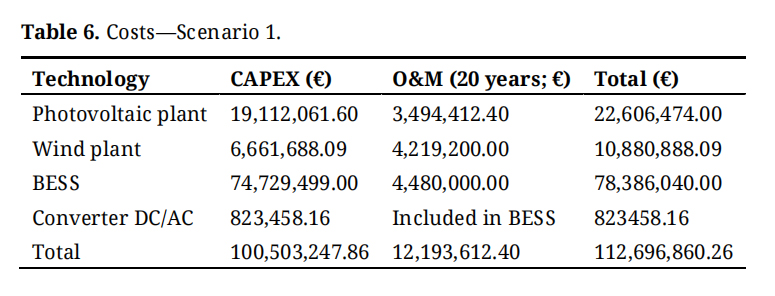 Table 6. Costs—Scenario 1.
In the previous subsection (Scenario 1), we observed that wind and solar power plants on Graciosa Island generate excess energy, which poses technical challenges that need to be addressed. These variable renewable energy sources are weather-dependent, so power generation requires greater flexibility in the power system [26].
Teixeira [27] conducted a study to explore this extra energy, and concluded that bio-oil from biomass pyrolysis is a promising solution to reuse that excess. The potential of biomass for energy production on Graciosa Island has been studied with the support of the Azorean Government and the local energy utility, EDA. Although only 12% of the island’s surface is forested, significant land areas are occupied by invasive alien woods, mainly dominated by Pittosporum Undulatum Ventenat (Pittosporaceae). This feedstock can be an important primary energy source for meeting the island’s electricity needs. In terms of dry weight, the available biomass of Pittosporum Undulatum on Graciosa Island was estimated to be 92,152 tons, with a projected annual biomass production of 2368 tons [28].
To ensure the viability of biomass exploitation on the island, it is crucial to follow the principles of sustainable forest management. This includes the efficient use of existing forests and the control of invasive exotic species. The benefits of this approach are cost reduction, reduced environmental impact, and the avoidance of external purchases. However, if it is not economically feasible to sustain the project from the island, purchasing feedstock from other Azorean islands or the mainland is the alternative. Considering only the existing raw materials in Graciosa Island, this scenario focuses on the use of biomass.
Homer Pro assumes that all biomass feedstock is gasified to produce biogas, which is then used by one or more generators to produce electricity, as shown in Figure 3c. The simulation included the biomass plant and used identical parameters for the PV, wind, and BESS facilities, as in scenario 1.
We entered the daily biomass of 6.49 tons into the simulation software (obtained from dividing 2368 by 365) along with relevant information about the biomass fuel. This information included the cost of 35 €/ton, a lower calorific value of 5.5 MJ/kg, a carbon content of 50%, and a gasification ratio of 70% [29,30]. The cost of the generator that will convert biogas to electricity, as well as its CAPEX and O&M costs, were configured based on a study for an 11 MW gasification plant in central Portugal [30]. Table 7 summarizes the calculations for the winning simulation.
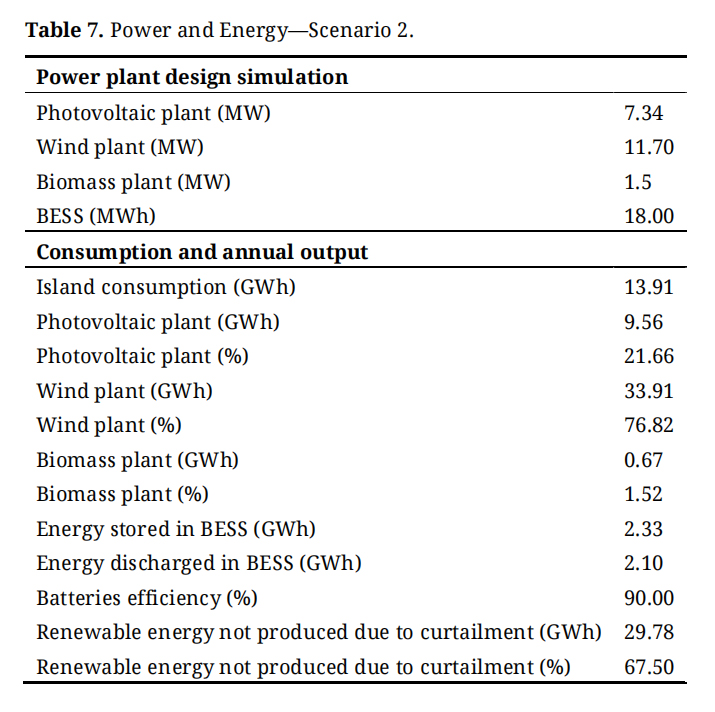 Table 7. Power and Energy—Scenario 2.
According to Homer Pro’s production report, the total solar production is 9.56 GWh/year, of which 1.34 GWh/year is generated by the existing photovoltaic plant, and the new 6.34 MW PV plant will produce the remaining 8.22 GWh/year. The PVSyst software was also used in this scenario to estimate the solar power generation and predicted the generation of 8.56 GWh/year from the Jinko modules, which is 0.34 GWh higher than the Homer Pro result. To generate this additional power, 60,000 m² is required for the new PV power plant.
The wind production simulation is 33.91 GWh/year from 13 ENERCON E-44 wind turbines, with a total installed capacity of 11.70 MW of installed power. There are already five wind turbines on the island, so eight more E-44 wind turbines would need to be installed.
In addition, the battery storage plant has a nominal capacity of 18 MWh, ensuring an autonomy of 7.93 hours. The minimum SOC at 30% was set to ensure grid security.
The biomass plant can produce 0.67 GWh per year by consuming 2041 tons of biomass per year, which is equivalent to 2.18 GWh per year. Overall, the system has an efficiency of 30.9%.
Looking at this scenario, we can see a significant amount of excess energy production. Specifically, due to curtailment, 29.78 GWh/year of renewable energy has yet to be produced, which is approximately 67.50% of the total energy that the hybrid system could generate.
Table 8 shows the CAPEX and O&M costs considered in this simulation, which resulted in an NPC value of 85,492,072.05 €, and a COE of 0.3074 €/kWh. It is worth noting that the CAPEX cost of the battery plant is still high, although it has been reduced when compared to scenario 1. The cost of the battery plant is about 60.35% of the total CAPEX value of the hybrid project.
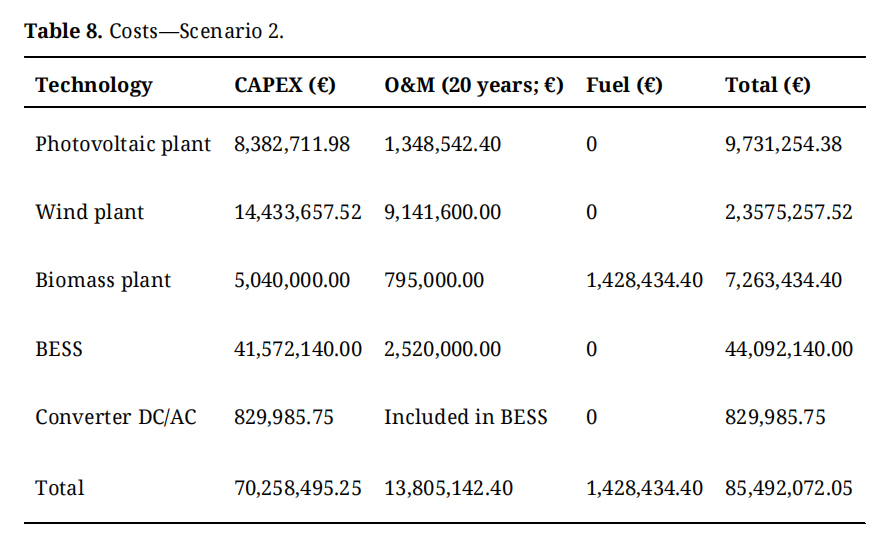 Table 8. Costs—Scenario 2.
Water scarcity and underutilization of renewable energy sources for electricity production are prevalent problems in many isolated systems worldwide [31]. Graciosa faces water scarcity, with an average annual precipitation of approximately 966 mm/year [32]. Human consumption accounts for 68.2% of the total water demand of the island, which is 778 × 103 m3 per year, while agriculture and livestock breeding account for 18.3% of the total demand [33]. In addition, seawater intrusion is a major cause of groundwater salinization in the Azores archipelago [34].
Graciosa Island can overcome these challenges by using green hydrogen and desalination. By building a green hydrogen production facility and a desalination plant, we can efficiently remove salt and minerals from seawater and use the purified water for later electrolysis. This approach will not increase the island’s renewable resources. However, it can help address the island’s challenges by solving the island’s water shortage and making more efficient use of existing resources.
For this scenario, we will use the same solar and wind parameters as in scenario 1, along with three units of a generic lithium-ion battery model, each with a capacity of 1 MWh.
The Homer Pro software includes a hydrogen (H2) module that simulates a system that produces, stores, and consumes H2. Since there are no H2 consuming loads on the island of Graciosa, the simulation focuses on the production and storage of H2. This includes the electrolyzer and the H2 storage tank modules. To ensure 100% green H2 generation, the energy for the electrolysis process comes from solar PV and wind power plants. This energy comes from excess renewable sources that are first stored and then used by the electrolyzer [35].
After the H2 is produced, it is stored in tanks to serve as an energy source to power the fuel cell. The storage will be in the compressed gaseous form due to the extremely low volumetric density of H2.
To simulate a green H2 plant in Homer Pro, we add three Homer Pro components: the hydrogen tank, the electrolyzer, and the generator. The hydrogen tank component is already available in the software, and we only needed to specify its lifetime, CAPEX, O&M costs, and whether it was empty or complete at the start of the plant’s operation. We entered various storage capacity values to optimize Homer Pro’s tank sizing.
The electrolyzer component is also predefined, but we entered its lifetime, CAPEX, O&M costs, efficiency, and minimum load ratio. In addition, the electrolyzer’s power values were referenced to ensure freedom of choice for a better simulation.
Homer Pro does not provide a pre-set fuel cell model or any thermal H2 generator in its library. However, it is possible to simulate a DC thermal generator called the Generator component by specifying that it is powered by stored H2. This allows for a complete design optimization for the H2 power plant. To design the H2 power plant, we used the HyJack software, which allowed us to draw a system diagram and define its characteristics and prices.
Figure 3d shows the energy system architecture, including solar photovoltaic, wind power, lithium batteries, and the green H2 system. The system shows the storage tank, electrolyzer, and fuel cell simulated with a DC thermal generator. Table 9 shows the calculations of the winning simulation for this scenario.
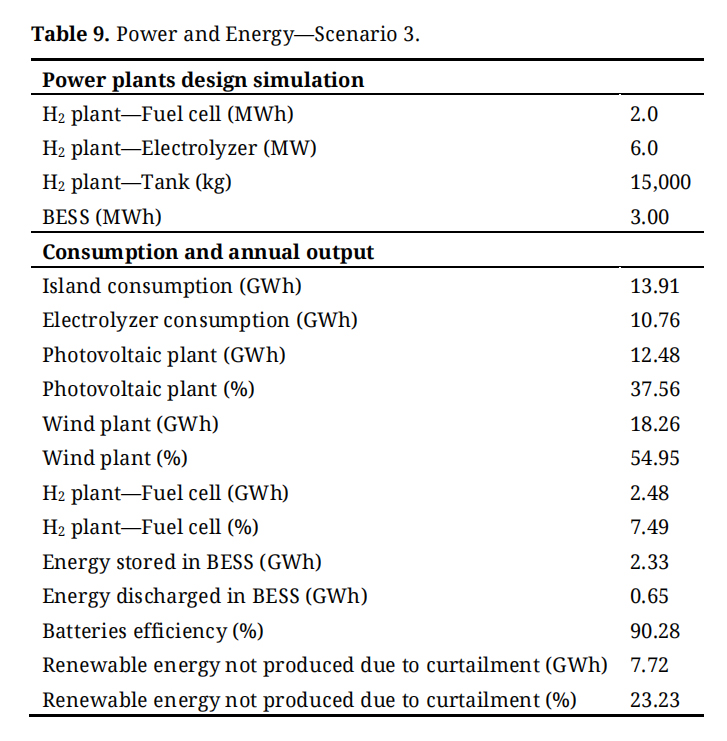 Table 9. Power and Energy—Scenario 3.
According to the Homer Pro simulation, the total PV production is estimated to be 12.48 GWh/year, with 1.34 GWh coming from the existing solar plant and the remaining 11.14 GWh from a virtual plant to be installed in the future. The virtual plant will have a capacity of 8.59 MW and use Jinko modules. On the other hand, the production estimated by PVSyst is 11.61 GWh/year, which is slightly higher than the result obtained with Homer Pro by about 0.47 GWh. An area of 90,000 m2 is be required for the installation.
The annual wind production results in 18.26 GWh from seven ENERCON E-44 wind turbines and a capacity of 6.30 MW to be added. Five wind turbines are in operation, so it is necessary to install two more E-44 wind turbines.
The BESS has a nominal capacity of 3 MWh, which provides 1.32 hours of autonomy. The minimum state of charge (SOC) of the battery is set at 30% to ensure grid security.
The hydrogen plant is equipped with a 6000 kW electrolyzer with an efficiency of 60%. It generates 163,706 kg of H2 per year and consumes 65.7 kWh of electricity per kg of H2. The electrolyzer requires about 10.76 GWh of electricity per year as an electrical load. The energy storage capacity of 15,000 kg of H2 is 500,000 kWh, providing 315 hours of autonomy. The simulated fuel cell can supply the island with 2.48 GWh of electricity per year, consuming 148,706 kg of H2 per year.
Table 10 shows the CAPEX and O&M costs considered in this simulation, resulting in an NPC value of 60,657,462.51 €, and a COE of 0.2181 €/kWh.
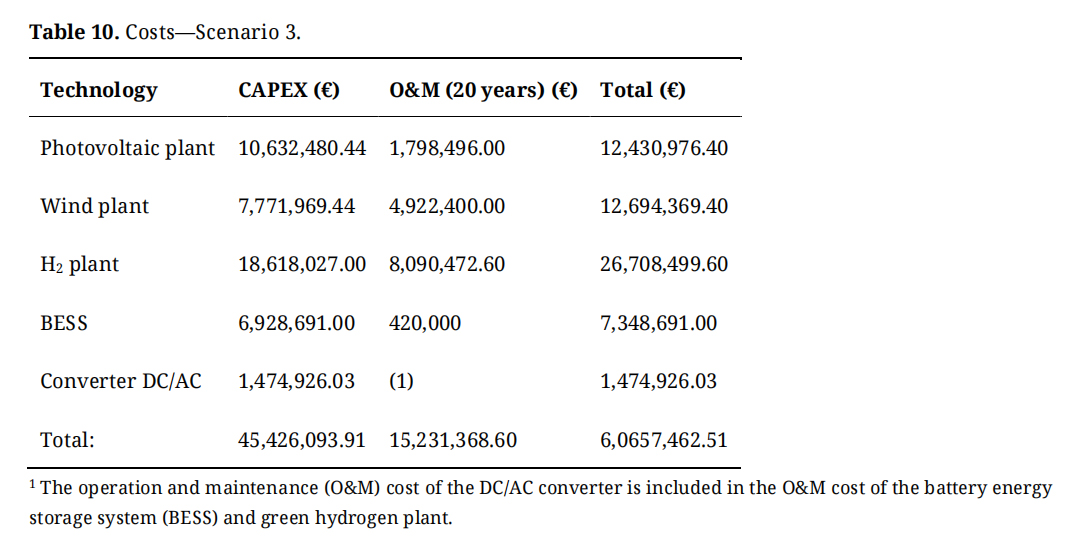 Table 10. Costs—Scenario 3.
According to Table 10, the construction of a green H2 plant can help reduce NPC and COE costs and minimize energy wastage due to curtailment. In this scenario, assuming that the thermal power station on Graciosa Island does not operate and the existing battery storage capacity is maintained, the excess energy production is only 7.72 GWh/year. This value represents 23.23% of the total energy that the hybrid system can generate. The amount of renewable energy not delivered due to curtailment is less than the first and second case Scenarios, which are 24.54 GWh/year (62.70%) and 29.78 GWh/year (67.50%), respectively.
Scenario 4: PV + WF + BESS + Biomass + HydrogenThis scenario covers all the renewable energy sources and storage technologies from previous scenarios, including photovoltaic, wind, biomass, lithium batteries, and green hydrogen. The current scenario includes a large energy mix that provides a higher energy supply for the island of Graciosa and 100% renewable energy, as shown in Figure 3e. We have used the same simulation parameters for the facilities and the CAPEX and O&M unit values from the previous scenarios.
Table 11 and Table 12 show the simulation results for power, energy, and costs, resulting in an NPC value of 51,041,020.7 € and a COE of 0.1835 €/kWh.
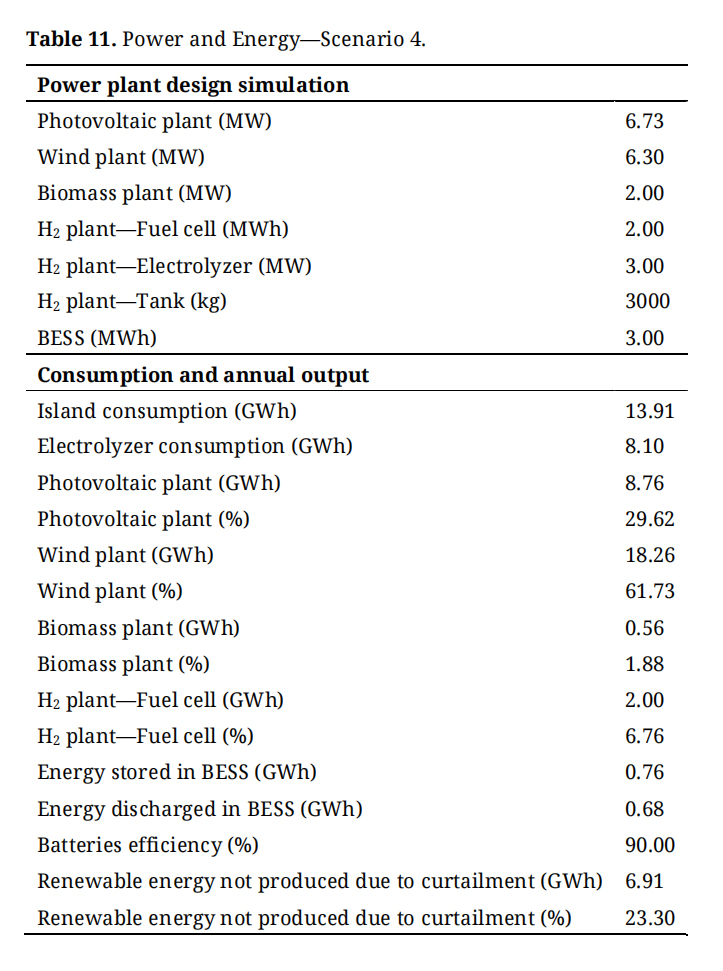 Table 11. Power and Energy—Scenario 4.
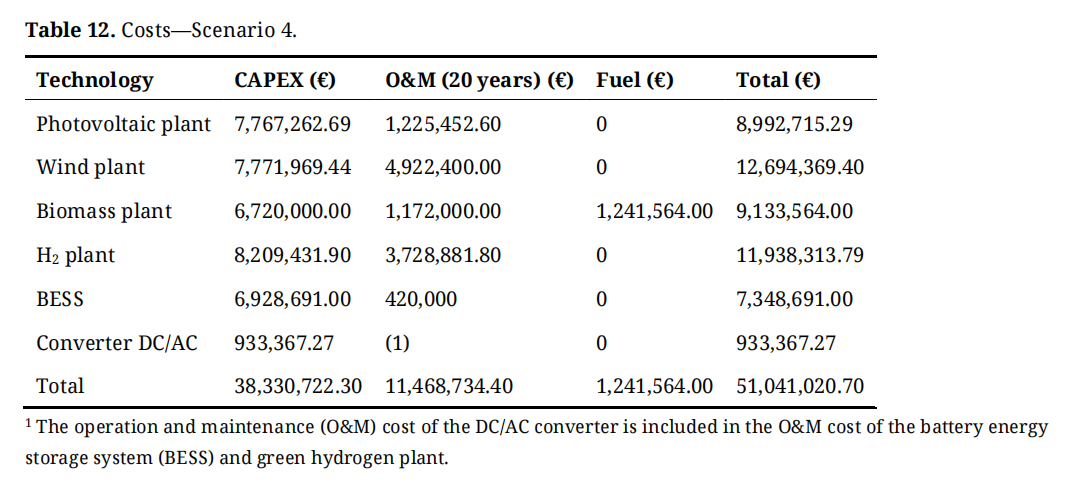 Table 12. Costs—Scenario 4.
The scenario shows that the energy operation can lead to a reduction in NPC and COE costs and a reduction in the renewable energy that could not be produced due to curtailment, which amounts to 6.91 GWh. Choosing a mix of renewable energy technologies can make the project more economically and technically attractive.
In the previous section, we simulated various scenarios for the energy system expansion of Graciosa Island. Those scenarios were based on actual or possible exploratory energy system parameters. The goal is to compare the different scenarios, understand the potential characteristics of each one, and identify future investment trends and energy patterns for the island.
The simulation scenarios included technical to economic aspects, covering a range of generation possibilities for the island hybrid system. Each scenario had its generation parameters and resulting costs, which provided a data set for analysis and interpretation. Table 13 provides a summary of the key technical and economic results of each technology studied.
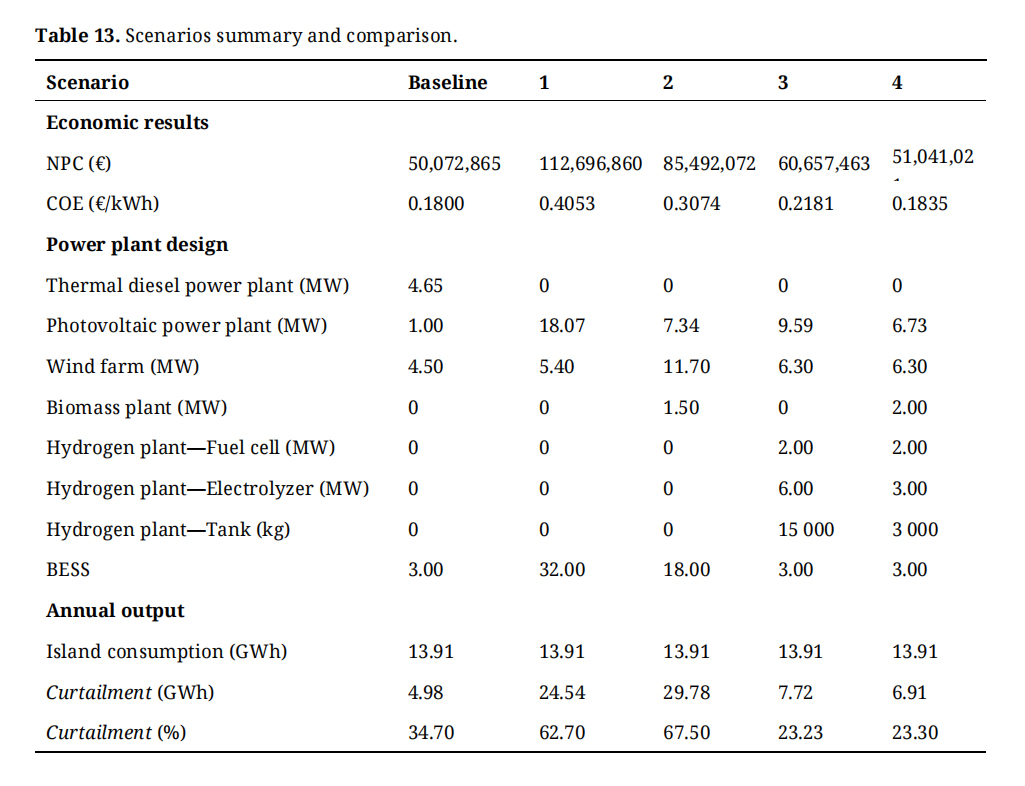 Table 13. Scenarios summary and comparison.
The baseline scenario refers to the current power generation on Graciosa Island, namely the operation of the thermal power plant. The objective of addressing this configuration is to compare the results obtained using Homer Pro and PVSyst with the actual data provided by GEMS/SREA. This comparison will help to determine the feasibility of using simulations to expand the system.
The optimized values from Homer Pro software are similar to those obtained from GEMS/SREA, with an average of 65.55% and 59.46% (over the last three years), respectively. Even with the diesel thermoelectric plant, there is more installed renewable capacity than the island needs from the 1 MW of PV plant and 4.5 MW from the wind farm. This situation results in an annual excess renewable energy production of 4.98 GWh, which is significant for the island’s annual consumption of 13.91 GWh. The results of this scenario show that the NPC (50,072,864.94 €) and the COE (0.180 €/kWh) are the most favorable among the five simulations.
The second case study examines the hybrid system of Graciosa, which does not include the thermal power plant but includes the existing renewable technologies such as the PV plant, wind farm, and BESS. The diesel plant, which previously served as a security system, has been withdrawn. This means that the battery storage system needs to be increased from 3.2 MWh to 32 MWh to compensate for the intermittency of the existing renewables.
To achieve this, the 1 MW photovoltaic plant would need to increase its power to 18.07 MW, and the wind farm would require an additional installed E-44 wind turbine to increase its power from 4.5 MW to 5.40 MW.
The island’s average power consumption is typically between 1.5 MW and 1.6 MW, with a maximum peak of up to 2.4 MW. However, the newly installed renewable production capacity of 23.47 MW would be high, resulting in a significant amount of wasted energy due to curtailment, which is approximately 24.54 GWh/year (62.70%). This level of curtailment is the second highest percentage among the projected scenarios.
As a result, this scenario 1 has the highest NPC of 112,696,860 € and COE of 0.405 €/kWh, making the system economically unfavorable.
The simulation for scenario 2 includes the addition of a biomass power plant to the island’s renewable energy sources to provide a capacity reserve for the overall generation system, which would not be possible with solar and wind technologies.
According to the simulation result, the total energy production for this case study is 7.34 MW from photovoltaic, 11.7 MW from wind, 18 MW from battery storage, and 1.5 MW from biomass technology.
The implementation of a biomass plant reduces the total installed capacity from 23.47 MW to 20.54 MW, a decrease of 2.93 MW compared to scenario 1. The lithium battery capacity decreases significantly by 14 MWh decrease, from 32 MWh to 18 MWh. The reduction in system cost results in an NPC of 85,492,072 € and a COE of 0.3074 €/kWh.
Scenario 2 has the highest annual renewable energy production result of 44.14 GWh. However, due to the average annual energy consumption of 13.91 GWh, there is a higher amount of energy wasted due to curtailment, about 29.78 GWh/year or 67.5% of the production system.
Although the proposal to build a 1.5 MW biomass plant is cheaper than scenario 1, it requires additional investment to become economically viable.
Scenario 2 reduces the capacity of the storage system by 44%; however, it has a higher installed renewable capacity when compared to the previous case study, which affects NPC and COE.
Scenario 3 explores an alternative method of storing renewable energy by building a green hydrogen (H2) power plant. This plant will not only support the island’s hybrid system but can also help address the island’s water shortage by desalinating seawater.
The simulation results indicate that the optimal solution includes 9.59 MW of solar PV, 6.30 MW of wind, 3 MWh of batteries, and a green hydrogen plant consisting of a 6 MW electrolyzer, a 15,000 kg tank, and a 2 MW fuel cell.
Compared to the solutions found in scenarios 1 and 2, building a green hydrogen power plant would be a better technical and economic solution. This is because it doesn’t require additional installed renewable power, and it does not waste excess renewable energy production due to curtailment. The simulation results in scenario 3 showed in an NPC of 60,657,462.51 € and a COE of 0.2181 €/kWh.
Scenario 4 combines several technologies to achieve a more balanced and cost-effective system. This hybrid system includes solar PV (6.73 MW), wind (6.30 MW), biomass (2 MW), lithium batteries (3 MWh), and a green hydrogen plant with a 3 MW electrolyzer, a 3,000 kg tank, and a 2 MW fuel cell. The simulation resulted in an NPC of 51,041,021€ and a COE of 0.1840 €/kWh. This scenario, which focuses on all renewable technologies for power generation, is economical and results in the second cheapest simulation. The difference in cost between the first and the second case studies is negligible, suggesting that building a sustainable and cost-effective power generation system using renewable technologies is economically feasible.
Of the four scenarios in which the island’s electricity generation is 100% renewable, scenario 4 requires the least amount of installed renewable power. In also has the lowest amount of energy wasted due to curtailment, about 6.91 GWh/year.
For all scenarios, the useful life of the production equipment was assumed to be 20 years. Based on this assumption, we calculated the unit cost of each production technology, presented in Figure 4.
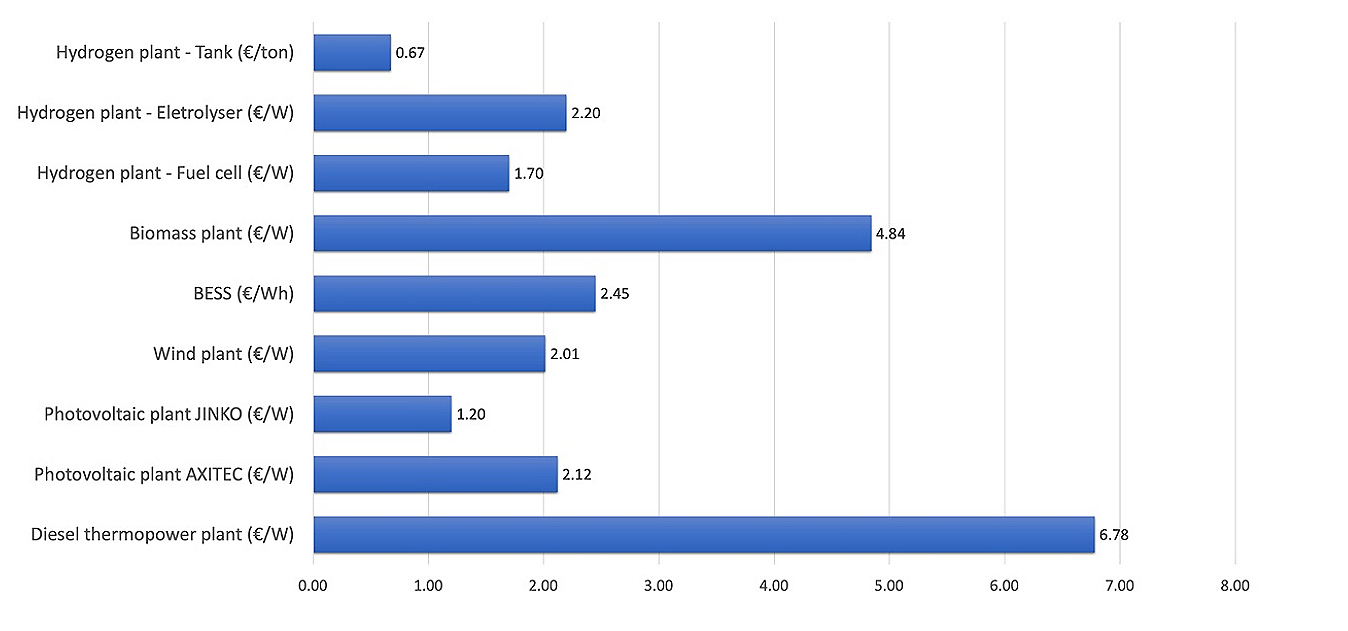 Figure 4. Unit cost per technology. Source: Teresa Nogueira, José Jesus and José Magano.
According to Figure 4, the diesel thermal power plant has the highest cost per installed power unit. At the cost of 1.2074 € per liter of diesel fuel [24], the cost of the plant after 20 years is 32,255,867.20 € which is a considerable amount for an installed capacity of only 4.65 MW. Diesel fuel accounts for 95.01% of the cost of the power plant, while CAPEX and O&M account for the rest. If the price of diesel fuel increases over the 20-year life of the project, the unit cost of the thermoelectric power plant will increase even further.
The biomass plant has a value of 4.84 €/W, the second highest value in this list of production technologies. Of the total cost, 19.67% is attributable to biomass, while the remaining cost is for capital expenditure (CAPEX) and operation and maintenance (O&M). If the price of biomass exceeds 35 €/ton, the previous biomass costs could potentially increase.
The cost of the battery power plant is the third highest at 2.45 €/W of installed capacity. The wind power plant costs 2.01 €/W of installed capacity. The H2 plant has different costs for its components: 1.70 €/W for the fuel cell, 2.20 €/W for the electrolyzer, and 0.67 €/ton for the tank.
For photovoltaic plants, the cost varies according to the modules used. The existing 1 MW plant with AXITEC modules, model AC-250P/156-60S with 250 Watt-peak, costs 2.12 €/W. On the other hand, the photovoltaic solar plant with Jinko modules with 545 watt-peak (Wp), model JKM545M-72HL4-V, costs 1.20 €/W. The difference in cost is due to the reduction in the price of Wp of PV modules from 2015, when the 1 MW solar photovoltaic plant with AXITEC modules was installed, to the present day. The newer modules are more efficient and generate the same power in a smaller land area.
The objective of this research was to investigate different expansion scenarios of the power grid of the island of Graciosa in the Azores, given the current system configuration, 40% of which is still currently dependent on fossil-fueled thermal plant generation, and the possibilities of further combining renewable energies such as the wind, photovoltaic, biomass, and green hydrogen. To conduct such an investigation, four expansion scenarios were run using Homer Pro and PVSyst, software tools for optimizing the design of hybrid renewable standalone microgrids, with the goal of achieving cost-effective configurations and optimizing production, storage, and power grid management. The results show that the most balanced, cost-effective scenario is the one that combines all renewables (scenario 4), resulting in a marginal additional NPC (51041012 € vs. 50072865 €) and COE (0.1835 vs. 0.1800 €/kWh) when compared to the baseline scenario.
Our scenario comparison is characterized by the integration of technical and economic analyses to identify the most appropriate configurations of renewable energy production systems. This approach ensures a tailored fit to Graciosa’s unique characteristics and constraints and is consistent with methodologies outlined in the literature for the deployment of hybrid energy systems on islands. These methodologies consider not only the capacity for energy generation and storage, but also the critical factor of energy security, ensuring that the selected systems are not only efficient and cost effective, but also robust against the various challenges inherent to the island environment.
The conducted research could be instrumental for organizations, including utilities and governmental authorities, in projecting a technical and feasible expansion of islanded hybrid energy systems based on renewable energies. As limitations of the study, it is important to note that it may not capture the full range of real-world operational variability. In addition, the rapid pace of technological innovation could significantly alter the basic assumptions and derived conclusions of our simulations. For subsequent research in this area, a comprehensive strategy that includes political, regulatory, and societal factors could provide a more robust and nuanced understanding of the impacts and implementation of hybrid energy systems.
The dataset of the study is available from the authors upon reasonable request.
TN, JJ and JM designed the study. JJ made the simulations. TN, JJ and JM analyzed the data. TN, JJ and JM wrote the paper with input from all authors.
The authors declare that there is no conflict of interest.
This research was partially supported by Fundação para a Ciência a Tecnologia (FCT), through grant UIDB/04730/2020.
1.
2.
3.
4.
5.
6.
7.
8.
9.
10.
11.
12.
13.
14.
15.
16.
17.
18.
19.
20.
21.
22.
23.
24.
25.
26.
27.
28.
29.
30.
31.
32.
33.
34.
35.
Nogueira T, Jesus J, Magano J. Graciosa Island’s Hybrid Energy System Expansion Scenarios: A Technical and Economic Analysis. J Sustain Res. 2024;6(2):e2400010. https://doi.org/10.20900/jsr20240010

Copyright © 2023 Hapres Co., Ltd. Privacy Policy | Terms and Conditions


