Location: Home >> Detail
J Sustain Res. 2026;8(1):e260025. https://doi.org/10.20900/jsr20260025
 ,
Aaron E. Maxwell 2 ,
Michael P. Strager 3
,
Aaron E. Maxwell 2 ,
Michael P. Strager 3
1 WV GIS Technical Center, West Virginia University, Morgantown, WV 26506, USA
2 Department of Geology and Geography, West Virginia University, Morgantown, WV 26506, USA
3 School of Natural Resources and the Environment, West Virginia University, Morgantown, WV 26506, USA
* Correspondence: Behrang Bidadian
Flood risk, encompassing hazard, exposure, and vulnerability represents major potential losses to society. Multi-variable flood risk models can assist researchers and practitioners in more accurate flood loss analyses. However, such models comprise complexities associated with data and variables. Machine learning techniques that address such complexities and non-linear relationships have primarily focused on flood hazard prediction rather than comprehensive risk assessment and damage estimations. Therefore, there is a need to combine risk elements using such methods. To address this need, this study utilized the Machine Learning Random Forest algorithm to analyze the correlations between the physical flood damage caused by Hurricane Harvey in 2017 in Houston, Texas and hazard-, exposure-, and vulnerability-related variables. This approach offers a clearer understanding of how different risk elements interact to influence damage outcomes, particularly in highly urbanized environments. The methodology provides a robust framework for analyzing non-linear correlations and the combined impact of these variables on flood risk. We also explored the reasons for the unexpectedly low importance of social vulnerability factors in our results compared to the environmental justice concept. These findings and conclusions can provide insights to planners and stakeholders enhancing their understanding of the underlying causes contributing to flood risk. Future research can expand upon this study’s methodology and findings by incorporating additional factors related to climate change.
Flood risk as the combination of inundation hazard, human or physical exposure, and vulnerability of the exposed elements [1–3] is defined in relation to potential damages or losses [3–6]. The above definition considers flood source (e.g., heavy rainfall) and pathway (e.g., floodways and floodplains) as the hazard, the receptors (e.g., at-risk population, buildings, and infrastructure) as the exposure elements, the susceptibility of receptors as the vulnerability, and the probable consequent damages as the risk [7–9].
In a conventional integrated flood risk analysis, the floodplains or inundation zones should be mapped first, then the intersections of the population and assets with those delineated hazard zones should be extracted considering their vulnerability characteristics [6,8,10,11]. After identifying the exposed elements and their vulnerability levels, predictive impact assessment models can be developed to determine the estimated monetary damages and human losses. The flood consequences can be divided into direct (or immediate) human and physical losses and indirect (also known as higher-order) damages such as long-run business interruptions, economic consequences at the regional scale, or long-term social impacts [3,5,10,12].
The conventional models for direct loss estimation typically rely on depth-damage functions considering flood depth and property use type to produce fractions of the structure replacement cost as the potential damage percentages [5,13–15]. However, many of those models exhibit substantial uncertainties due to weak correlations between the losses and flood depth values [5,13–15]. The main reason is that flood risk and damage are influenced by various factors beyond just the water depth [5,13–15]. While these functions are widely used due to their simplicity and data availability, numerous studies have shown that damage outcomes are influenced by a broader set of hydraulic and contextual factors. In more physically based modeling frameworks, additional hydraulic parameters, such as flow velocity, momentum flux, and depth-velocity interactions, are sometimes incorporated to better represent destructive energy and flow behavior. Nevertheless, many empirical loss estimation approaches remain limited to depth-based indicators due to data constraints and considerations of model transferability.
In recent years, a shift has emerged towards multi-variable flood risk models that can assist researchers and practitioners in conducting more accurate comprehensive flood loss analyses with a better understanding of the effective factors. In addition to the inundation depth, such models consider several other influential variables, such as environmental factors, characteristics of exposed structures, and socioeconomic conditions [6,13–15]. However, multi-variable flood risk prediction is a complicated process comprising non-linear relationships with many variables [16–18].
The emergence of artificial intelligence (AI) has brought about transformative changes in flood risk prediction and analysis methods [17,19]. AI refers to the ability of machines, such as computers and robotic systems, to perform tasks that traditionally require human intelligence [20]. Machine learning (ML) techniques, as essential branches of AI, can train computers to process spatial and non-spatial big data and discover patterns or correlations for more accurate predictions [15,21,22]. Additionally, they can address the complexities and non-linear relationships among multiple influential factors associated with flood risk [17,19,22–24]. Researchers increasingly apply automated ML techniques to flood prediction and mapping processes instead of conventional methods [17]. More attention has been paid to flood hazard prediction than comprehensive risk assessment and damage estimations [10,25,26]. A cause for this trend is the presence of uncertainties in the currently available flood zone maps.
Understanding the vulnerability of exposed populations and assets is critical for appropriate flood risk mitigation and communication efforts [10,25]. Socioeconomic or demographic attributes such as income, race, ethnicity, age, household composition, and housing characteristics can contribute to social vulnerability, affecting people’s ability to anticipate, respond to, and recover from natural disasters [1,8,27–30]. Despite the potential of machine learning in integrating social vulnerability into flood risk and loss studies while addressing non-linearity and complexity, only a few recent studies [23–25] employed socioeconomic data to investigate the vulnerability in their models.
The parameters used in multi-variable flood risk models, also referred to as conditioning factors, are primarily location-based. The above statement pertains to the environmental or geomorphological factors, some of which may hold significant influence in one location but may not be effective in another study area [17,18]. Similarly, the same principle applies to socioeconomic variables that determine human exposure and vulnerability, as they are contingent on the specific social context of a given area [4,29]. Thus, the conditioning factors in flood risk models may differ in terms of importance degrees based on the region. The decision about these levels is a challenging task. For example, when developing the social vulnerability index (SoVI), the researchers adopted an equal contribution level for all factors due to the lack of a robust method for assigning weights [29]. They mentioned the development of a reasonable weighting scheme as a future need [29]. Machine learning models have the capability to determine the importance degree of each variable used in regression or prediction processes [15,24,31]. This ability can aid in understanding and interpreting the results of risk models more accurately [24]. By identifying the relative contributions of different variables, researchers and stakeholders can gain a deeper understanding of the factors driving risk and make informed decisions based on the model outputs.
Many experts involved in social vulnerability analyses hold the view that there is an unfair distribution of natural disaster risk resulting from environmental inequity [8,27]. According to several authors, socially disadvantaged groups, for example the poor and racial minorities, not only face higher vulnerability but also experience a greater likelihood of exposure to natural hazards like floods [4,8,11,27,32]. However, some recent analyses in the United States [25,33,34] indicated contrary findings, not in harmony with the above environmental justice notion. Their experiments revealed that racial minorities or economically disadvantaged people were less likely to reside in hazardous flood zones. Therefore, further studies employing ML techniques are still needed to assess and validate the environmental equity concept in different locations.
This study aimed to fill a current research gap in the area of comprehensive multi-variable flood loss analyses and assessment of the environmental justice notion in order to better understand the factors that significantly influence flood risk levels in the study area and determine their respective contribution levels in relation to the above concept. Specifically, it addressed the question: What role do environmental and socioeconomic characteristics play in shaping flood risk in urban areas? As the primary goal, the experiment tested this hypothesis in Houston, Texas as the study area: Flood risk correlates with certain environmental characteristics and socioeconomic attributes of urban communities. Appropriate ML methods in conjunction with geospatial technologies were employed for regression analysis of the data to uncover relationships between environmental factors, development patterns, human characteristics, and flood loss. We considered the monetary damages caused by Hurricane Harvey in 2017 declared in the flood insurance claims published by the Federal Emergency Management Agency (FEMA) as an indicator of flood risk. We examined conditioning or predictor variables and their significance level in the risk prediction process categorized into three main groups: hazard-, exposure-, and vulnerability-related factors.
This paper expands upon prior research pertaining to flood risk assessment and introduces a novel approach to conducting a comprehensive risk assessment centered around the impacts of a specific past disaster. This study integrates a diverse array of risk indicators, possessing distinct natures, sourced from multiple references in the literature. This comprehensive approach forms the basis for a meticulous analysis, combining disparate elements to provide a nuanced understanding of the complexities associated with flood risk. The utilization of varied indicators from different sources underscores the robustness of the methodology, ensuring a thorough examination that incorporates multifaceted dimensions of risk. For this purpose, Machine Learning was employed as a tool to overcome the data complications and answer questions about the risk factors. This approach not only enhances the depth of the analysis but also contributes to the overall reliability and validity of the findings, establishing a solid foundation for thorough risk assessments. A primary objective of this study is to provide findings to aid Houston, as an example of a large city significantly impacted by flood risk, in the future planning and management of flooding.
Moreover, the universal insights to extend knowledge in the field by this article can be summarized as follows. The methodology articulated herein can be adapted to conduct comprehensive multi-variable disaster risk assessment studies in diverse geographical contexts. This paper advocates for integrating multiple environmental, demographic, and socioeconomic factors into flood risk assessment analyses with appropriate quantification, standardization, and data handling methods. Furthermore, this work introduces a methodology for analyzing big data of certain records derived from past disasters to extract insights for future risk assessments. Notably, it represents a location-based approach for determining the significance of various indicators and assigning weighted values to them, thereby enhancing the accuracy of future risk estimations.
Beyond its contribution to flood damage modeling, this study advances the broader sustainability discourse by providing an integrated framework for identifying where hazard, exposure, and vulnerability intersect. Such knowledge is essential for advancing sustainable urban development, climate adaptation planning, and equitable resilience strategies in rapidly urbanizing metropolitan regions.
The remainder of this paper is organized as follows. The first section describes the study area and the spatial units of analysis, selection of response and predictor variables, data collection and processing, and the ML modeling process. Next, the results obtained from the spatial analysis and machine learning model are presented. Then, the discussion section interprets the results in terms of their significance, addresses methodological limitations, and compares the study with previous efforts. Finally, the conclusions section summarizes the most critical findings, discusses their implications and contributions to the field, and suggests potential directions for future research.
Houston, one of the major cities in the United States, has gained a reputation for experiencing recurrent instances of flooding that significantly impact its urban area. The most recent catastrophic event in Houston was the flooding triggered by Hurricane Harvey in 2017 resulting in the tragic loss of 68 lives and causing approximately 125 billion dollars in physical damage in the state. On 2017 Aug 25, Hurricane Harvey made landfall in the vicinity of Rockport, Texas unleashing winds surpassing 240 km per hour. As the storm progressed inland, its pace decelerated, leading to the accumulation of unprecedented rainfall in southeastern Texas. In certain locations, the rainfall persisted for eight consecutive days, surpassing 1520 mm (60 inches) in magnitude. This quantity exceeded the average annual rainfall levels for eastern Texas and the coast by approximately 380 mm (15 inches) [35]. The impact of Hurricane Harvey on Houston was primarily attributed to the devastating flooding caused by record-breaking rainfall rather than wind damage or storm surge [36].
Houston is located in the southeastern region of Texas in close proximity to Galveston Bay and approximately 80 km away from the Gulf of Mexico. The city of Houston is situated at the convergence of major interstate highways, specifically I-10, I-45, and I-69. In terms of racial and ethnic composition, Houston stands out as one of the most diverse cities in the United States. According to the 2020 decennial census (DEC), its demographic makeup includes a population with 32% identifying as white, 23% as African-American, 7% as Asian, 1% as American Indian or belonging to other Native groups, 21% as belonging to other races, and 16% as individuals of mixed-race heritage [37]. From a topographical standpoint, Houston falls in the Coastal Plain physiographic province and has been developed in a predominantly flat, low-altitude region. The urban area within the city limits encompasses approximately 1554 km2. Additionally, the municipality holds certain rights and responsibilities in the adjacent metropolitan area known as the extraterritorial jurisdiction (ETJ). The ETJ is an area extending eight kilometers (five miles) beyond the city’s primary limits except where it intersects with another municipality or jurisdiction [38].
The bayous in Houston can be tranquil under normal weather conditions. However, during the occurrence of Hurricane Harvey in 2017, all 22 bayous in the region surpassed their capacity, resulting in extensive flooding [36]. Among these waterways, Buffalo Bayou stands as the largest, flowing through the city until it meets the San Jacinto River at Galveston Bay, which then connects to the Houston Ship Channel. There are two large reservoirs in the western part of the area called Addicks and Barker constructed by the U.S. Army Corps of Engineers to mitigate flooding. Both reservoirs reached their emergency spillway levels during Hurricane Harvey [36].
For this study, census tracts of 2017 provided by the U.S. Census Bureau were the units of analysis and model development [39]. Census tracts serve as subdivisions within the United States counties for which detailed demographic data collected by the Census Bureau are publicly accessible. These tracts are typically delineated based on the assumption of demographic homogeneity, making them suitable units for various planning and government purposes [30]. In addition, the census tract level was chosen for the analysis because most of the required data for this study were available at this scale. However, certain limitations should be considered. One such limitation is the Modifiable Areal Unit Problem (MAUP), a common issue in spatial statistics. MAUP occurs when the outcomes of geospatial analyses are influenced by the scale and method of aggregation used for data collection units. This means that the results of spatial analyses are sensitive to the chosen scale and the size of the study areas [40]. As a result, conducting similar analyses at a scale other than census tracts could lead to different outcomes. Specifically, in this study, using census tracts as the geographic unit may have influenced the correlations observed between the predictor variables and flood damage, as well as the variable importance results. It is important to recognize and account for this issue when applying the study's findings to other levels of analysis. While the MAUP effect cannot be fully removed, conducting comparable follow-up analyses at finer spatial scales, such as block groups or individual properties, within the same study area could help clarify the extent to which results are sensitive to scale and provide a way to estimate the magnitude of any bias.
The study area encompassed the portions of the city limit and ETJ situated in Harris County. Some adjustments were made at the edges to align with the boundaries of the census tracts, ensuring consistency and accuracy in the area. For that purpose, the tracts that partially intersected the designated area were retained for analysis only if their centroids fell within the boundaries of the study area (Figure 1). Certain census tracts, primarily those encompassing large non-residential lots such as the airports and universities, were excluded from the study due to incomplete availability of demographic data. Finally, a total of 678 census tracts remained as the study units, covering an area of 3760 km2. Based on the 2017 American Community Survey (ACS), the population residing in this region amounted to 3,994,164 individuals during that year [41].
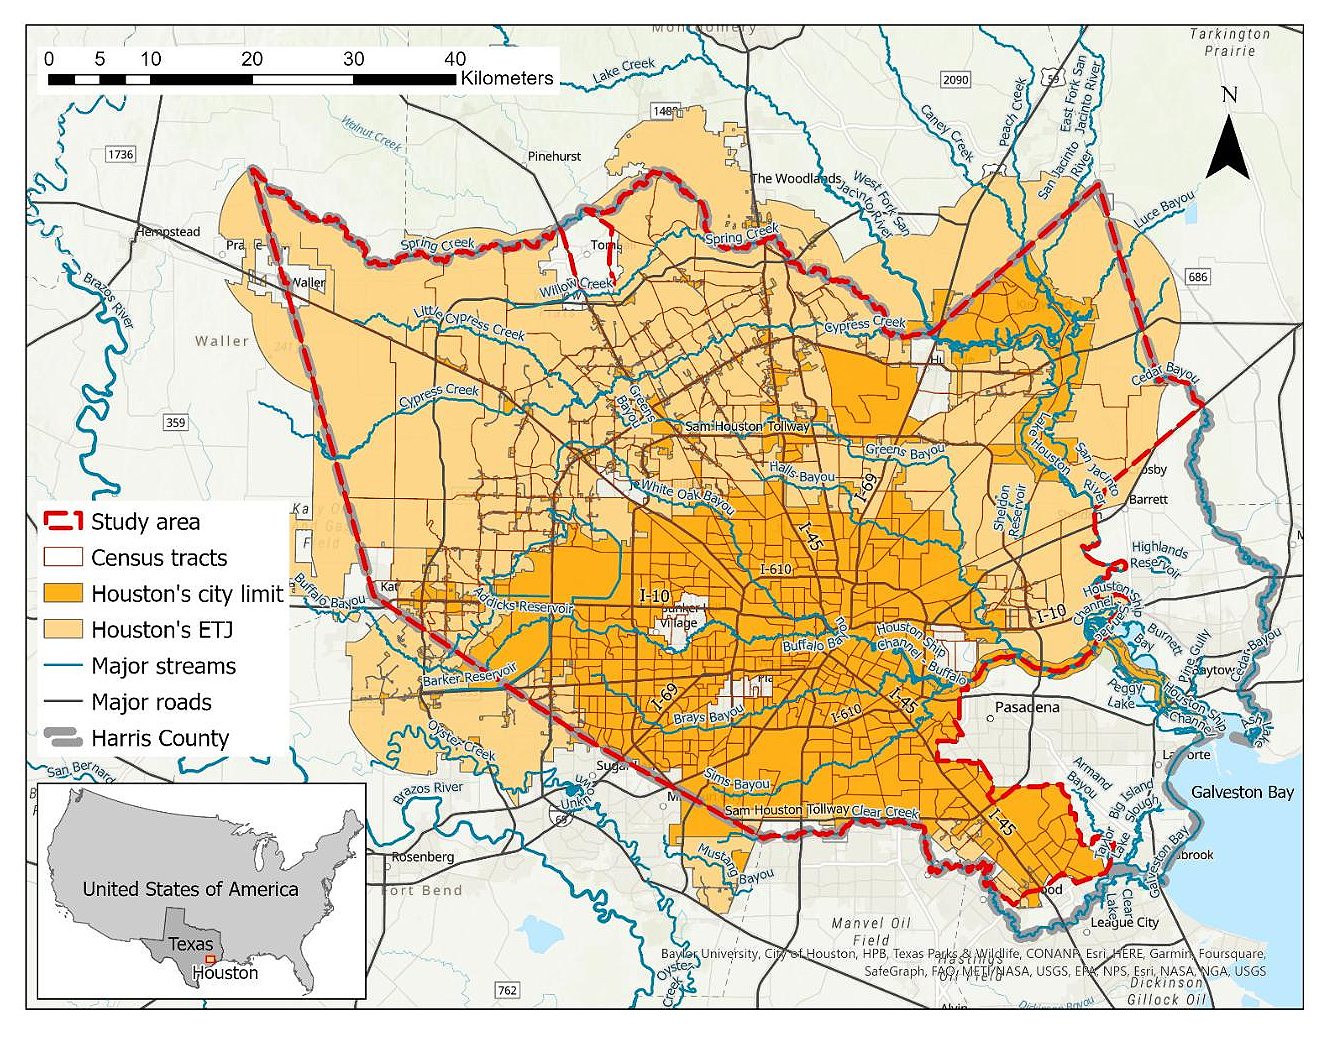 Figure 1. Houston study area, census tracts, city limit, and extraterritorial jurisdiction (ETJ).
In this study, we investigated the damage ratios of flood insurance claims made through the National Flood Insurance Program (NFIP) in response to Hurricane Harvey in 2017 in Houston. The above ratios were specifically limited to the direct physical losses incurred by the buildings. The damage data, which were published by FEMA, served as the response or dependent variable to be modeled against the potentially influential factors. FEMA has redacted the physical addresses and coordinates in the data to protect individual privacy. Therefore, it was not possible to accurately identify the specific locations of the loss claims at the property level. However, the corresponding census tracts were recognizable through the use of the provided Census Bureau’s 11-digit codes. Using the above dataset, we calculated the damage percentage for each claim by dividing the amount of building damage by the value of the building property as estimated in the claim dataset. Then, the average damage ratio was computed for each census tract to be utilized as the dependent variable in our analysis.
This study expanded upon previous research [17,18,23–25] by employing a more comprehensive approach to analyze the impact of diverse factors on the damages reported in flood insurance claims. It incorporated various variables identified as potential contributors to flood losses derived from these studies and integrated all of them in a correlation model aiming to offer deeper insights into the significant factors influencing flood risk. We examined the correlation between the average damage ratios and 17 predictor variables, which were categorized into three main groups. The first group consisted of environmental or geomorphological hazard-related factors that were identified in the literature as having a significant impact on flooding. Within this group, we considered variables such as elevation, land surface curvature, the path to the streams affected by slope or flood source cost distance, and the presence of poorly drained soils. More details of these parameters are explained in the data collection and processing subsection.
The second group of predictor variables focused on flood exposure. We investigated population density in the census tracts as a measure of human exposure, and we also took into account the intensity of developed land cover as an indicator of physical exposure. Population density correlates with the distribution of housing units [42,43]. Consequently, it can also represent the physical exposure of residential buildings.
Land use/land cover (LULC) data are often appropriate for flood exposure assessments on the macro scale, particularly in the context of cities and metropolitan regions [8,10]. The National Land Cover Database (NLCD) includes four classes of developed lands. First, developed, open space encompasses parks, golf courses, single-family housing units in large lots, and green spaces in developed environments for recreational or aesthetic purposes and erosion control. Impervious surfaces such as roads, buildings, and paved areas, occupy less than 20% of the total land cover in this class. Second, developed, low-intensity comprises areas characterized by a combination of constructed materials and vegetation wherein impervious surfaces account for 20% to 49% of the total land cover. These areas are mostly associated with single-family housing units, striking a balance between constructed elements and natural vegetation. Third, developed, medium-intensity denotes areas characterized by a blend of constructed materials and vegetation, where impervious surfaces constitute 50% to 79% of the total land cover. These areas are typically associated with the presence of single-family housing units, reflecting a higher proportion of built environment in relation to natural elements. Fourth, developed, high-intensity refers to areas with a dense concentration of structures where a significant number of people reside or work. This category includes apartment complexes, row houses, and commercial or industrial establishments. Impervious surfaces occupy 80% to 100% of the total land within these areas, indicating minimal natural vegetation [44]. In this study, we excluded the developed open spaces from consideration due to the absence of a significant number of primary insurable structures in those parts.
As the third group of independent variables, we incorporated vulnerability-related socioeconomic factors that were derived from the literature. These variables were selected to capture dimensions of social and economic vulnerability that may influence both exposure to flood-prone environments and the capacity to prepare for, respond to, and recover from flood events. Established social vulnerability frameworks emphasize the roles of socioeconomic disadvantage, demographic structure, employment, educational attainment, and housing tenure in shaping hazard impacts [24,27–30]. Research on environmental injustice and flood risk has further highlighted how minorities and socially marginalized populations may experience differential exposure and recovery challenges [29,30], including in Houston [27]. Machine-learning-based flood damage studies have similarly incorporated socioeconomic and demographic predictors to improve explanatory performance [16,24,25]. The renter-occupied ratio was included as an indicator of housing tenure, which has been incorporated into many social vulnerability frameworks. Housing tenure may influence access to mitigation resources, insurance coverage, and recovery capacity [29,45]. The non-citizen ratio was included as an indicator of potential structural barriers affecting disaster preparedness and recovery, as prior research has documented uneven access to assistance and post-disaster support among socially marginalized populations [27,45].
The 2017 American Community Survey (ACS) was the source for collecting the data relevant to poverty, unemployment, race, ethnicity, citizenship status, age, education, and housing characteristics such as median housing value and the ratio of renter-occupied residential units [40]. Table 1 presents all variables that were utilized in the spatial and correlation analyses categorized into the aforementioned groups.
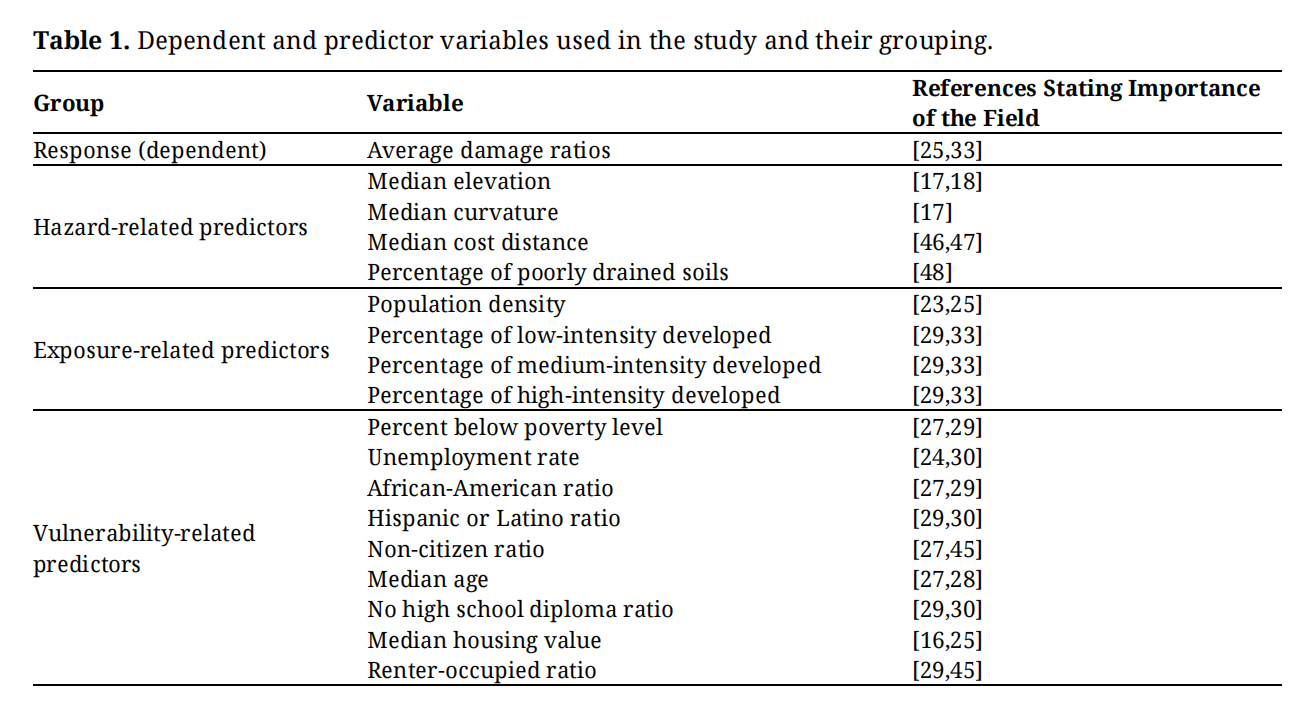 Table 1. Dependent and predictor variables used in the study and their grouping.
Table 2 provides descriptions for the variables analyzed in the present study. Further information regarding the data sources associated with these variables is delineated in the next section dedicated to data collection and processing.
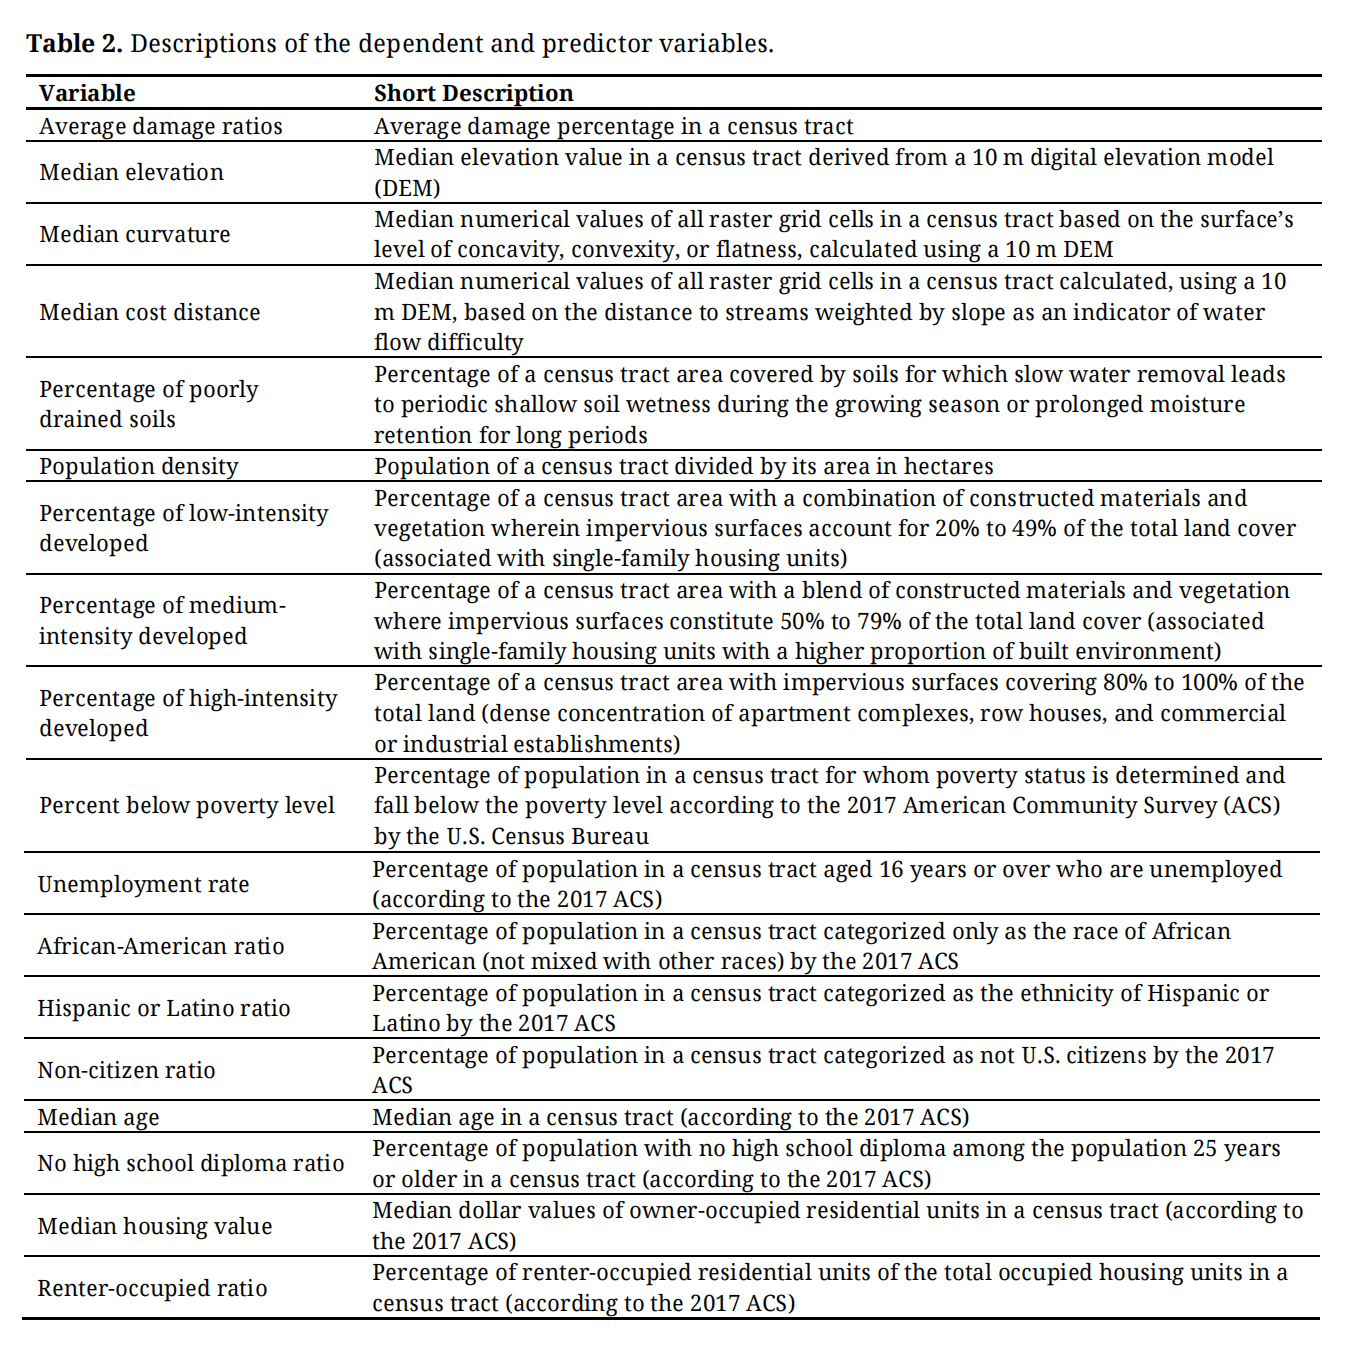 Table 2. Descriptions of the dependent and predictor variables.
The FEMA NFIP Redacted Claims (v2) were downloaded from OpenFEMA database [49]. This version of the dataset, including over 2.5 million flood insurance claims transactions nationwide, has been derived from the National Flood Insurance Program (NFIP) record system to list comprehensive information on claims filed from 1978 up until May 2023. We employed the data analysis software of R (R-4.2.3) [50] to extract the relevant records pertaining to Hurricane Harvey within the designated study area.
National, state, and local sources were used to collect the required data for the hazard-related variables. The 10 m digital elevation model (DEM) utilized in the elevation processing was obtained from the Houston–Galveston Area Council (H-GAC) website [51]. We produced raster grids of slope and curvature with a 10 m cell size based on the above DEM using ArcGIS Pro version 3.1 [52]. The curvature grid assigned a numerical value to each cell based on the surface’s level of concavity, convexity, or flatness. In order to map the streams, we relied on the 1:24,000 (24k) National Hydrography Dataset (NHD) downloaded from the United States Geological Survey (USGS) database [53]. Instead of a Euclidean distance measure, we created a raster grid of cost distance to the streams, weighted by slope, employing ArcGIS Pro [52], to account for terrain-related conditions that may impact floodwater movement. The integration of distance and slope in this variable was aimed at offering a more holistic assessment of the risk effects arising from both stream proximity and topographic characteristics. Figure 2 displays the developed cost distance grid. To acquire data on soil types and their drainage characteristics, we accessed the Soil Survey Geographic Database (SSURGO) provided by the Natural Resources Conservation Service (NRCS) under the United States Department of Agriculture (USDA). We used ESRI’s SSURGO Downloader web-based application to download the relevant data [54] and extracted the percentage of census tract areas covered by poorly drained soils. This category combines the detailed soil drainage classes of very poorly drained, poorly drained, and somewhat poorly drained as mentioned by the NRCS. Such poorly drained soils exhibit slow water removal, resulting in wet conditions at shallow depths for extended periods during the growing season. Internal free water is typically shallow to moderately deep and may persist or be transitory, markedly impeding the growth of mesophytic crops without artificial drainage. Common attributes include low saturated hydraulic conductivity, high water tables, additional water from seepage, and susceptibility to nearly continuous rainfall. Additionally, these soils may feature level or depressed terrain prone to ponding, with the potential for increased slope gradients in periods of high or continuous rainfall [55].
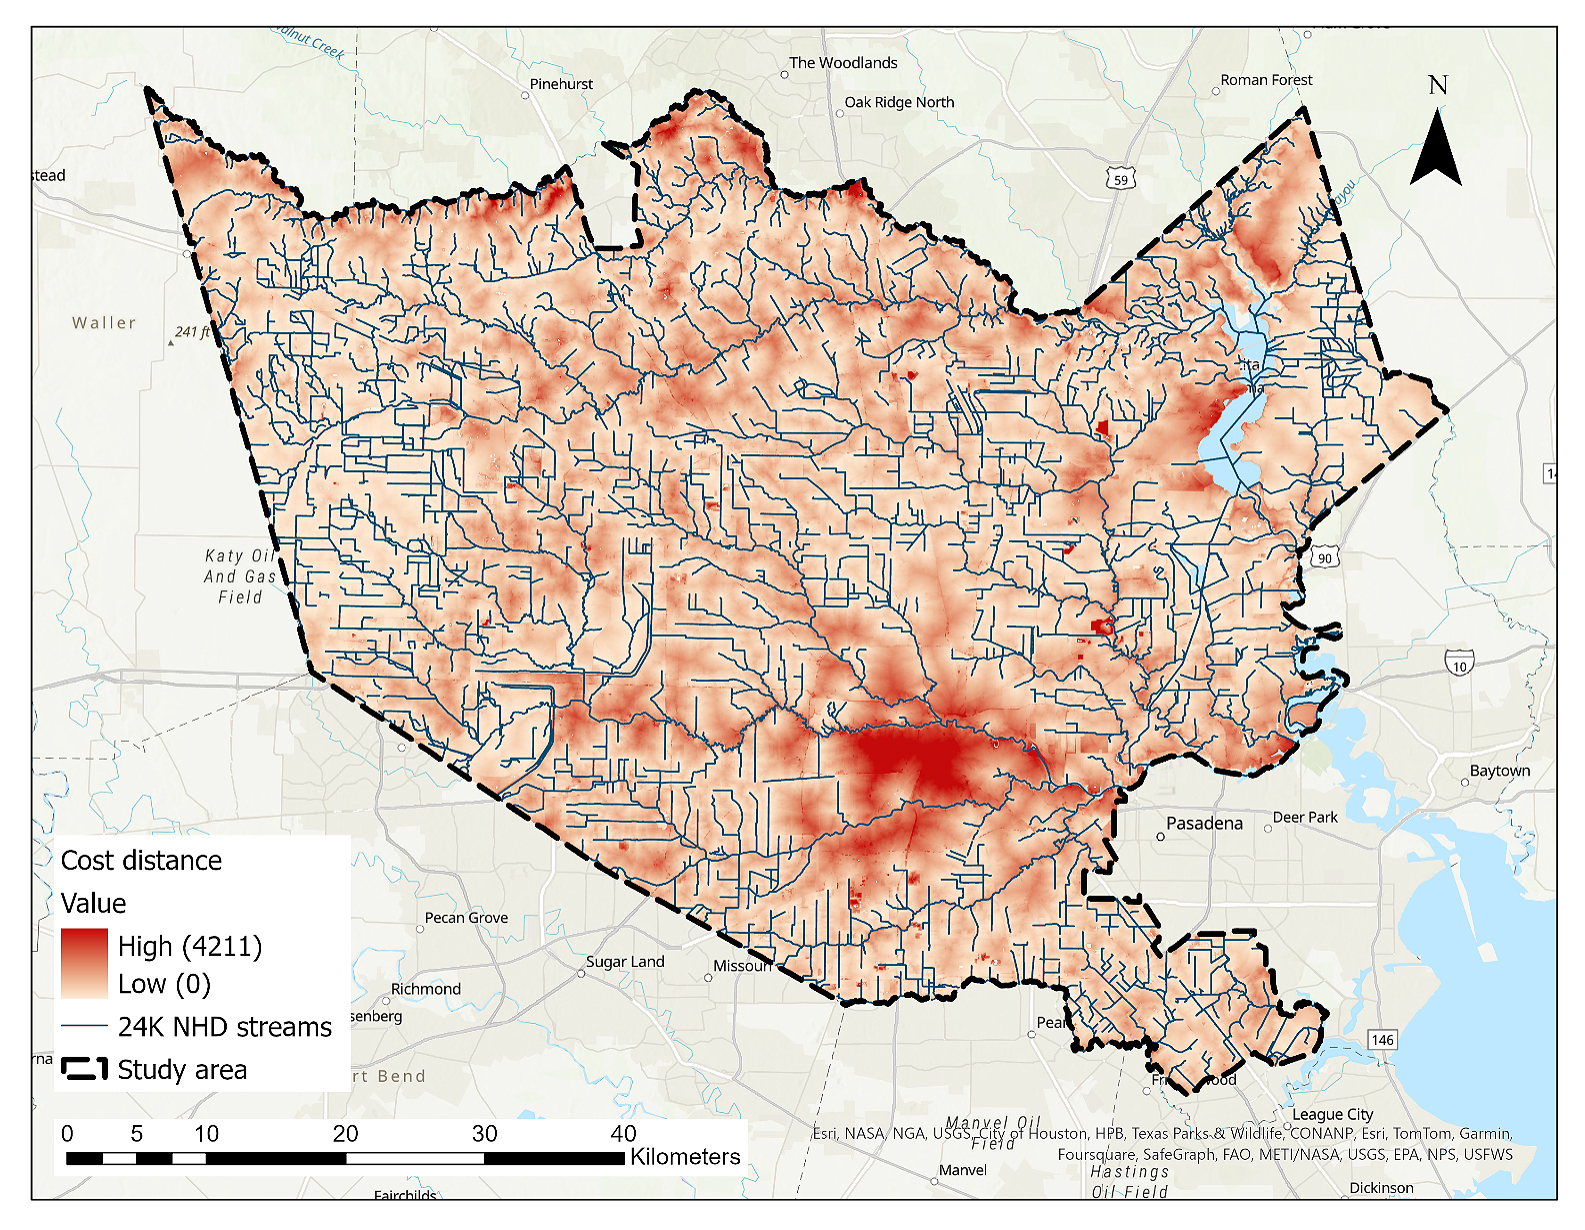 Figure 2. Cost distance raster grid developed in relation to 1:24,000 (24k) National Hydrography Dataset (NHD) streams.
The 2016 30 m National Land Cover Database (NLCD), acquired from the Multi-Resolution Land Characteristics Consortium (MRLC) website, was the source for extracting the developed areas in three categories of high, medium, and low intensity [56]. This dataset includes raster grids of multiple land cover classes among which there are four categories related to developed land: Developed, Open Space; Developed, Low Intensity; Developed, Medium Intensity; and Developed, High Intensity. In this study, we used ArcGIS Pro [52] to extract the raster grids of the latter three classes from the dataset, as the focus was on the built environment rather than open spaces. The selection of the 2016 dataset was approximately aligned with the occurrence time of Hurricane Harvey, ensuring temporal relevance for our analysis. Population density for each census tract was determined by dividing the total population, as per the 2017 American Community Survey (ACS), by the area of the tract measured in hectares [40]. The same data source was used to access the needed demographic and socioeconomic data for the development of the social vulnerability variables described earlier. The 2017 ACS was preferred among the datasets due to its temporal alignment with Hurricane Harvey.
To identify the values of predictor variables on insurable buildings, we utilized the building footprints (v2.0) published by Microsoft in 2018. This is an open-source dataset comprising more than 125 million building footprints in the United States and was created using AI-assisted mapping techniques developed on high spatial resolution aerial images. The data are publicly available on the associated GitHub website [57]. We selected the footprints within the defined study area and mapped their centroid points. Then, we extracted the values of hazard- and exposure-related variables for each centroid point by referencing the corresponding raster grids. Finally, we removed the points with null values such as those slightly outside or very close to the study area boundary. We were left with a total of 1,189,569 remaining centroid points, each assigned with the relevant predictor values in 678 tracts.
Machine Learning Model DevelopmentIn this study, we decided to employ suitable machine learning techniques for the main correlation analysis. This choice was driven by the capability of ML to effectively handle the anticipated complexity and non-linear relationships among the variables utilized in our analysis. Machine learning algorithms are computer programs that can be trained to discover data patterns to conduct predictions [22]. Different algorithms may be applied in ML models based on the purpose and data. Random Forest (RF) is a type of algorithm widely used in flood-related studies [18,23,25]. Random Forest, which works based on creating several decision trees is an appropriate method for extracting correlations or regressions as well as classification. This algorithm utilizes the majority “vote” from all decision trees to establish the final class for each unknown input. This strategy addresses the potential suboptimality of individual trees by incorporating multiple trees to achieve a more accurate global result. Each tree is trained on a randomly selected subset of the training data and employs only a subset of the available variables. While this may reduce the accuracy of individual trees, it also lowers their correlation, ultimately leading to a more reliable ensemble as a whole [58]. As a major concern of working with powerful ML algorithms, overfitting can occur when a learning algorithm generates a hypothesis that fits the training data extremely well but fails to generalize to unseen data. The overfitted model has learned the training data so precisely that it may incorporate noise or irrelevant patterns leading to poor performance when applied to new, unseen data [58]. One advantage of RF is its inherent capability to mitigate the overfitting problem by employing an ensemble of multiple decision trees each trained independently on a randomly selected subset of the training data. It also only allows for a subset of the available predictor variables to be selected from at each decision node. The goal of using a subset of the training data in each tree in the ensemble and a subset of the variables at each decision node is to reduce the correlation between the trees in the ensemble and potentially reduce overfitting and improve generalization [18]. Another benefit of Random Forest is its high ability to estimate the contribution of each variable used in the model, often referred to as variable importance [18,31,58]. Moreover, it generally shows an acceptable tolerance to outliers and noise in data as well as the correlations among the predictor variables [18]. The RF algorithm is highly applicable to flood hazard risk assessment as it effectively addresses highly interactive multi-variable and non-linear correlations, making it a valuable tool for capturing complex relationships and providing robust predictions [18].
We developed the machine learning model using RF algorithm on the 678 census tracts in R (R-4.2.3) [50]. First, for each census tract, the values of elevation, curvature, and cost distance extracted for the centroid points in that tract were summarized by calculating their median values. Then, the proportions of points within each tract were calculated to determine the distribution across various development intensities, specifically low-, medium-, and high-intensity developed lands. Additionally, the percentages of points situated on poorly drained soils, including the dominant condition classes of very poorly, poorly, and somewhat poorly drained soils, were also calculated and assigned to their respective census tracts. Furthermore, we incorporated the collected data on vulnerability-related variables and population density for each census tract. Before constructing the machine learning model, a random selection process was employed to divide the census tracts into two, non-overlapping groups for training and validation. The training dataset comprised 70 percent of the total census tracts, while the remaining 30 percent constituted the validation set. Following the completion of model training, an evaluation process was conducted to assess its performance using the validation dataset. Relevant metrics were generated to gauge the performance which served as quantitative measures of how well the model generalized to the unseen data. Specifically, we investigated the root of mean square error (RMSE) and mean absolute error (MAE) values to evaluate the accuracy of the model.
The Random Forest model was implemented using the caret package [59] in R. Each model was trained with 1000 trees, providing stable predictions while keeping computation manageable. The number of variables considered at each split was tuned automatically over 10 candidate values, with the best value selected using 10-fold cross-validation. This approach was chosen to ensure the model captures relevant predictor information without overfitting. All other hyperparameters were left at their default values, which are generally robust for datasets of this size.
Finally, we carried out an importance analysis to assess the contribution level of each predictor variable while being included with the other ones to the damage ratios. The variable importance measures generated by Random Forest algorithms can demonstrate to exhibit bias when dealing with highly correlated variables [31,60]. To investigate the above issue, we performed a Spearman’s correlation test [61], a measure of non-linear, monotonic correlation. According to the findings illustrated in Figure 3, significant correlations were found between certain variables. For instance, a positive relationship was observed between the ratio of Hispanic or Latino population and the ratio of individuals without a high school diploma (p-value = 0.883), as well as between the percentage of high-intensity developed lands and the ratio of renter-occupied households (p-value = 0.658). There were also instances of high negative correlation such as between the percentages of developed lands of high and low intensities (p-value = −0.580) or between the median age and the ratio of the Hispanic or Latino population (p-value = −0.540). Therefore, we applied a conditional permutation importance (CPI) analysis utilizing the “permimp” package in R that considers correlation in the importance calculation [62]. The method is based on comparing the prediction accuracy before and after permuting each variable to assess its impact on the model’s performance. In conjunction with the Random Forest model, the package conducts importance analysis iteratively for each variable, evaluating at each tree of the model and subsequently averaging the results across all trees [24,31].
The random forest model was trained using a subset of 474 randomly selected entries, accounting for 70% of the dataset. All the predictor variables were included in the training process. Following the training phase, the model’s performance was evaluated on the remaining 30% of the dataset which was held out for validation. By examining the root of mean square error (RMSE) and mean absolute error (MAE) values, we assessed the level of accuracy the model achieved in the prediction of the unseen data. The results indicated that the model achieved an RMSE of 12.8 percent measuring the average magnitude of the errors between the predicted and actual damage ratios. Additionally, the MAE was found to be 10.7 percent representing the average absolute difference between the predicted and actual values.
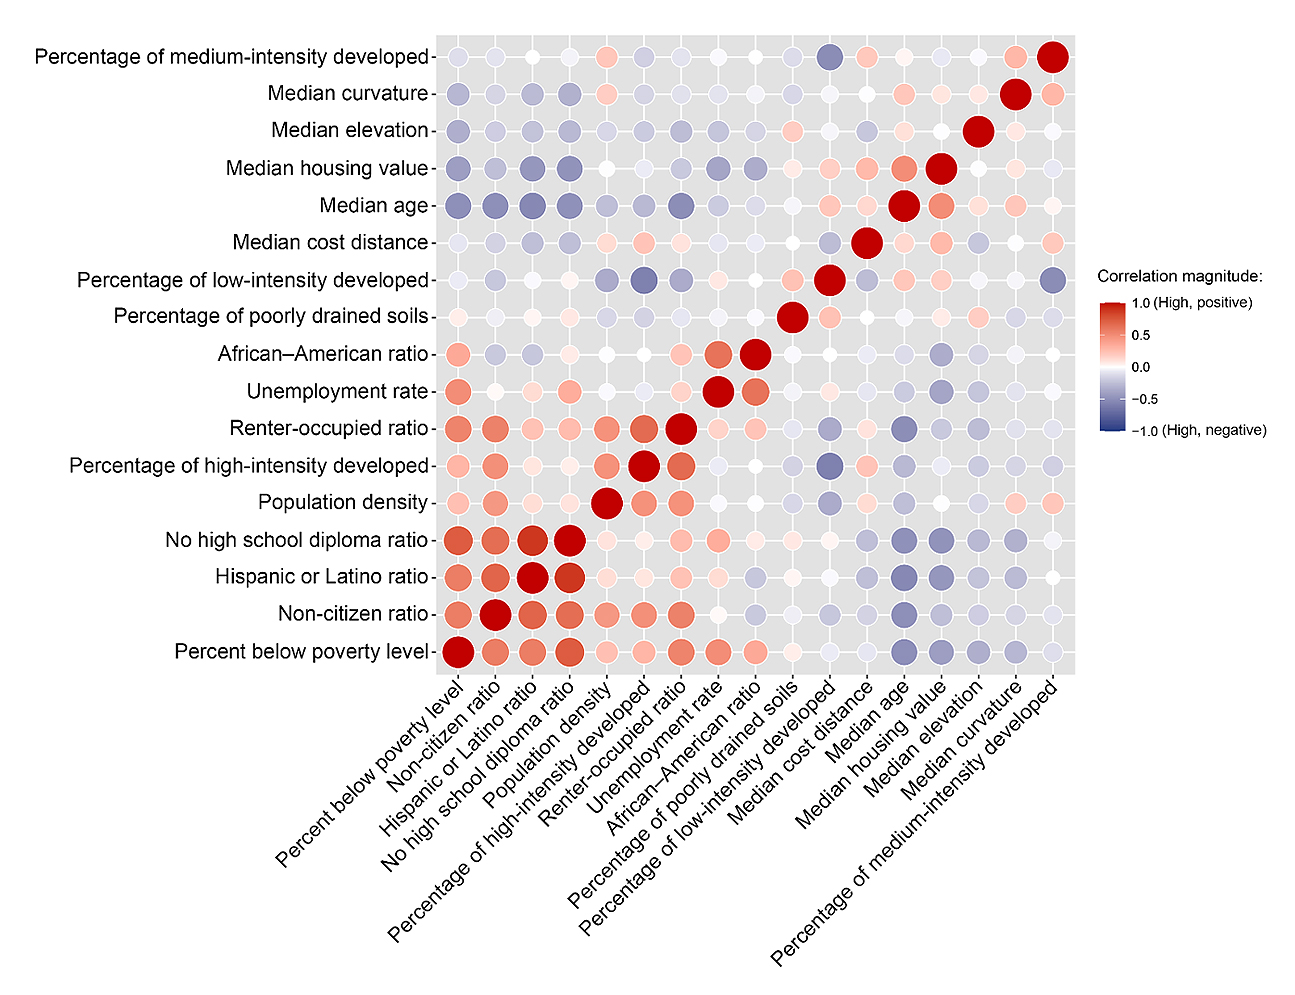 Figure 3. Result of correlation analysis among the predictor variables.
To further investigate the contribution of each variable to the damage ratios, a conditional permutation importance (CPI) analysis was conducted with a threshold of 0.65. One reason for selecting this threshold value was the significant correlations among the variables, as explained earlier. Lower thresholds, particularly those below 0.5, would render the model more conditional and limit its practical value in case of these correlations [31]. We tested several threshold values greater than 0.5 and determined that the selected value (0.65) was the optimal choice. This value was selected as a practical choice. We found that the ranking of the most important predictors remained consistent across nearby threshold values (e.g., 0.6 or 0.7), while the less important variables showed some variation. Therefore, the main conclusions regarding the key drivers of flood damage are robust to the threshold used. To better understand the variables’ importance in a more comparable way, we employed a min-max scaling method to normalize the positive CPI scores. This involved rescaling the CPI scores to a 0–1 range. We determined the maximum and minimum scores, excluding negative values, and calculated the range. Subsequently, we subtracted the minimum CPI from each score and divided it by the range, Equation (1). CPI values were set to zero for all negative scores.
Following the acquisition of results from the machine learning model, a complementary correlation analysis was conducted among the most significant variables to ensure that highly correlated variables were not redundantly selected as the most influential factors. In essence, the aim was to avoid addressing similar variables multiple times as the most important indicators of flood loss.
Variable Spatial Distribution AnalysisIn addition to the correlation analysis, flood damage ratios and predictor variables utilized in this study were spatially visualized using ArcGIS Pro to examine their distribution within the urban area and their relationship to the census tracts. These maps offer insights into the concentration areas of variables within the city and can serve various planning purposes, such as identifying vulnerable areas for targeted mitigation efforts or informing urban development strategies. The maps related to the most significant variables based on the study results are presented in the next section. In these maps, the values are classified using the natural breaks method. This statistical technique identifies meaningful categories within the dataset by utilizing its distribution to group values into classes. This approach minimizes variance within each group while maximizing variance between different groups. The natural breaks method is particularly effective in highlighting patterns in data while making it easier to interpret and analyze geographic distributions [63].
Figure 4 serves as a graphical summary of the methodology, illustrating the connections between the data and processes employed in this study. It provides a visual guide for understanding the research workflow.
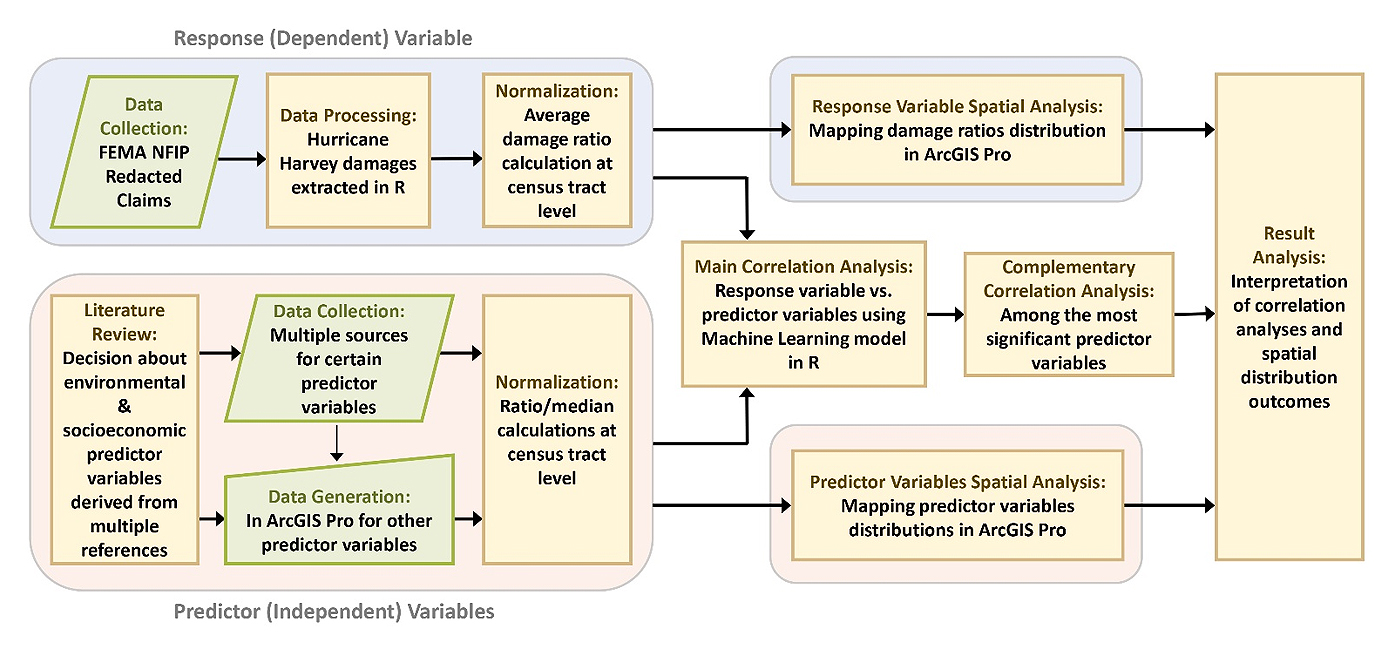 Figure 4. Methodology graphical summary.
The study’s findings highlight the variables among the studied hazard-, exposure-, and vulnerability-related factors that show the most significant correlation with damage ratios. The results also offer insights into the summary statistics and spatial distribution of flood damages caused by Hurricane Harvey, along with the analyzed predictor variables across the study area. These findings are crucial for understanding the patterns of flood damage as well as the factors contributing to it and can inform future mitigation and preparedness efforts in similar disaster scenarios.
The analysis of the NFIP flood insurance records revealed that Hurricane Harvey resulted in building damages amounting to a total of 4.33 billion dollars claimed in the designated study area. The census tracts studied experienced average damage ratios ranging from zero to 86.3 percent. Figure 5 illustrates the distribution of these loss ratios, classified into five distinct categories using the natural breaks method.
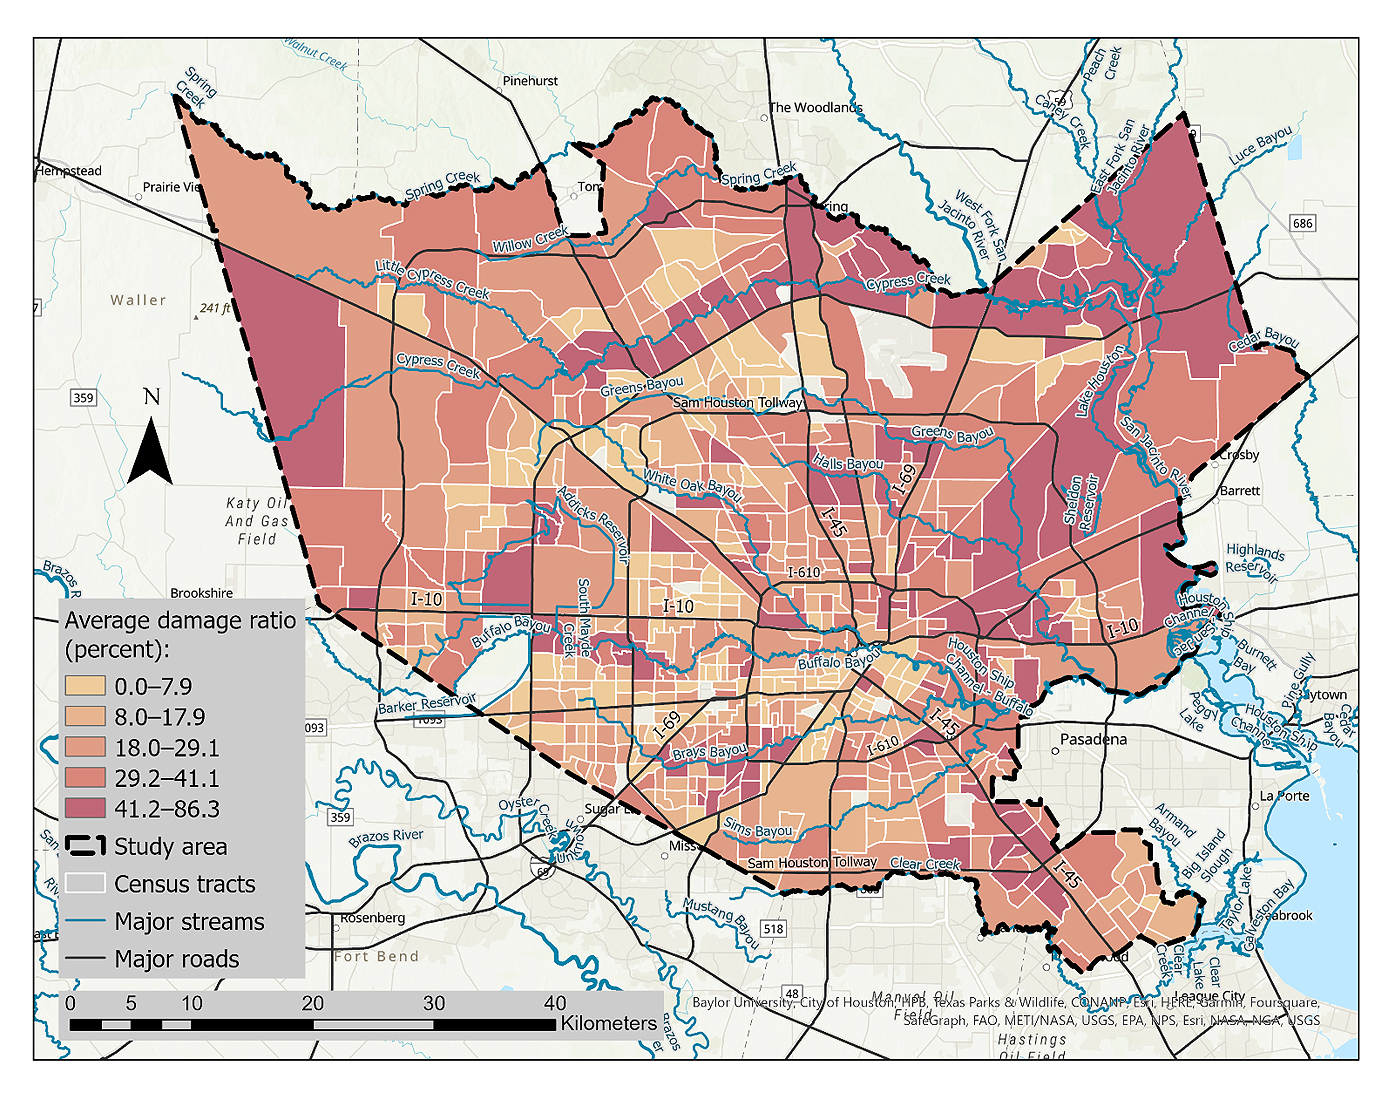 Figure 5. Average damage ratio by census tract based on the National Flood Insurance Program (NFIP) redacted claims.
The DEM analysis showed that the elevation varied between −7.3 and 99.0 m in the entire study area indicating a range of about 106 m. Specifically, the median elevation values of the studied census tracts derived from the building footprint centroids ranged from 5.2 to 67.9 m. The minimum median values were observed in the southeastern region while the highest elevations were found in the northwestern part of the city. The produced curvature grid affirmed the prevalence of flat terrain in the tracts, with the exception of minor man-made modifications in the urban area and along streams. The flood source cost distance grid revealed that the most challenging movement of floodwater, as indicated by the highest values, could occur in the census tracts in the downtown region between Buffalo and Brays Bayous. According to the conducted soil type study, it was found that within 250 out of the total 678 census tracts (37%), all the building centroids were situated on a category of poorly drained soils. Additionally, in 244 tracts, 50 to 99 percent of the centroids were situated on soils categorized as the above drainage class. Figure 6 represents the distribution of soils across the census tracts in the study area, categorized based on their respective drain-age abilities.
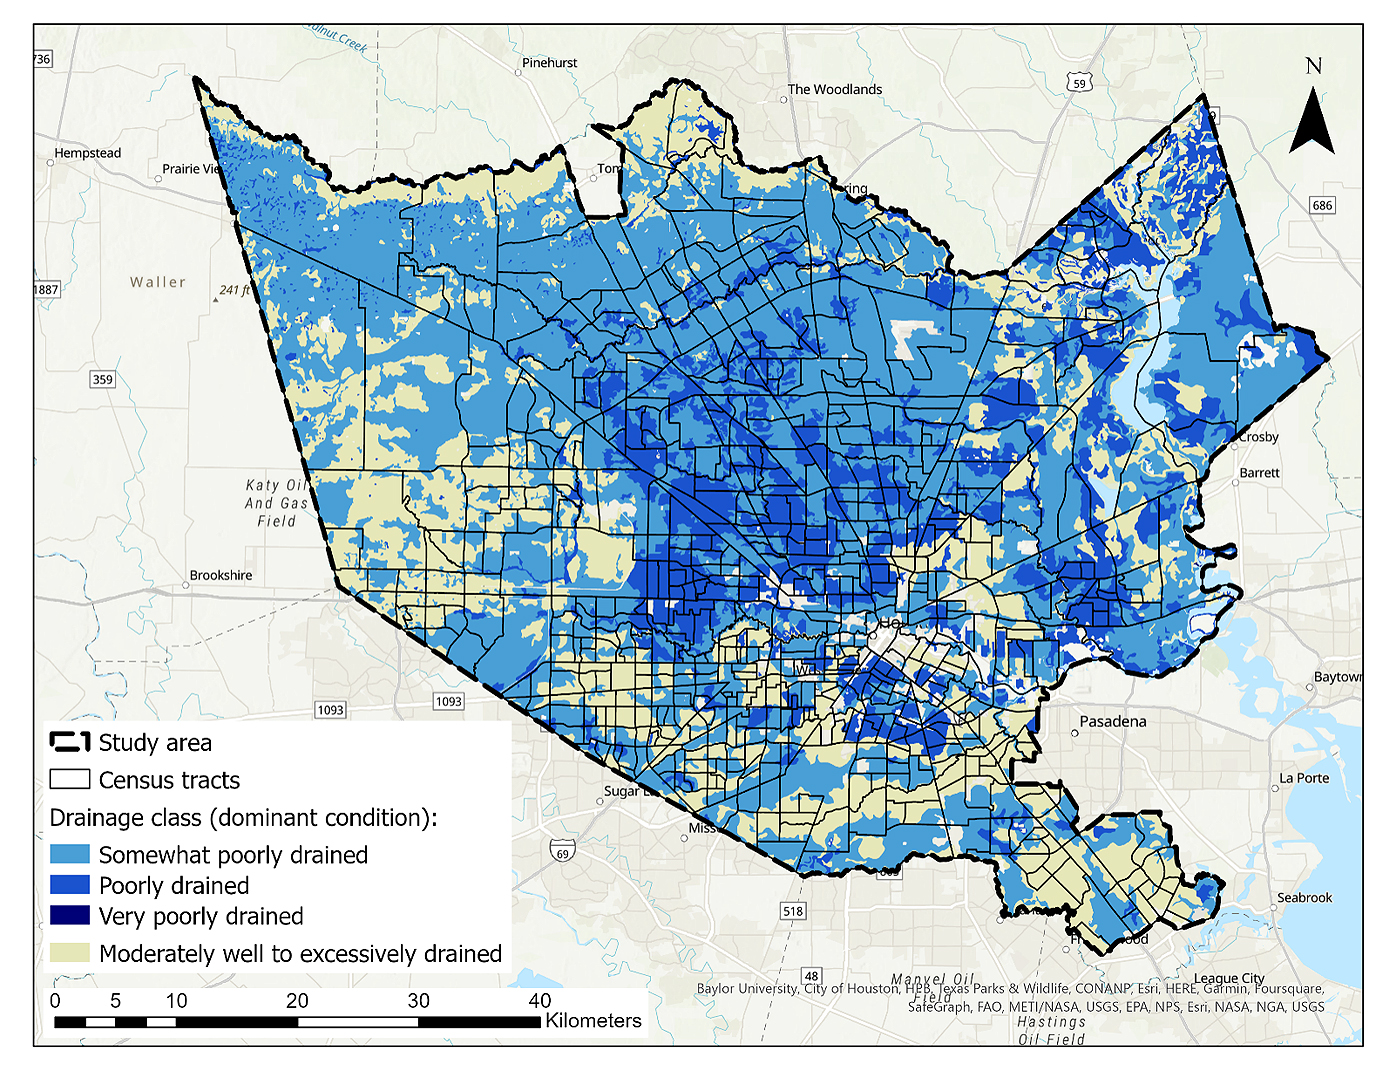 Figure 6. Dominant conditions of soil drainage in census tracts of the study area based on the Soil Survey Geographic Database (SSURGO) [54].
The population density across the census tracts ranged from zero (less than one person) to 134 persons per hectare. The highest values were found in the downtown area and the southwestern part of the city, as illustrated based on the natural breaks in Figure 7. The variation in population density across the census tracts reflects the diverse spatial distribution of residents, with some locations exhibiting more urbanization and human activity while others remain less densely populated. The median population density in the entire study area was 18 persons per hectare.
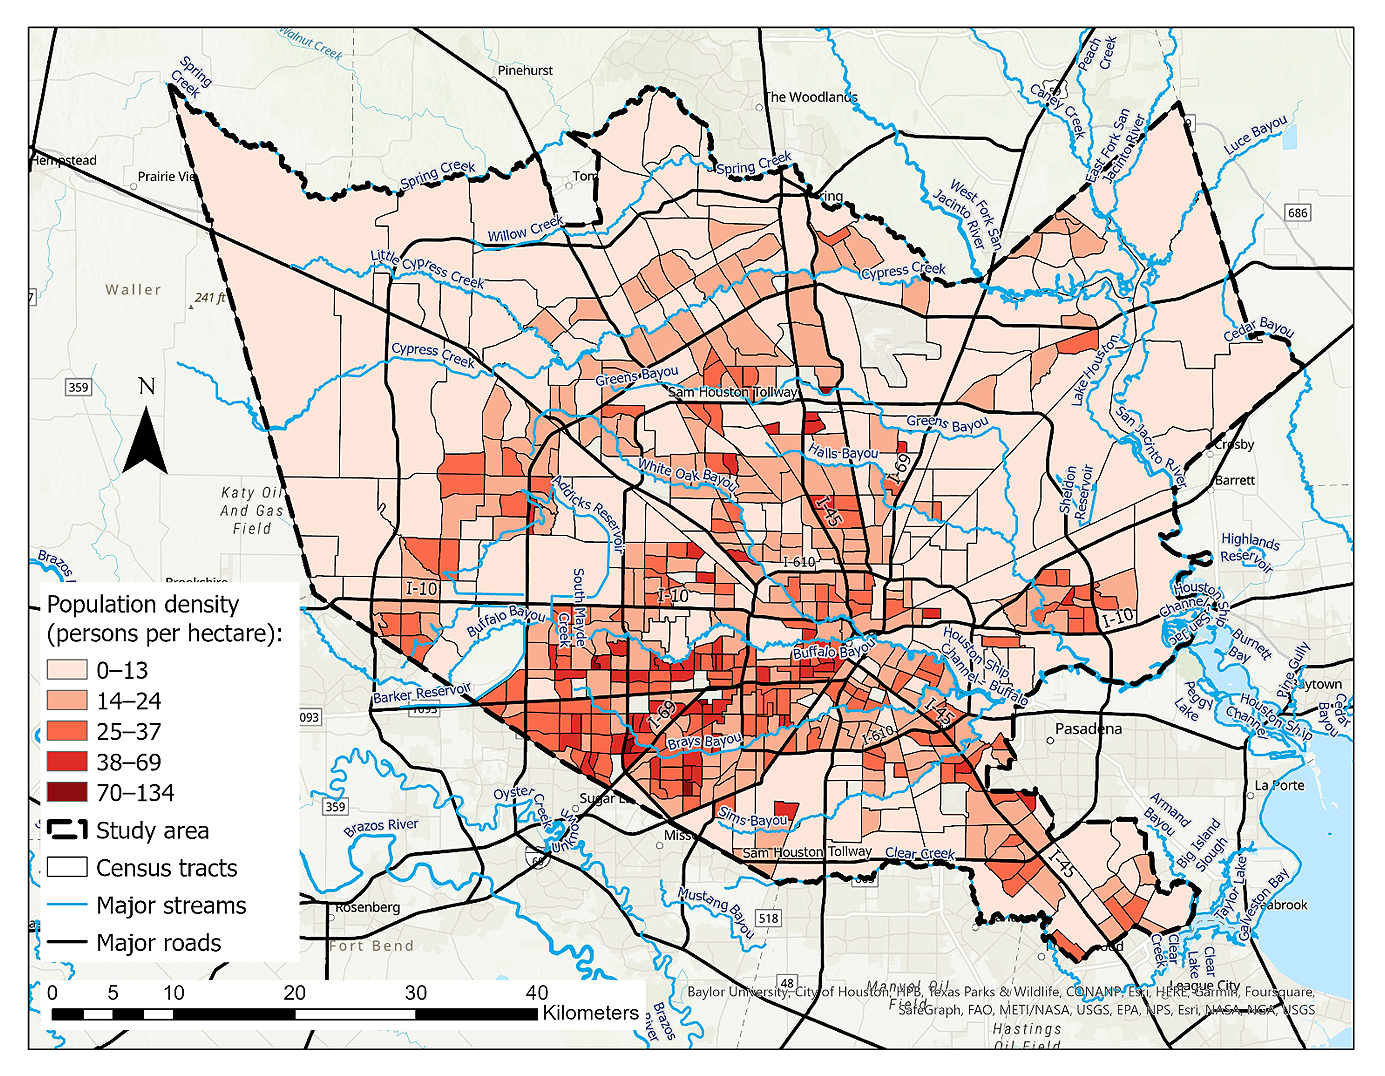 Figure 7. Population density (persons per hectare) in the studied census tracts based on the 2017 American Community Survey (ACS) by the U.S. Census Bureau [40].
Regarding physical development, the census tracts displayed a range of zero to 72 percent for the ratio of low-intensity developed lands. The percentage of area developed with medium intensity in the census tracts spanned from two to 87% while high-intensity developed lands covered zero to 86% of the tract areas. Notably, a significant concentration of census tracts with higher ratios of high-intensity development was observed in the downtown area and along major interstate highways, particularly in the southwestern part of the city, indicating a spatial preference for such urbanization patterns. In contrast, undeveloped census tracts or those with high ratios of low-intensity developed areas were mostly located in the outer regions, specifically in the northeastern and northwestern parts of the study area (Figure 8).
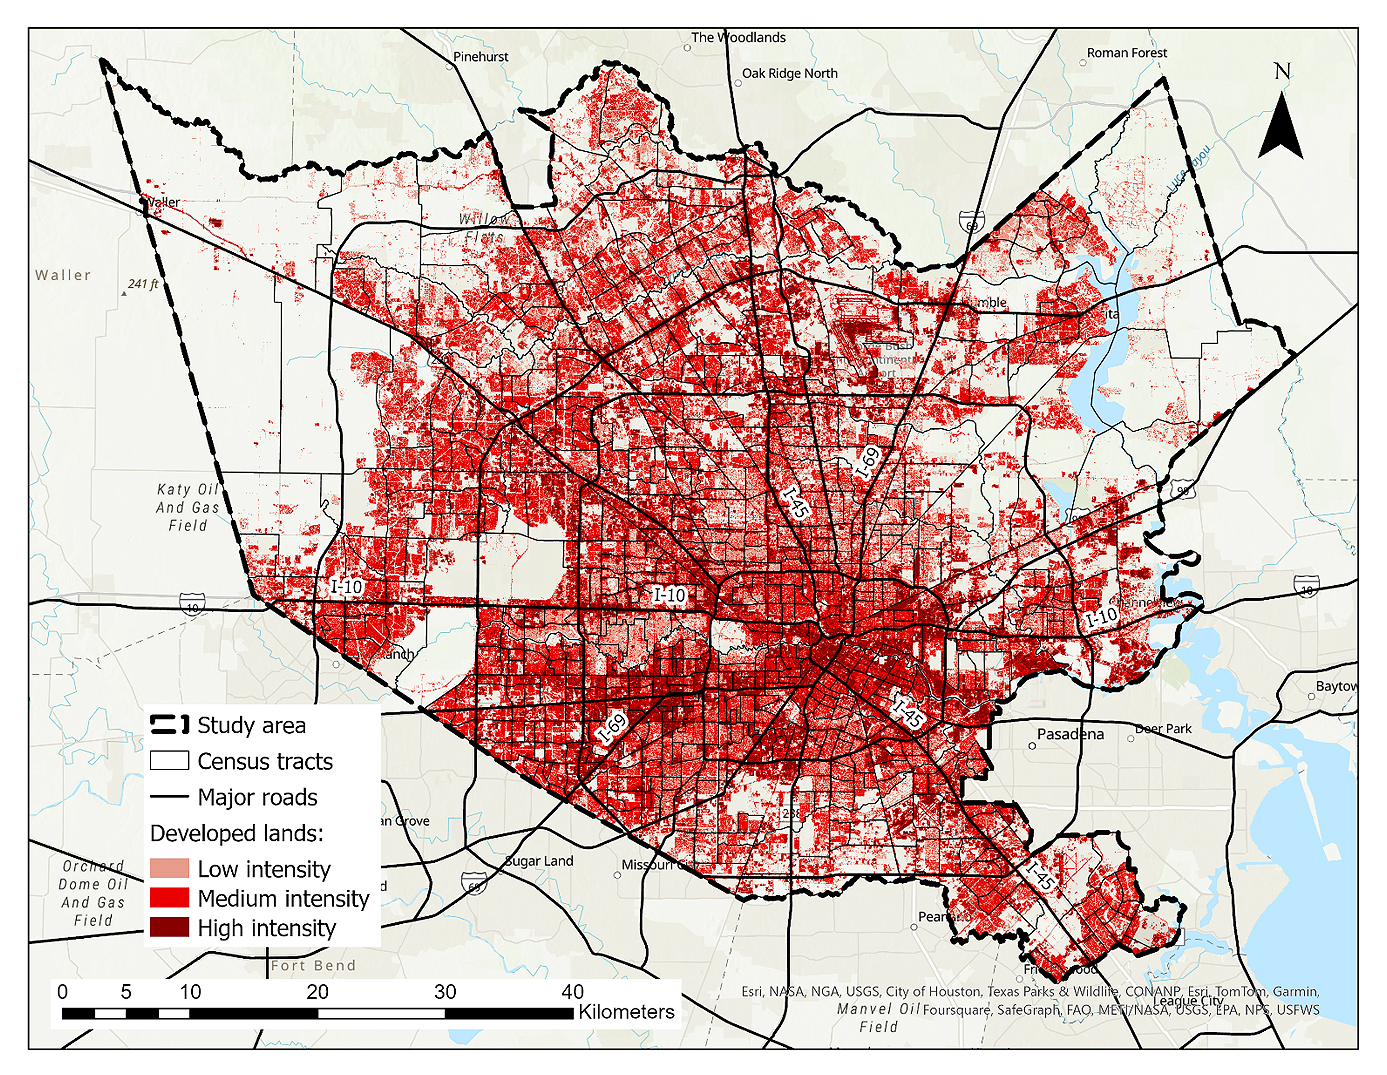 Figure 8. Distribution of the 2016 developed land cover categories in the study area based on the 2016 National Land Cover Database (NLCD) published by Multi-Resolution Land Characteristics Consortium (MRLC) [56].
Based on the 2017 American Community Survey (ACS), the percentage of individuals living below the poverty line within the census tracts varied between 0.4% and 66.0%. A predominant concentration of census tracts with high poverty ratios can be found in the central part of the urban area, encircled by the Sam Houston Tollway loop.
As analyzed in the study, the unemployment rate among the population aged 16 years or over ranged from zero to 22.3 percent in the census tracts. The majority of the tracts with the highest rates were located in the eastern part of the city. According to the results, the ratio of African-American individuals varied from zero to 94.8 percent across the studied census tracts. Among these tracts, 72 showed a percentage exceeding 50% indicating a significant presence of this racial group while 14 tracts showed no presence of African-Americans.
The percentage of Hispanic or Latino residents in the census tracts exhibited a range of 2.53 to 97.2 percent. In 229 tracts which accounts for approximately 33% of the total tracts, this ratio exceeded 50% indicating a significant presence of this ethnic group in those areas. The minimum and maximum percentages of the individuals who were not a U.S. citizen were 0.6% and 62.2%, respectively. The median age range was from 21.3 to 57.8 years. Additionally, the percentage of individuals aged 25 or older with no high school diploma ranged from zero to 64.4 percent. In 39 census tracts, this ratio was over 50 percent.
Regarding housing characteristics, the study observed a considerable variation in the median housing values across the census tracts, ranging from $20,000 to $2 million. Specifically, ten tracts had median housing values exceeding 1 million dollars while a substantial number of tracts, 192 in total, had median housing values below 100,000 dollars. In addition, the ratio of housing units occupied by renters showed a wide variation ranging from 0.7 to 90.9 percent across the study area. Notably, in 209 tracts, the proportion of renter-occupied units exceeded 50%.
Correlation and Importance AnalysesThe produced CPI and normalized importance scores for the predictor variables are presented in Table 3. The variables are listed in descending order based on their respective CPI scores, highlighting their relative importance in influencing the average damage ratios. As seen in the table, it is evident that the percentage of poorly drained soils held the highest importance in the model concerning the average damage losses. Moreover, population density and the proportion of medium-intensity developed areas were identified as two other variables with relatively high influence in the model. Conversely, vulnerability-related variables made lesser contributions to the model. Among these variables, the unemployment rate and African-American ratio exhibited relatively higher CPI scores. To provide a visual summary of the variable importance results, Figure 9 was created.
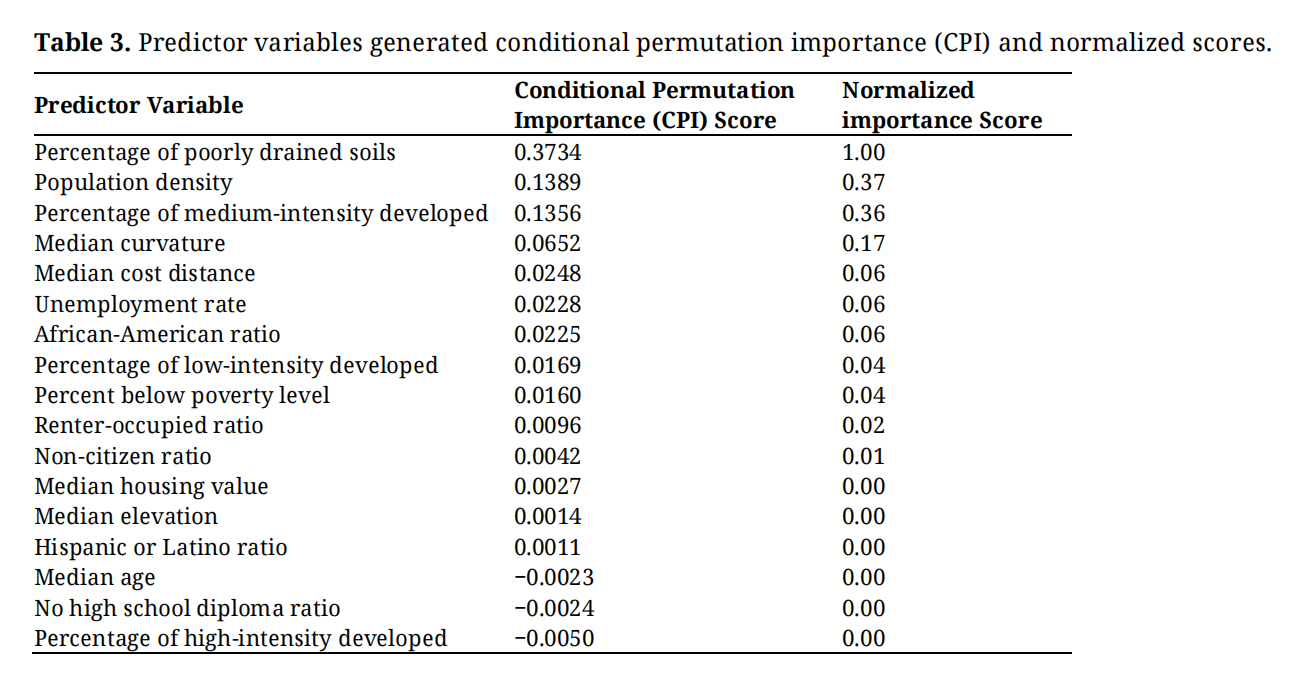 Table 3. Predictor variables generated conditional permutation importance (CPI) and normalized scores.
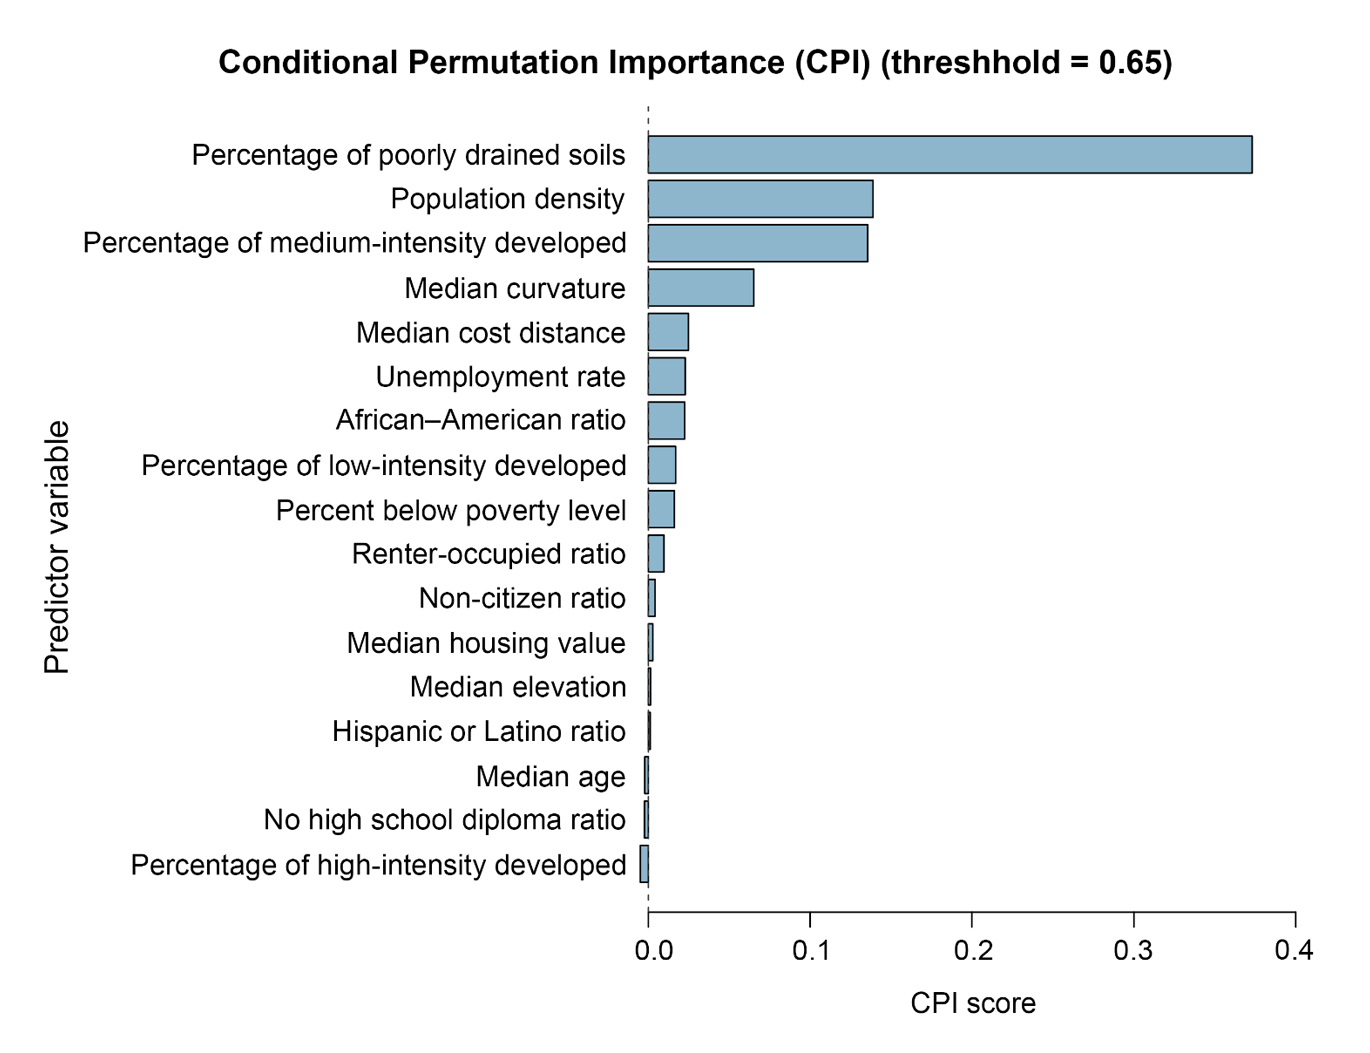 Figure 9. Bar chart of the predictor variables’ conditional permutation importance (CPI) scores.
A complementary correlation analysis was organized among the variables mentioned in the previous paragraph to address concerns about the relationships among the most significant predictor variables identified by the model. This analysis revealed minimal statistical relationships among the aforementioned variables, with correlation coefficients as follows: 0.0186 between the percentage of poorly drained soils and population density, 0.0141 between the percentage of poorly drained soils and the proportion of medium-intensity developed areas, and 0.0422 between the proportion of medium-intensity developed areas and population density.
This study's results indicate that soil drainage capability is the most significant factor. Comparison with previous articles reviewed in the literature reveals certain differences. This variable was not listed among the most important flood damage predictors by some previous authors [23,25]. Some other researchers, who focused solely on hydrologic and geomorphic aspects, reported factors related to soil texture and type as the third and fourth significant variables [17,18]. Population density, the second most significant variable in this study, was reported as the fifth important predictor in only one study [23]. The third significant variable in this study is related to the intensity of developed areas which was not considered in any of the previous studies mentioned above.
The findings of this study enhance our understanding of flood risk assessment by revealing that beyond geomorphic variables like soil type, factors associated with human and physical development patterns can also play a significant role in explaining and predicting flood damage. This study expands upon prior research, including [23,25], by combining them with additional approaches for a more comprehensive analysis. Specifically, it integrates hydrological factors related to flooding, as examined in [17,18], with socioeconomic indicators, similar to those in [24,27,45]. It also takes a novel approach by including variables related to land and community development patterns. The disparities between this study's findings and previous experiments may be attributed to the more comprehensive methodology employed, as well as variabilities associated with the study areas and the analyzed disaster records.
Based on the results of this study, the variable associated with the percentage of poorly drained soils in the census tracts emerged as significantly more important in predicting average damage ratios. According to the model’s analysis, this particular factor exerted a greater influence on the loss ratios even compared to the cost distance to the streams. This can emphasize the essential role of geotechnical considerations in land use planning and zoning regulations to consider this problem. Moreover, increasing the implementation of green infrastructure and natural water retention features such as wetlands, bioswales, and green roofs can help absorb and retain rainwater, mitigating the impact of impermeable surfaces. Integrating these nature-based solutions into urban development plans can improve water management and reduce flood loss. In addition, updating and enforcing building codes and floodplain management regulations can enhance the resilience of structures in the flood-prone areas of the city. Measures such as requiring elevated foundations, flood-resistant construction materials, and proper drainage systems can minimize flood damage and improve community resilience. This study focused on the relationship between damage and specific risk factors. Future complementary studies could also incorporate the impact of existing mitigation efforts, such as green infrastructure development, in similar experiments.
It is also important to recognize that poorly drained soils may influence flood dynamics beyond the boundaries of individual census tracts by affecting runoffs and downstream flow behavior. The present analysis evaluates tract-level associations between soil drainage characteristics and observed damage ratios rather than modeling hydrodynamic propagation processes. Therefore, the results capture the localized statistical relationship between soil conditions and damage outcomes, while acknowledging that broader watershed-scale interactions may also contribute to flood impacts.
The subsequent key variables, population density (0.37) and percentage of medium-intensity development (0.36) ranked second and third among all predictors, with nearly identical normalized importance scores. These variables jointly represent exposure concentration and built-environment intensity within the study area. Their relative values do not indicate low explanatory power but rather a proportional contribution compared to the dominant hazard-related factor (percentage of poorly drained soils = 1.00). This indicates that while exposure characteristics substantially influence damage patterns, physical flood retention and drainage conditions played a more dominant role in shaping proportional damage during Hurricane Harvey. This suggests that vulnerability within the Houston metropolitan area reflects an interaction between concentrated development and underlying hazard susceptibility, with drainage-related conditions exerting the strongest influence.
In medium-intensity development, impervious surfaces make up 50% to 79% of the total land cover, and the majority of residential structures consist of one- or two-story single-family homes. Since the entirety of a one-story building is typically exposed to floodwaters, the ratio of flood damage to the property value is often higher for such structures. Thus, the combination of a high population, significant imperviousness, and a low number of stories in buildings could contribute to higher ratios of flood loss. Given the above situation, promoting smart growth principles [64] and compact development strategies in such urban regions can be a solution. Encouraging higher-density developments in appropriate areas, as recommended by such principles, can minimize impervious surfaces and mitigate flood risk. This approach can include mixed-use developments, higher building densities, and the integration of green spaces within communities.
The above three variables exhibited extremely weak statistical correlations with each other, ensuring that similar factors were not redundantly addressed multiple times as the most significant indicators. These outcomes can be discussed and interpreted from various perspectives.
Although the model used in this study includes a broad set of predictors, some potentially relevant factors were not incorporated. In particular, we did not include event-scale climate variables (such as rainfall intensity or storm duration) or detailed infrastructure indicators (e.g., drainage capacity or flood control structures). These datasets are not available in a consistent form across the full study area and time period, and including them would have restricted the analysis to a much smaller subset of locations. Many such datasets are event-specific, locally maintained, or incomplete, which makes their integration into a large-scale modeling framework challenging. The predictor set was therefore limited to variables that could be compiled uniformly for all observations. Future work could improve predictive performance by integrating high-resolution precipitation products, hydrodynamic model outputs, or standardized infrastructure inventories as these datasets become more widely available.
The utilization of the National Flood Insurance Program (NFIP) claims data can provide valuable insights into the analysis of flood loss. However, it is important to acknowledge that these data may introduce biases that can affect the predictive models due to their limitations. The NFIP operates based on flood maps that designate zones with a one percent chance of flooding in a given year (100-year) commonly referred to as the Special Flood Hazard Area (SFHA). FEMA is responsible for administering and providing flood insurance coverage for eligible communities in the United States. Within the SFHA, there exists a mandatory obligation to purchase flood insurance for properties that are being financed by federally regulated lending institutions. To address instances of noncompliance, lenders and loan servicers have been more rigorously enforcing this requirement. They are now required to assess and document whether a structure falls in the SFHA and ensure that the borrower maintains flood insurance throughout the loan [65]. One major limitation stems from the SFHA maps themselves. These maps have been subject to criticism due to their inherent inaccuracies, incomplete geographic coverage, lack of consideration for climate change impacts, exclusion of pluvial (overland) floods, reliance on a binary classification of properties as “inside” or “outside” flood zones, and long (5-year) update periods that fail to account for rapid land alterations [66,67].
Investigations into the flooding caused by Hurricane Harvey in 2017 revealed that nearly 75 percent of the affected residential structures in the City of Houston and surrounding areas in Harris County were located outside the above designated 100-year flood zone subject to the regulatory flood insurance measures [67]. The owners whose buildings are not located in the SFHA are less likely to buy flood insurance. In cases where properties outside the SFHA are not insured, the owners can still file flood claims to seek assistance through the Individual and Households Program (IHP). But the support provided to uninsured properties through the IHP is typically minimal compared to the assistance offered to insured properties. The lack of insurance coverage and limited availability of federal support in areas outside the SFHA may lead to a potential underreporting of flood damages [25]. This issue poses another limitation with the NFIP claims data which could potentially influence the results and findings of this study. The NFIP claims dataset provides a nationally consistent record of insured flood losses, but it does not capture damages to uninsured properties and may underrepresent impacts outside mapped SFHAs. As a result, the damage ratios derived here should be interpreted as reflecting insured losses rather than total flood damages. Despite this limitation, NFIP data remain one of the few standardized sources available for large-scale analysis of building-level flood losses. Alternative datasets, such as FEMA IHP records, local post-disaster damage inventories, or remotely sensed flood extent estimations, could help address these limitations by capturing uninsured losses or providing independent validation of exposure and damage patterns. However, such data are not consistently available across the full study domain and time period considered here, and integrating them with NFIP claims would require substantial additional processing. Incorporating these complementary datasets represents an important direction for future research aimed at quantifying uninsured losses and evaluating reporting bias in large-scale flood damage analyses.
Due to data availability considerations, this experiment was conducted at the scale of census tracts. The NFIP claims records were redacted by FEMA to ensure individual privacy protection. In addition, the used detailed socioeconomic data were publicly available at the tract level, as provided by the Census Bureau. Therefore, the study was preferred to be conducted at this scale. Moreover, the environmental variables were extracted for the building centroids and then aggregated at the tract level as median values or percentages. This approach offered advantages by focusing the analysis on locations of insurable buildings rather than undeveloped areas or open spaces. However, it is important to acknowledge that uncertainties could arise from summarizing the damage ratios and predictor variables within the census tracts as average, median, or percentage values. The tracts that were predominantly non-residential such as those containing airports and universities were not included to ensure a comprehensive and accurate analysis of residential demographics.
The analyses conducted in this study are subject to a potential limitation, namely the spatial resolution. In the development of hazard-related variables, we used a 10 m DEM, while for development of the physical exposure indicators, we relied on the 30 m NLCD land cover dataset. The discrepancy between these resolutions could pose a challenge for the research; however, we opted not to resample any of these datasets to avoid introducing additional uncertainty. It is worth emphasizing that the cell size of the datasets employed had an impact on the study results. Access to raster grids at a higher resolution would likely result in more accurate outcomes. For future studies, an alternative approach could involve extracting such variables through remote sensing techniques utilizing high-resolution imagery.
The study findings emphasize the importance of zoning practices in considering flood risk for resilient development. Zoning measures should aim to protect the population and assets from future flood disasters by avoiding development in floodplains. However, such efforts can be more challenging for Houston, as the city lacks zoning and instead relies on ordinance codes that do not address land use [68]. Moreover, conservation efforts like easements and buyout programs can help designate high-risk urban areas for green infrastructure development, which can mitigate flood hazards by reducing impervious surfaces while preserving floodplains from development. A floodplain easement is an agreement in which a landowner voluntarily restricts certain rights to use or develop land that has been flooded in the past. This agreement is typically formalized in a deed and involves conveying these rights to a conservation organization or government entity, such as the Natural Resources Conservation Service (NRCS) under the United States Department of Agriculture. Despite these restrictions, the landowner retains ownership, title, and interest in the property [69]. Additionally, the Federal Emergency Management Agency (FEMA) allocates funds through its hazard mitigation grants to offer buyouts in areas previously impacted by flood disasters, assisting state or local governments in purchasing flooded properties and conserving them as open spaces [70].
To provide more spatially explicit guidance from our results, we ranked the studied census tracts according to the three most significant predictors of flood damage: poorly drained soils, population density, and medium-intensity development. We then identified the top 20% of tracts for each predictor, as well as those that ranked in the top 20% across all three factors. Figure 10 shows both the top-20% tracts for each variable (hatched layers) and the subset of tracts where all three factors overlap (highlighted polygons). Census tracts with the highest percentages of poorly drained soils or the highest population density can be priorities for future green infrastructure projects in Houston, while tracts with the most medium-intensity development may be candidates for zoning reforms. The overlapping tracts highlight areas where multiple high-risk factors coincide, signaling locations where mitigation efforts are critically needed and can deliver the greatest benefits. Overall, this approach illustrates how model outputs can be turned into a practical spatial prioritization tool, helping planners and policymakers target resources to areas with compounded flood risk.
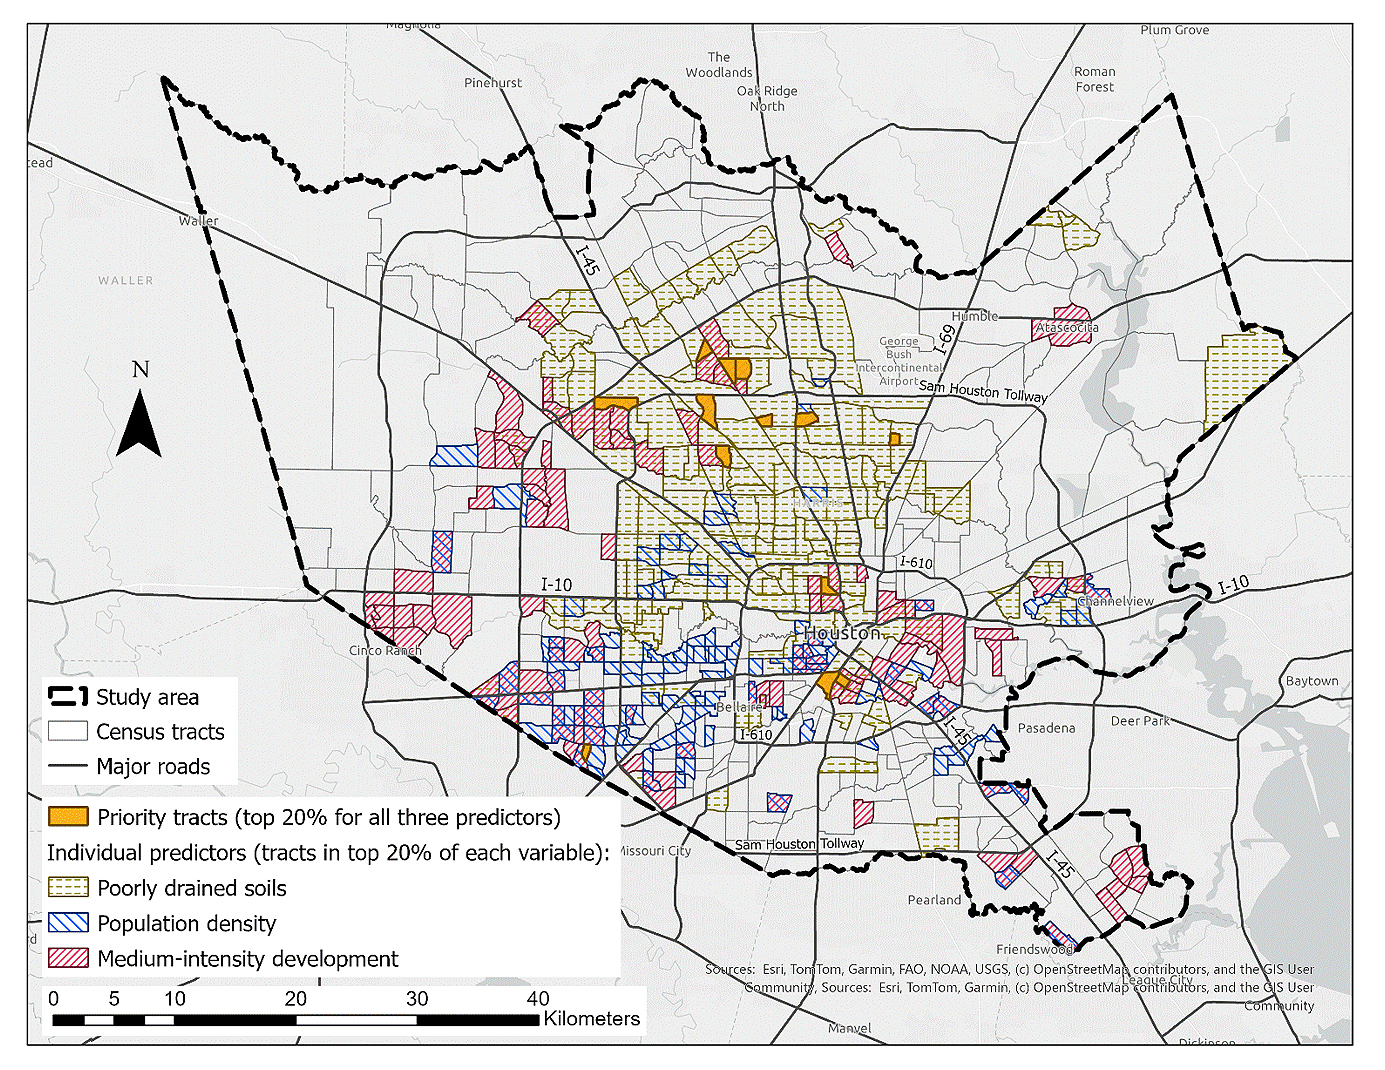 Figure 10. Spatial overlap of the three most influential predictors of flood damage across Houston census tracts.
The vulnerability-related variables derived from socioeconomic data demonstrated considerably lower levels of importance, as indicated by the model results. This aspect of the results may be perceived as inconsistent with the concept of environmental justice, similar to the findings by some previous authors [25,33,34]. In addition to the limitations of the NFIP claims data discussed earlier, there are different perspectives that can explain these outcomes. For example, one reason could be the cost of mandatory flood insurance which may discourage economically disadvantaged individuals from choosing to live in flood-prone areas or prompt them to relocate if they are already residing in such zones [33]. Two other potential reasons may exist. Firstly, historical processes of racial and socioeconomic segregation have shaped urban spatial structures in Houston, potentially affecting the distribution of exposure across demographic groups [27]. Secondly, historical racial segregation efforts in the region may have resulted in minorities being clustered in other urban districts that do not intersect with the floodplains [25]. Future studies could be developed to geospatially analyze the impact of such historical efforts in relation to flood exposure and loss. Considering a location-based approach a different perspective can be offered. The presence of less socially vulnerable individuals in flood-prone locations can be attributed to the added value of aesthetic advantages near waterbodies or water-based amenities in urban areas making such regions less affordable for the minorities and disadvantaged groups [34]. This proposition may hold true for census tracts with higher median housing values or those containing new green spaces and recreational developments along the bayous in Houston. At the same time, caution is needed in interpreting these patterns. The present study does not directly test historical segregation mechanisms or residential mobility processes. Furthermore, the relationship between proximity to water bodies and property value is context-dependent and varies across regions and historical settings. In Houston, certain bayou-adjacent areas have undergone redevelopment and amenity-driven investment, which may influence local exposure patterns, but such dynamics cannot be generalized universally. Future research integrating historical spatial data and housing market analyses would help clarify these relationships.
The relatively low importance of social vulnerability indicators in the model should not be interpreted as evidence that these factors are unimportant for flood impacts. Their influence may be context-dependent and expressed through interactions with hazard or exposure conditions rather than as standalone predictors. For example, socioeconomic disadvantage may amplify losses primarily in areas with high hazard intensity or limited drainage capacity. We did not conduct subgroup or interaction analyses in the present study, as the primary goal was to evaluate the model's overall predictive structure across the full study area. Exploring how social vulnerability effects vary across different socioeconomic or environmental contexts, for example, comparing selected census tracts with high racial minorities with the others, would be a valuable direction for future work and could help clarify the pathways through which these variables influence flood outcomes.
Our results partially support the hypothesis that flood risk correlates with certain environmental and socioeconomic characteristics of urban communities. Specifically, poorly drained soils increase susceptibility to surface flooding, higher population density amplifies potential exposure, and medium-intensity development often occurs in areas with elevated flood risk, combining both impervious surfaces and human presence. Together, these findings demonstrate that flood risk arises from the interaction of environmental conditions and human settlement patterns, highlighting the need for integrated planning approaches in urban areas. It is important to note that flood impacts are closely tied to local characteristics, including topography, drainage patterns, urban form, soil conditions, and regional climate. Because this study focuses on Hurricane Harvey in Houston, the relative importance of predictors reflects the specific environmental and urban context of this event. The results should therefore be interpreted as context-specific rather than universally applicable. While the overall modeling framework can be applied to other regions, the variable rankings and quantitative results would need to be recalibrated using local data. Applying the approach in different geographic settings would help assess how sensitive the findings are to territorial conditions. The study area’s size may also influence the structure and interpretation of model results. The Houston metropolitan area represents a large and diverse urban environment with substantial variation in land use, infrastructure, and hydrological conditions. In smaller urban areas or more homogeneous regions, the relative importance of predictors may differ, and certain variables may exert stronger or weaker influence depending on local characteristics. While the modeling framework itself is not restricted to large metropolitan areas, its application to smaller-scale settings would require recalibration and may yield different variable rankings. Future studies applying this approach across multiple spatial scales would help clarify how sensitive the results are to scale effects.
From a sustainability perspective, this study's findings highlight the importance of integrating hazard characteristics into long-term land-use planning alongside urban development patterns. Targeted mitigation strategies, including green infrastructure expansion and context-sensitive zoning adjustments, can support more sustainable and resilient urban growth by reducing future flood losses while promoting equitable adaptation outcomes.
The goal of this study was to investigate the relationships between direct flood loss to buildings, as the response variable, and a combination of socioeconomic attributes and environmental characteristics, as the conditioning factors, in Houston, TX to provide better understanding of the risk factors and aid the city in future planning for and management of flooding. The findings partially supported the research hypothesis in the study area. It was observed that flood damage ratios in the census tracts were correlated with the presence of poorly drained soils which emerged as the most significant factor. This correlation can be attributed to the predominance of impermeable clay soils in the region reducing hydraulic conductivity. The next important variables, with similar degrees of contribution, were population density and the proportion of medium-intensity developed lands. The results of the importance analysis did not align with the expectations of the environmental justice concept. Variables related to social vulnerability were found to have low significance in predicting the damage ratios.
This study, summarizing and analyzing millions of records and spatial features with an acceptable accuracy (RMSE = 12.8% & MAE = 10.7%), can be an example of handling both spatial and aspatial big data through the integration of geospatial technologies and AI. It built upon previous studies to incorporate the relevant methods in a comprehensive way to consider the effects of environmental and socioeconomic factors on flood loss. This article can also contribute to the evolving field of applying machine learning techniques to comprehensive disaster risk assessment processes. More broadly, the proposed multivariable modeling approach supports sustainability-oriented decision-making by enabling planners and policymakers to prioritize interventions that reduce flood risk while considering social and spatial equity. By linking hazard dynamics to exposure and vulnerability dimensions, the framework contributes to the development of more sustainable, adaptive urban systems amid increasing climate uncertainty.
Future research can enhance the current findings by considering additional factors associated with alterations of precipitation patterns and hydrological cycles resulting from climate change. It would be beneficial to include more detailed data on rainfall and stream gauges in such studies. This would enable a more thorough analysis of these variables and their potential influence on the study outcomes.
The dataset of the study is available from the authors upon reasonable request.
All authors contributed to the study conception and design. The Following part summarizes their contributions based on the CRediT taxonomy: Conceptualization, BB, AEM and MPS; methodology, BB, AEM and MPS; software, BB and AEM; validation, AEM and MPS; formal analysis, BB; investigation, AEM and MPS; resources, BB and AEM; data Curation, BB; writing—original draft preparation, BB; writing—review and editing, AEM and MPS; visualization, BB; supervision, AEM and MPS; project administration, BB; funding acquisition, MPS. All authors have read and agreed to the published version of the manuscript.
The authors declare that they have no conflicts of interest.
This work was supported by the USDA National Institute of Food and Agriculture, Hatch project accession number 7004979, and the West Virginia Agricultural and Forestry Experiment Station.
1.
2.
3.
4.
5.
6.
7.
8.
9.
10.
11.
12.
13.
14.
15.
16.
17.
18.
19.
20.
21.
22.
23.
24.
25.
26.
27.
28.
29.
30.
31.
32.
33.
34.
35.
36.
37.
38.
39.
40.
41.
42.
43.
44.
45.
46.
47.
48.
49.
50.
51.
52.
53.
54.
55.
56.
57.
58.
59.
60.
61.
62.
63.
64.
65.
66.
67.
68.
69.
70.
Bidadian B, Maxwell AE, Strager MP. Application of Machine Learning for Integrated Flood Risk Assessment: Case Study of Hurricane Harvey in Houston, Texas. J Sustain Res. 2026;8(1):e2600026. https://doi.org/10.20900/jsr20260025.

Copyright © Hapres Co., Ltd. Privacy Policy | Terms and Conditions


