Location: Home >> Detail
J Sustain Res. 2026;8(2):e260029. https://doi.org/10.20900/jsr20260029
 Cheng-Hsien Hsieh *
School of Business, Singapore University of Social Sciences, Singapore 599494, Singapore
* Correspondence: Cheng-Hsien Hsieh
Global reliance on fossil fuels continues to drive greenhouse gas emissions and climate change, necessitating accelerated innovation in green energy technologies to achieve sustainable development and net-zero targets. Despite extensive research on sustainability, systematically integrating patent intelligence with semantic analytics to understand technological evolution in this domain has received limited attention. This study addresses this gap by developing a Multi-Layer Patent Intelligence and Semantic Analytics (MPISA) framework, integrating patent analysis and large language model (LLM)-based semantic clustering using SciBERT, to examine green energy innovation patterns based on patent data from the United States Patent and Trademark Office from 2005 to 2025. Findings reveal a technological reorientation from diversified renewables toward photovoltaic consolidation and subsequent material-driven optimisation. Assignee analysis demonstrates shifting competitive dynamics, with traditional manufacturers declining as power electronics specialists gain prominence. LLM-based thematic clustering indicates that green energy innovation is structured as a hierarchical technology stack rather than a collection of isolated fields. The MPISA framework offers a replicable methodology for understanding technological evolution and informs strategic decision-making for advancing sustainable energy transitions.
The global demand for energy and related services continues to increase to sustain human, social and economic development, and support welfare and public health [1]. All states rely on the provision of energy services to fulfil essential human needs [2]. At present, global energy consumption remains predominantly dependent on fossil fuels [3]. Although these energy sources are extensively utilised owing to their storability and capacity for large-scale distribution across national boundaries, their continued use poses considerable environmental challenges.
Climate change, widely recognised as one of the most pressing global challenges of the contemporary era, is closely linked to the escalation of greenhouse gas (GHG) concentrations, which constitute a principal driver of rising global temperatures and altered precipitation patterns. Recent intensifications in temperature alongside declining rainfall in various regions have generated significant concern within the international community [4]. In particular, energy production and consumption account for two-thirds of global GHG emissions [5].
The likelihood of limiting the rise in global temperatures to 1.5 °C [6], with the aim of mitigating the adverse effects of climate change and safeguarding both present and future populations directly affected by its impacts, is diminishing [7]. Carbon dioxide (CO2) emissions are increasing at an unprecedented rate, which has not been seen in nearly two million years. At the current pace of transition, renewable and other low-carbon energy sources are unlikely to constitute a substantial proportion of the global energy mix by 2030 [8]. Green energy sources can substantially mitigate GHG emissions arising from the combustion of fossil fuels in power generation, thereby alleviating climate change.
Sustainable Development Goals (SDGs) provide an integrated framework for addressing environmental, social and economic challenges, with the transition to clean energy recognised as a central objective. Green energy development constitutes a key mechanism for advancing these goals, as the shift to low-carbon and renewable energy systems is fundamental not only to achieving zero-emissions targets, as emphasised in the Paris Agreement and Agenda 2030, but also to supporting broader objectives, such as economic growth, social and economic prosperity, employment, energy security, and public well-being [9,10].
The impact of green energy sources varies depending on the type of energy and the specific SDG under consideration [11]. While their positive contributions to SDG 7 (Affordable and Clean Energy) and SDG 13 (Climate Action) are unequivocal, there are also adverse effects on other SDGs, including SDG 2 (Zero Hunger), SDG 3 (Good Health and Well-being), and SDG 15 (Life on Land). Green energy generation positively influences economic growth and sustainable development [12]. Therefore, the invention, adoption and diffusion of green energy technologies must occupy a central position within the broader sustainability transition [13]. Such technological transformation is indispensable to stabilising GHG emissions, mitigating the risks posed by climate change and energy poverty, and advancing long-term sustainable development [14]. Bibliometric analysis is an essential tool for scientific modelling, enabling researchers to identify core topic areas and trace innovation trajectories by moving beyond fragmented studies. By mapping the knowledge structures of fields such as green finance and smart cities, it reveals how sustainability research ecosystems and innovation systems evolve over time, supporting more informed discussions on SDG-oriented technologies and their interconnections [15,16].
Patent data serve as a vital resource for both industry and academia by providing a comprehensive, quantitative basis for analysing technological evolution, knowledge diffusion, and market competition [17]. Patent data provide valuable information on the evolution of technologies over time [18], as well as detailed information about emerging technologies and the identification of trends in past, present, and future technologies [19]. The unique position of patents as a repository of global innovation underscores their critical role. According to statistics from the World Intellectual Property Organization, approximately 80% of the world’s technological information can be found only through patent databases [20]. Patent documents are a crucial source for acquiring technological information, including emerging sustainable technologies. Therefore, patent analysis has long been recognised as a key component of competitive technical intelligence, supporting the management of research and development (R&D) efforts, the assessment of competitive dynamics and collaboration opportunities, and the formulation of sustainability-oriented industrial policies [21].
Accordingly, using patents as a source for data analysis allows for a rapid understanding of industry development, particularly in green technology sectors. Patents may be cited as representative indicators of technological convergence, offering valuable insights into the evolution of technological domains and facilitating diverse forms of analysis through the specific attributes associated with individual patent records [22]. This study focuses on US patent publications granted between 2005 and 2025 to explore these dynamics within the context of sustainable energy innovation. The initial retrieval yielded 11,554 records, reflecting the substantial volume of innovative activity in this domain.
Despite the extensive body of research on green energy and sustainability, systematically integrating patent intelligence with semantic analytics has received limited attention. Recent scholarship on green energy and sustainable development has engaged the subject through a range of methodological lenses. For example, Income-stratified macroeconomic datasets [23], aggregated journal corpora [24], and policy-level observational records [25] contribute advances understanding in its respective domain. However, discussions to capture the actual velocity and granularity of technological development within the green energy sector were limited. A substantial proportion of green energy innovation is never disclosed through academic channels—it is instead recorded in patent filings, where specific technical solutions are documented at the point of conception.
This study proposes an integrated Multi-Layer Patent Intelligence and Semantic Analytics (MPISA) framework that integrates large language model (LLM)-based semantic clustering, portfolio-level patent analysis, ownership consolidation mapping, technology classification, and inventor/assignee network community detection. The framework is applied to green energy patents from 2005 to 2025 to systematically trace innovation patterns, technological trajectories, and structural shifts within sustainability-oriented technological development. Moving beyond conventional bibliometric and classification-based methods, LLM-driven semantic clustering uncovers latent thematic structures embedded in patent abstracts, providing a more fine-grained understanding of emerging knowledge domains and evolving innovation dynamics.
The remainder of this paper is organised as follows: Section “Literature Review” provides background information on sustainability and green energy. Section “Materials and Methods” describes the proposed methodology. Section “Analytical Results” presents the results and discussion of the MPISA framework. Section “Conclusions” concludes by summarising the key findings and acknowledging the limitations of this study.
Political and business leaders have increasingly framed environmental protection and economic growth as complementary and integral pillars of sustainable development [26]. The concept of sustainable development has gained unprecedented prominence in academic and policy discourse since its initial articulation by the World Commission on Environment and Development. The widely cited Our Common Future, commonly referred to as the Brundtland Report, defines sustainable development that satisfies present needs without compromising the ability of future generations to meet their own needs [27].
The necessity of mitigating anthropogenic climate change while sustaining economic growth is central to this paradigm, a balance regarded as fundamental to the durability of sustainable economic development [28]. Technological innovations that simultaneously promote economic advancement and address environmental degradation have assumed increasing significance in the pursuit of this dual objective [29]. Accordingly, the transition toward energy derived from nondepleting sources constitutes a core dimension of sustainable development. Such an approach encompasses not only the attainment of economic progress, but also the preservation of a clean and healthy environment for present and future generations [30]. The confluence of the global economic crisis and intensifying concerns over climate change has amplified policy interest in restructuring economies toward environmental sustainability, giving rise to the term “green energy” as a distinct policy objective [31].
Therefore, sustained innovation in climate change mitigation technologies is indispensable for achieving net-zero emissions in the latter half of the century, as expected under the Paris Agreement [6]. Although it is frequently asserted that currently available technologies are sufficient to attain net-zero targets, progress remains insufficient to meet ambitious climate goals [32]. Under Sustainable Development Scenario of the International Energy Agency, the technologies required to abate approximately 35% of the emissions necessary to meet this objective are currently in the prototype or demonstration stages, while a further 40% remain in the early phases of adoption [33].
Renewable green energy sources present significant opportunities for advancing sustainable development, including the mitigation of climate change, enhancement of energy security and access, and promotion of social and economic development [34]. Green sources have attracted particular attention within the broader category of low-carbon energy due to their alignment with sustainability principles [35]. Socioeconomic development is contingent on the availability of a stable and reliable supply of energy resources. In the context of sustainable development, this necessitates an energy system that is secure in the long term, accessible and affordable, and capable of meeting essential needs without imposing adverse effects on society [36]. Although not all renewable green energy sources are entirely free from environmental impacts [37], the diversity of available alternatives suggests that a transition toward renewable energy within a long-term sustainability framework can yield an energy system that is considerably cleaner than one reliant on regulatory controls imposed upon conventional fossil-based sources.
Realising this potential on a global scale requires technical maturity and effective diffusion of low-carbon technologies across borders. The expansion and global diffusion of climate change mitigation technologies are essential to the effective mitigation of climate change [38]. Various mechanisms, including the Technology Transfer Mechanism and the Clean Development Mechanism, have been introduced within the framework of the United Nations Framework Convention on Climate Change to address this challenge and facilitate the transfer and diffusion of climate change mitigation technologies [39]. The sustainable development of energy systems has the potential to significantly contribute to the economies that possess an abundance and variety of renewable green energy sources, such as solar, wind, hydro, geothermal, tidal and ocean, and biomass [2].
Green Energy CategoriesThis section provides a typological review of the principal green energy sources, examining their respective technologies, applications, and sustainability implications. According to the granted patent database of the United States Patent and Trademark Office (USPTO), the “green energy” classification comprises several subsections, including renewable energy, solar cell, photovoltaic, photovoltaic module, perovskite solar, concentrated solar power, wind turbine, offshore wind, aerogenerator, hydropower, run-of-river, tidal energy, wave energy, ocean energy, geothermal energy, enhanced geothermal, biofuel, biodiesel, bioethanol, biogas, biomethane, and waste-to energy. Thus, this study discusses solar power, wind energy, hydropower, geothermal energy, and biomass.
Solar powerThis widely adopted form of renewable energy is primarily harnessed through photovoltaic cells, which are engineered to absorb and convert solar radiation into electrical current [40]. Solar energy possesses immense potential to meet global energy demand [41], given that the quantity of solar radiation reaching the Earth’s surface within a single hour exceeds the annual energy consumption of the planet. However, the principal challenge, however, has historically been the effective capture, conversion and utilisation of this abundant resource [42].
Solar energy systems are widely regarded as environmentally sustainable because their operation does not generate GHG emissions or atmospheric pollutants, thereby qualifying them as clean energy sources [43]. A review of the specialised literature further suggests that solar panels may be considered genuinely “green” where their production and manufacturing processes minimise adverse environmental impacts. The cost of solar panel production has declined markedly over the past decade, enhancing their position as a sustainable and economically competitive source of electricity within the contemporary energy landscape [2].
Wind energyWind energy is a naturally occurring and significant source of power generation, offering a sustainable and reliable alternative to fossil-based resources. It is characterised by environmentally benign operation and comparatively low costs compared with other renewable technologies [44]. However, wind resources are inherently intermittent and geographically variable, with mean wind speeds differing markedly across locations [45]. Technological advancements have led to the development of diverse turbine configurations, notably horizontal- and vertical-axis wind turbines, as well as emerging systems such as airborne wind energy and multi-rotor designs [46,47]. Airborne technologies are particularly promising because they harness stronger and more consistent high-altitude winds while requiring fewer structural materials than conventional tower-based systems [48].
Wind energy contributes substantially to sustainability by reducing dependence on fossil fuels, mitigating the impacts of climate change, and enhancing energy security amid declining non-renewable reserves. Innovations include offshore floating hybrid platforms integrating wind, wave, and solar energy [49] and magnetic levitation systems aimed at reducing mechanical losses and maintenance costs [50]. This further strengthens its long-term viability. If fully exploited, wind power could supply approximately 35% of the global energy demand [51].
HydropowerHydropower is a non-combustible renewable energy source distinguished by its substantial generation capacity and storage potential [52]. Compared with more intermittent renewables such as solar and wind, its operational flexibility plays a crucial role in maintaining grid stability and providing a reliable alternative to fossil fuels [53]. It also offers notable advantages in terms of accessibility and long-term sustainability relative to conventional energy sources [54], contributing significantly to the global electricity supply [55]. Hydropower enhances national energy security and supports economic development by delivering affordable electricity to households and industries [56].
From a sustainability perspective, hydropower is instrumental in advancing the SDGs, particularly in promoting universal access to reliable and modern energy services [57]. Empirical findings indicate that increased hydropower consumption significantly reduces carbon dioxide emissions in both the short and long term; a 1% increase in usage is associated with an approximate 0.18% decline in emissions [58]. Hydropower is therefore considered pivotal to achieving net-zero objectives and sustaining long-term environmental quality as a low-carbon energy source with potentially negative abatement costs [59].
Geothermal energyGeothermal energy is a reliable, weather-independent renewable resource with significant potential to contribute to a sustainable energy transition. The Intergovernmental Panel on Climate Change has indicated that geothermal systems could supply a substantial share of global electricity demand [60]. In addition to providing heat and power, geothermal resources enable the extraction of critical raw materials required for various industrial applications [61]. A defining feature of geothermal systems, in contrast to fossil fuel or mineral reserves, is their regenerative capacity. Although heat and fluid extraction creates localised thermal and hydraulic deficits, natural pressure and temperature gradients facilitate gradual resource recovery over time [62].
Geothermal energy closely aligned with the objectives of SDG 7 (Affordable and Clean Energy) [63]. Orebody-Enhanced Geothermal Systems permit the co-production of electricity and critical minerals, supporting emission reductions, resource efficiency and circular economy objectives [64,65]. By combining stable energy provision with sustainable mineral recovery, geothermal systems enhance economic viability and offer a resilient pathway toward long-term decarbonisation [66].
Biomass and biofuelsBiomass energy is derived from organic materials of plant and animal origin, including agricultural residues, timber and waste wood. Combustion generates heat to produce steam for electricity generation [67], whereas gasification converts biomass into fuel for heat and power applications. Although biomass can be renewable when sustainably sourced, it is not inherently clean; certain forms, particularly tree-based biomass, may adversely affect biodiversity and generate higher carbon dioxide emissions than fossil fuels [68]. However, specific biomass pathways provide comparatively low-carbon alternatives under appropriate management conditions [69]. Technological improvements that enhance conversion efficiency and reduce emissions can further strengthen its contribution to sustainable development [70].
Biofuels, such as ethanol and biodiesel, offer a direct combustion alternative. It is widely acknowledged that the utilisation of biofuels can yield several advantageous outcomes, including enhanced sustainability, reduction in GHG emissions, and improved energy security [71]. As a fuel source, biodiesel significantly reduces emissions of toxic and other harmful substances upon combustion, while also being non-flammable, non-explosive, biodegradable, and non-toxic [72]. Thus, biofuels can enhance energy security, reduce GHG emissions and improve sustainability outcomes.
The proposed MPISA framework integrates portfolio trajectory analysis, ownership consolidation mapping, technology classification, competitive concentration assessment, network analytics, and LLM-based semantic clustering. This layered design enables the simultaneous examination of temporal growth dynamics, organisational competition, technological specialisation, and latent thematic structures within the patent corpus. Figure 1 shows a workflow diagram of the framework, illustrating the data flow and sequence of analytical steps across the different layers.
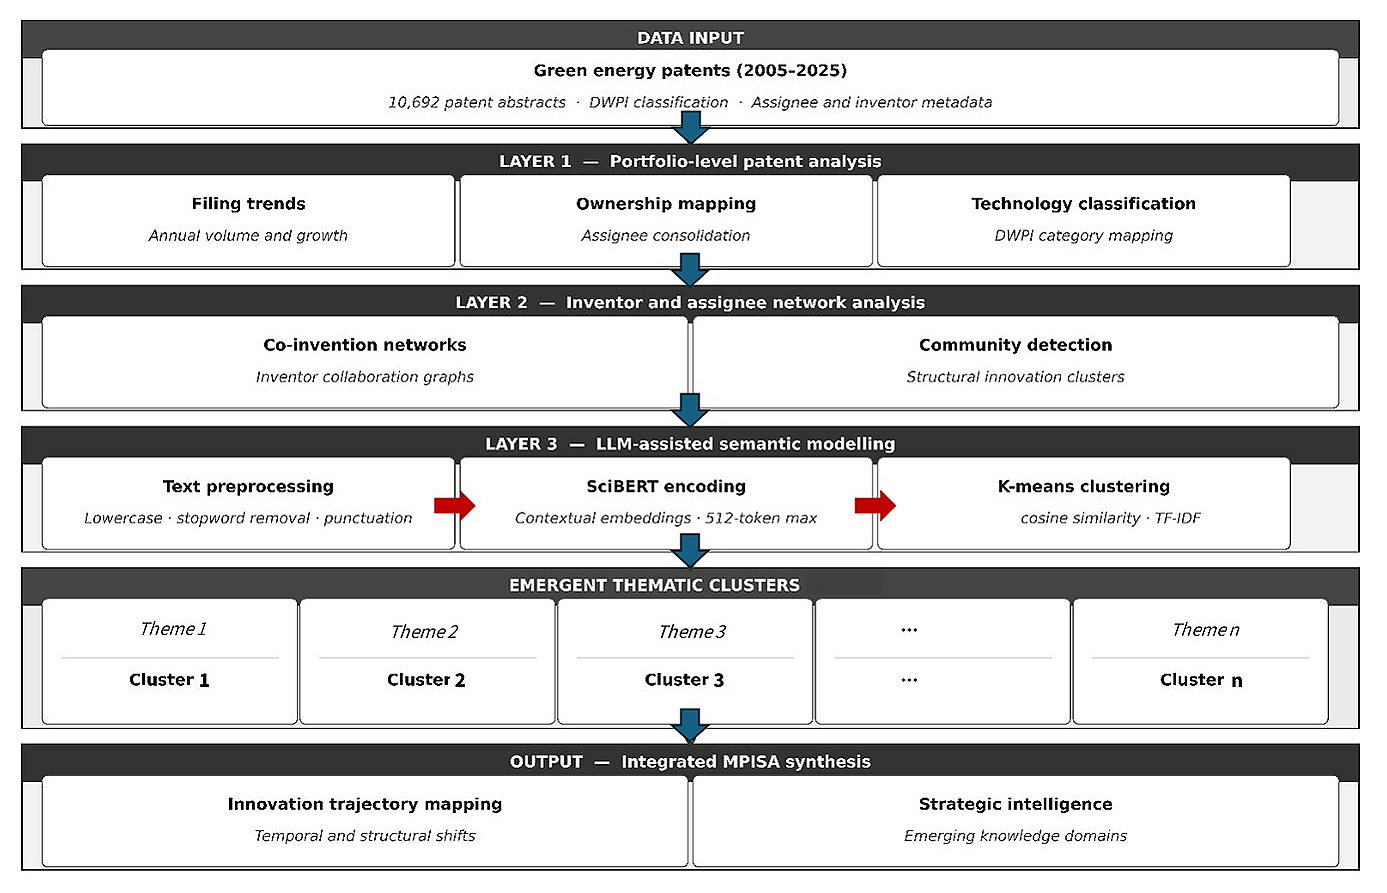 Figure 1. Multi-Layer Patent Intelligence and Semantic Analytics (MPISA) Framework.
Patent data were retrieved and restricted to US patent publications between 2005 and 2025. The initial search yielded 11,554 patent publication records. To avoid multiple counts of the same underlying invention arising from different publication stages or minor updates, records were consolidated at the patent family level. Specifically, multiple publication numbers associated with the same original filing were merged, yielding a final dataset of 10,692 unique patent records. The dataset was divided into three periods to capture temporal shifts in innovation dynamics: 2005–2012, 2013–2017, and 2018–2025. The first two intervals correspond to the phases identified by León et al. (2018) [73], who observed distinct trends in green energy patent development. This segmentation provides a basis for longitudinal comparison across technological and organisational dimensions.
Patent AnalysisThe patent filing intensity was analysed to visualise technology growth trajectories across the three periods. Yearly publication counts and period-level aggregations were used to assess expansion patterns and structural inflection points. Patent distributions were examined across time to evaluate technological diversification and identify shifts in domain emphasis. Heatmaps were constructed across periods for the full corpus (n = 10,692) to capture intensity concentration and expansion patterns at the technology level. This layer establishes the evolution of green energy innovation at the macro level.
Organisational dynamics were analysed at the assignee and ultimate parent levels. Patent counts at the assignee level were used to identify leading entities within each period. Assignees were consolidated at the ultimate parent level to account for corporate restructuring, mergers, and subsidiary ownership, allowing a more accurate representation of technological ownership.
Patent shares were compared across the three periods to identify persistent leaders, new entrants, and entities with declining activity. Ownership concentration was evaluated based on the distribution of patent holdings among top assignees. Assignee–period heatmaps were constructed to visualise shifts in competitive positioning and technology focus over time, providing insight into changes in concentration and competitive structure within the green energy sector.
To complement keyword-based categorisation, patents were mapped to three-digit technology categories in the Derwent World Patents Index (DWPI). This standardised classification enables comparison across technical domains and supports the analysis of technological distribution and overlap. DWPI categories were cross-referenced with assignee information to examine technology specialisation, diversification across domains, and portfolio composition changes over the three periods. This structured classification provides a consistent taxonomy for analysing technology positioning alongside text-based clustering results.
Inventor and assignee collaboration networks based on co-invention and co-assignment relationships were constructed using VOSviewer. Network analysis was performed to examine cluster formation, central actors, and structural connectivity within the innovation system. A comparative analysis was conducted across the three periods to assess changes in network density and collaboration patterns. This approach enables the evaluation of knowledge diffusion structures and inter-organisational linkages beyond individual patent ownership.
LLM-Based Semantic Clustering of Patent AbstractsThe large language model (LLM) was employed to identify recurrent concepts, thematic emphases and patterns across the patents, enabling large-scale and systematic analysis of language use while maintaining analytical transparency and reproducibility. Semantic analysis was subsequently conducted to verify the internal coherence of emergent themes and ensure that they were grounded in the textual corpus rather than predetermined assumptions [74].
The proposed MPISA framework combines conventional patent analysis with LLM-assisted semantic modelling. Contextual language models facilitate the examination of how patent texts articulate and interrelate concepts. Particularly, SciBERT, a transformer-based model trained on scientific corpora, was used to encode abstracts into contextual embeddings that capture semantic similarity beyond simple term frequency [75]. Abstracts of green energy patents were represented using mean-pooled final hidden states to generate fixed-length vectors, implemented via the Hugging Face Transformers library in evaluation mode [76]. This is operated in evaluation mode (model.eval()) with gradient computation disabled (torch.no_grad()), ensuring deterministic forward passes. The input texts were tokenised with truncation and padding to a maximum sequence length of 512 tokens and processed in fixed-size batches (batch size = 16). Document representations were obtained via mean pooling over the final hidden states, weighted by the attention mask to exclude padding tokens. No stochastic decoding or sampling was involved in the embedding stage, as representations were derived directly from the encoder outputs. All preprocessing steps, including lowercasing, punctuation removal, and stop-word filtering, were implemented through a fixed and fully scripted pipeline without manual intervention. For the LLM-assisted thematic identification stage, inference was conducted using a fixed prompt template with temperature set to 0 and top-p = 1, ensuring deterministic outputs. These settings minimise stochastic variation and ensure that the analytical pipeline can be replicated with negligible variance.
To identify latent thematic structures, both Hierarchical Density-Based Spatial Clustering of Applications with Noise (HDBSCAN) and k-means clustering were applied. HDBSCAN, a density-based method, detects clusters of varying shape and density without requiring prior specification of cluster numbers, making it well suited to exploratory analysis of heterogeneous textual embeddings [77]. Following the computational clustering pipeline, the LLM was introduced for semantic interpretation at two controlled stages. First, for cluster-level interpretation, term salience within each cluster was computed using TF-IDF weighting, and the top 30 keywords per cluster were extracted to characterise dominant technological themes for input to the LLM using a fixed prompt to generate concise thematic labels and descriptions, ensuring that cluster interpretation is grounded in textual evidence rather than subjective researcher judgement. Second, the LLM was used to support corpus-level thematic synthesis by identifying recurrent concepts and cross-cluster patterns, enabling systematic and scalable interpretation of the patent landscape at a scale not feasible through manual reading. In both stages, the LLM does not perform or influence clustering and its role is strictly limited to post hoc semantic interpretation of computationally derived structures. A fixed prompt was used throughout the study, with the temperature set to 0 to ensure deterministic and reproducible outputs.
This procedure enables the grouping of patents based on semantic similarity in contextual embedding space rather than relying solely on predefined classification codes, thereby complementing DWPI-based categorisation. This semantic layer identifies of technology groupings driven by contextual similarity rather than formal classification codes, thereby capturing emergent innovation patterns.
Following the MPISA framework, patent growth and technological trajectories were first examined, followed by assignees, ownership and concentration analyses. Collaboration networks among assignees and inventors were constructed and analysed before the LLM-based thematic clustering.
Patent Growth and Technological Trajectory AnalysisPatenting activity remained relatively modest from 2005 to 2009, gradually increasing from 70 patent families in 2005 to 127 in 2009, reflecting a slow growth phase. Between 2010 and 2014, however, the sector entered a period of rapid expansion. The number of patent families surged from 265 to 841, indicating a substantial acceleration in innovation intensity and technological development during this stage. Following this peak, patent output remained at a relatively high level but began to fluctuate. Between 2015 and 2018, the number of patent publications declined moderately from 834 to 652. A slight rebound was observed in 2019 (693), followed by another downturn between 2020 and 2022, reaching a recent low of 494 patent families in 2022. Figure 2 illustrates the patent publication trends measured by the number of DWPI patent families and the solar energy–related patent applications from 2005 to 2025.
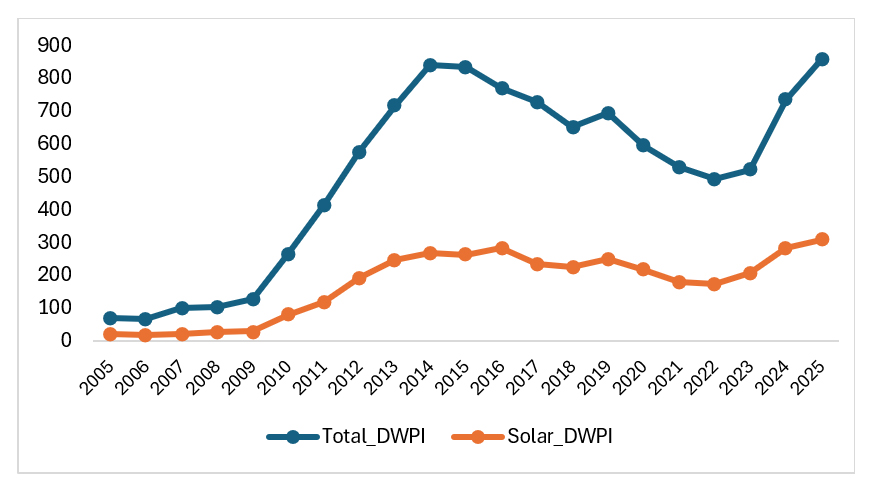 Figure 2. Patent trends for green and solar energy applications.
Figure 2 shows that green energy patent trends closely mirrored those in solar energy applications, a principal technological driver within the broader domain. The downturn in solar patenting largely explains the overall decline in green energy filings. Since 2022, the trend has reversed, exhibiting renewed growth and expansion. This strong rebound suggests a resurgence of innovative activity, potentially reflecting intensified R&D investment and accelerated technological advancement in recent years. This cyclical pattern is consistent with contemporary developments in the life cycle theory of technology, conceptualising technological progress as an S-shaped trajectory moving from emergence to rapid growth, maturity, and potential saturation [78,79]. Importantly, this framework does not interpret periods of declining innovation output as simple linear decay; rather, such downturns may indicate technological exhaustion or a transition toward a new technological paradigm. Empirical applications in sustainable energy technologies reinforce this view. For instance, combined life cycle and hype cycle analysis of solar thermal technologies indicates that the waves of patenting activity and attention often precede structural shifts and renewal cycles [80]. The patent dynamics observed in green energy align with an evolutionary logic in which technologies advance through identifiable maturity stages while remaining subject to paradigm shifts that trigger subsequent growth waves.
Assignee, Ownership, and Concentration AnalysisFrom the total patent filing perspective in Figure 3A, IBM leads with 333 patents, far exceeding traditional solar companies such as SunPower (236) and First Solar (180). This phenomenon reflects the strategic positioning in green energy technology of tech giants. Although IBM is not a traditional energy company, its green energy patent portfolio is primarily concentrated in DWPI categories L03, U11, and A85. L03 encompasses electrochemical and electrical materials, including batteries, fuel cells, and related energy storage technologies, which form the technical basis for hydrogen and storage applications. Moreover, U11 relates to semiconductor materials and fabrication processes, including crystal growth and doping technologies relevant to photovoltaic and power electronic devices. A85 covers application-oriented electrical systems such as power control technologies, smart grid components, and integrated energy management systems.
Figure 3B presents the consolidation of patents at the ultimate parent level, where Tesla emerges among the top patent-holding entities. Corporate tree consolidation indicates that Tesla’s green energy patent portfolio extends beyond electric vehicle technologies and includes substantial activity in energy storage and photovoltaic systems. Tesla incorporates patents related to battery chemistry, supercapacitors, and electrochemical storage materials through the acquisition of Maxwell Technologies Inc. The acquisition of SolarCity Corp. adds a portfolio of solar generation technologies, including photovoltaic modules, installation systems, and related grid integration components. When consolidated at the ultimate parent level, Tesla’s portfolio reflects an integrated positioning across energy generation (solar), storage (batteries and capacitors), and system-level energy management. This cross-domain coverage aligns with the DWPI classifications in electrochemical materials, electrical applications, and semiconductor-related technologies, indicating that DWPI is more technologically broad than a single-domain specialisation. The parent-level analysis suggests that Tesla’s green energy innovation activities are structured around vertically connected technologies spanning generation, storage, and deployment rather than isolated component-level development.
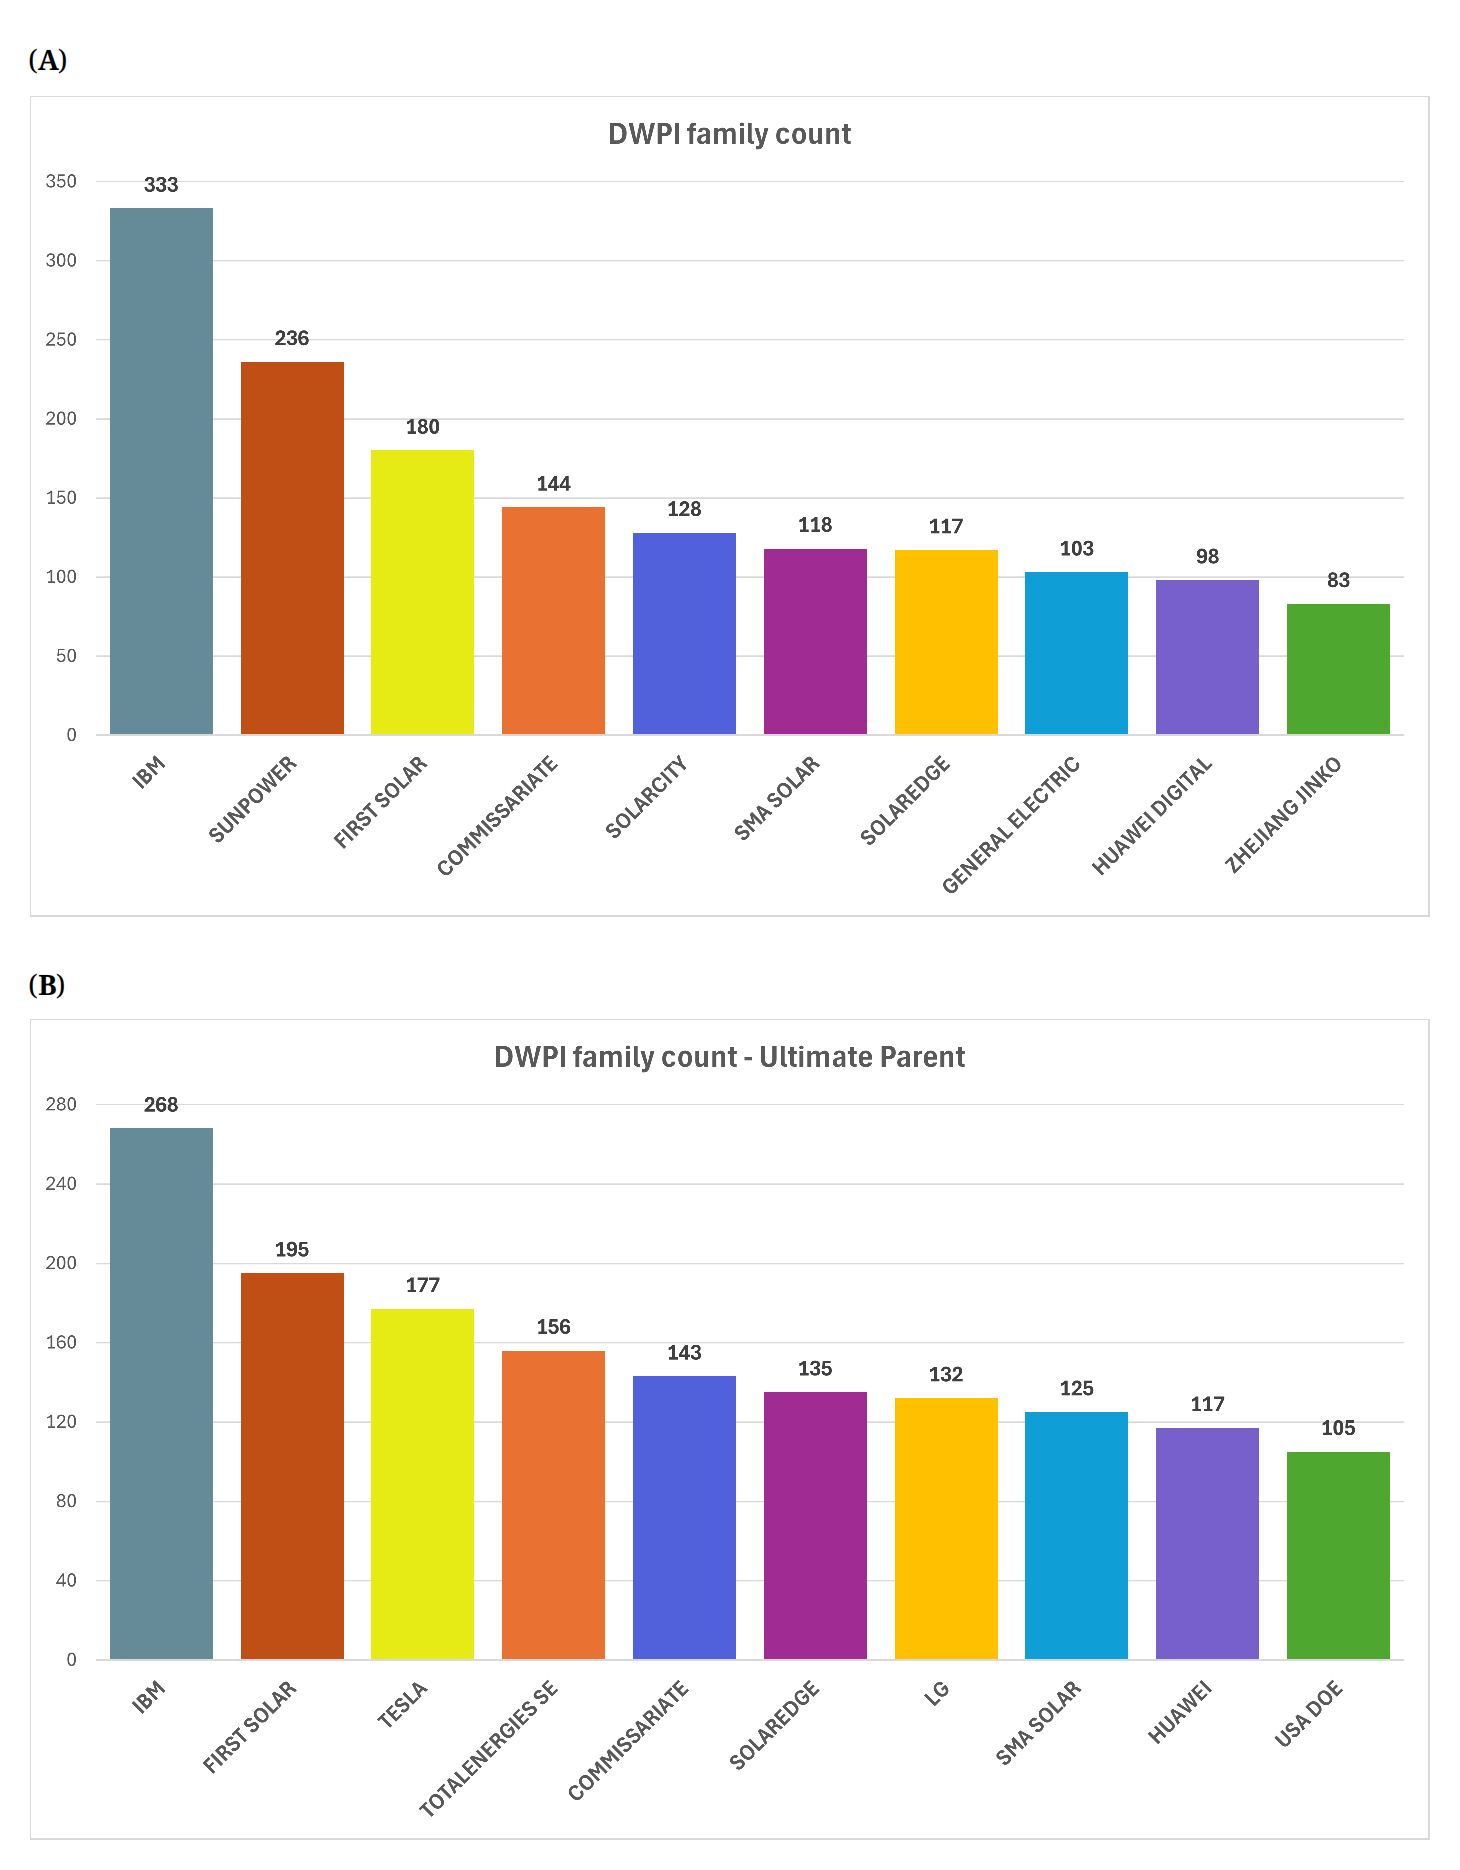 Figure 3. (A) Top green energy patent assignees; (B) Ultimate parents of the assignees.
Figure 4 reveals a highly concentrated and temporally uneven competitive landscape. Earlier leaders, including IBM, First Solar, and SolarCity, peaked around 2018, after which their patenting intensity declined markedly. Several previously dominant firms have since reduced activity substantially or exited sustained innovation efforts altogether.
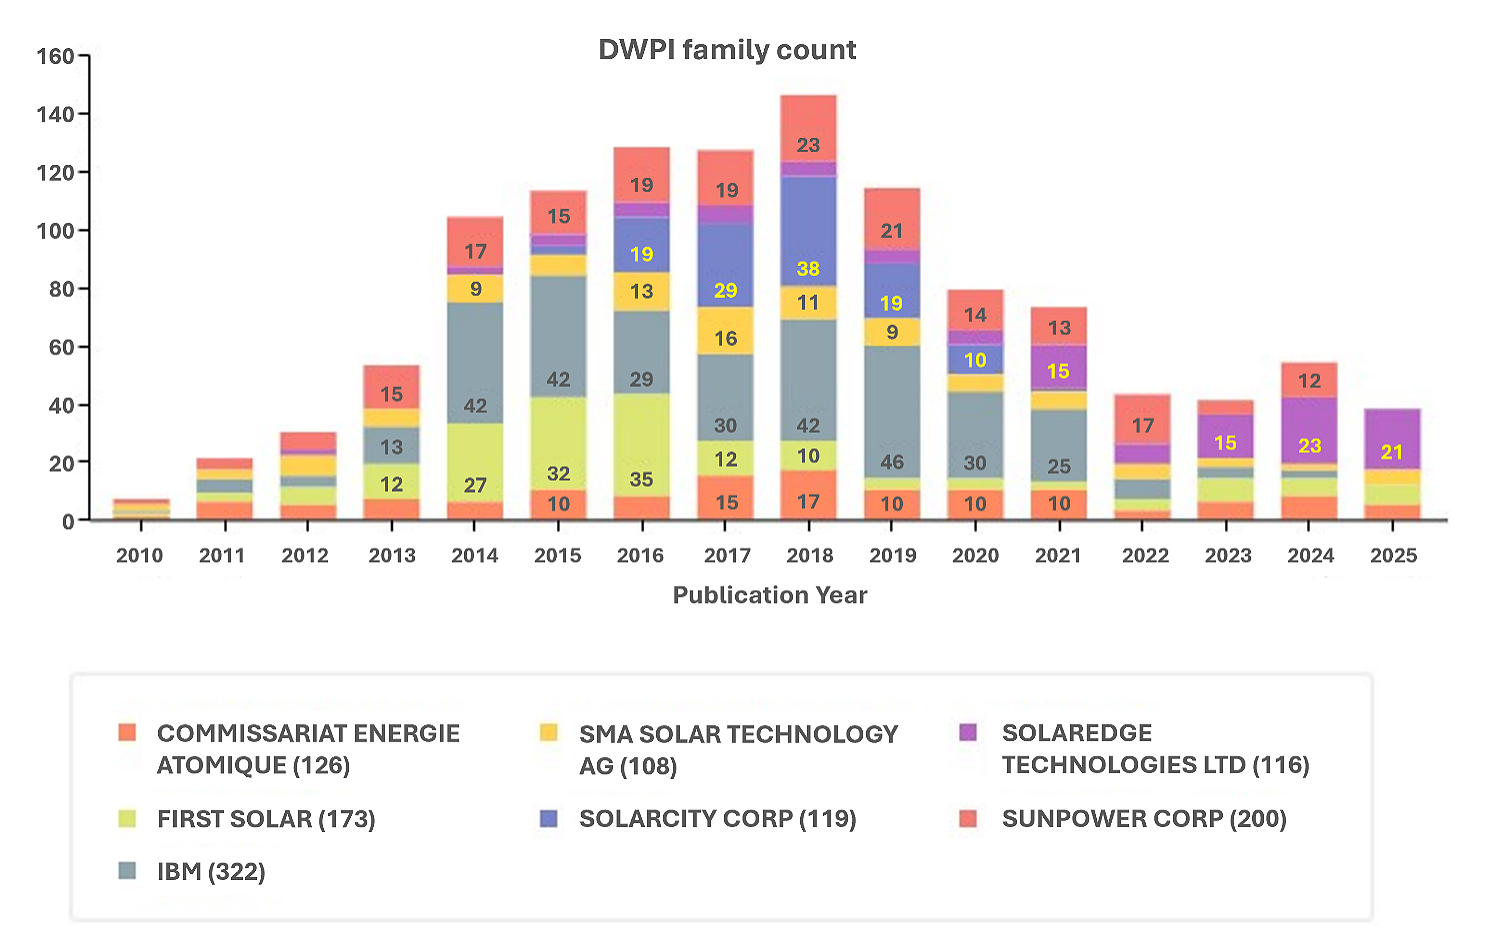 Figure 4. Top assignee concentration.
As a leading assignee in the green energy domain, SolarCity Corp demonstrates a highly concentrated patent filing trajectory, with activity peaking between 2015 and 2019, followed by a sustained decline in subsequent years. Annual filings increased from 3 patents in 2015 to 38 in 2018, followed by a steady reduction (19 in 2019, 10 in 2020, and 1 in 2021). Post-2021 filings are negligible within the dataset. The decline coincides with Tesla’s acquisition of SolarCity in 2016 and subsequent parent company portfolio consolidation. SolarCity’s portfolio is primarily concentrated in DWPI category X15, associated with semiconductor device technologies, consistent with photovoltaic module and cell-related innovation. Additional activity is observed in Q45, U12, and L03, covering energy conversion, power transmission, and electrochemical or electrical materials. The portfolio composition focuses on photovoltaic generation technologies and associated installation systems, with a comparatively limited emphasis on advanced energy management or software-oriented grid optimisation technologies. The trajectory reflects structural shifts within the solar sector during the study period, with reduced independent patent activity following integration into a larger corporate framework.
In contrast, SolarEdge exhibited sustained and consolidated patent momentum during 2021–2025, maintaining steady annual filings. The technology classification breakdown reveals the focused innovation strategy of SolarEdge. The dominant categories comprise X15 (Semiconductor Devices) and S01 (Measuring and Testing), which are likely associated with power conversion and inverter technologies, reflecting the core expertise of SolarEdge in DC optimisers and smart inverter systems. Categories U24 (Electric techniques not otherwise provided for), U12 (Transmission or distribution of electric power) and X12 (Heating; Lighting; Weapons; Blasting) suggest significant investment in energy storage systems, grid integration, and monitoring technologies. This diversified yet concentrated patent portfolio demonstrates SolarEdge's position in the most critical segment of the industry: maximising energy harvest efficiency and enabling intelligent power management. Rather than competing in basic photovoltaic cell manufacturing, SolarEdge dominates the “brain” of solar systems that optimise performance, enhance safety, and enable smart grid integration, representing the future direction of distributed renewable energy.
While legacy hardware-oriented players such as SunPower accumulated substantial historical portfolios but slowed after 2020, SolarEdge (116 total patents) continues to expand its technological footprint. Thus, the observed shift represents not merely firm-level fluctuation but a reconfiguration of technological leadership: incumbent manufacturers retreat as new actors consolidate influence around digitally coordinated and efficiency-oriented energy architectures. Patent assignee analysis offers direct insight into which organisations are actively shaping emerging technological trajectories. The observed transition—from traditional industrial incumbents to firms with strong digital and systems-integration capabilities—illustrates how innovation leadership in the green energy sector is being reconfigured around digitally coordinated and efficiency-oriented energy architectures, a transformation that is not readily visible through aggregate economic indicators alone.
Keyword-based clustering of patent abstracts across three time periods was conducted to further examine whether the observed changes reflect firm-level dynamics or underlying technological reorientation. Figure 5 presents the clustered topic distributions for the three temporal phases, illustrating the evolution of technological priorities in green energy innovation.
Figure 5A shows a dispersed innovation landscape dominated by renewable energy technologies. Wave energy and biofuel-related themes collectively account for a substantial share of patent activity, indicating an emphasis on chemical- and marine-based renewable pathways. Solar-related system components, including inverter technologies, are present but not yet central. The pattern reflects broad experimentation across multiple renewable domains.
Figure 5B indicates a pronounced shift toward solar photovoltaic technologies and system integration. Inverter-related topics have risen sharply and become the dominant cluster, accompanied by growth in organic materials and building-integrated applications. The core photovoltaic device components expand concurrently. In contrast, biofuel and marine energy themes decline in prominence. The distribution indicates the consolidation of innovation activity around solar-based technological architectures. This pattern reflects the rapid expansion of assignees specialising in these domains, including IBM and SolarCity.
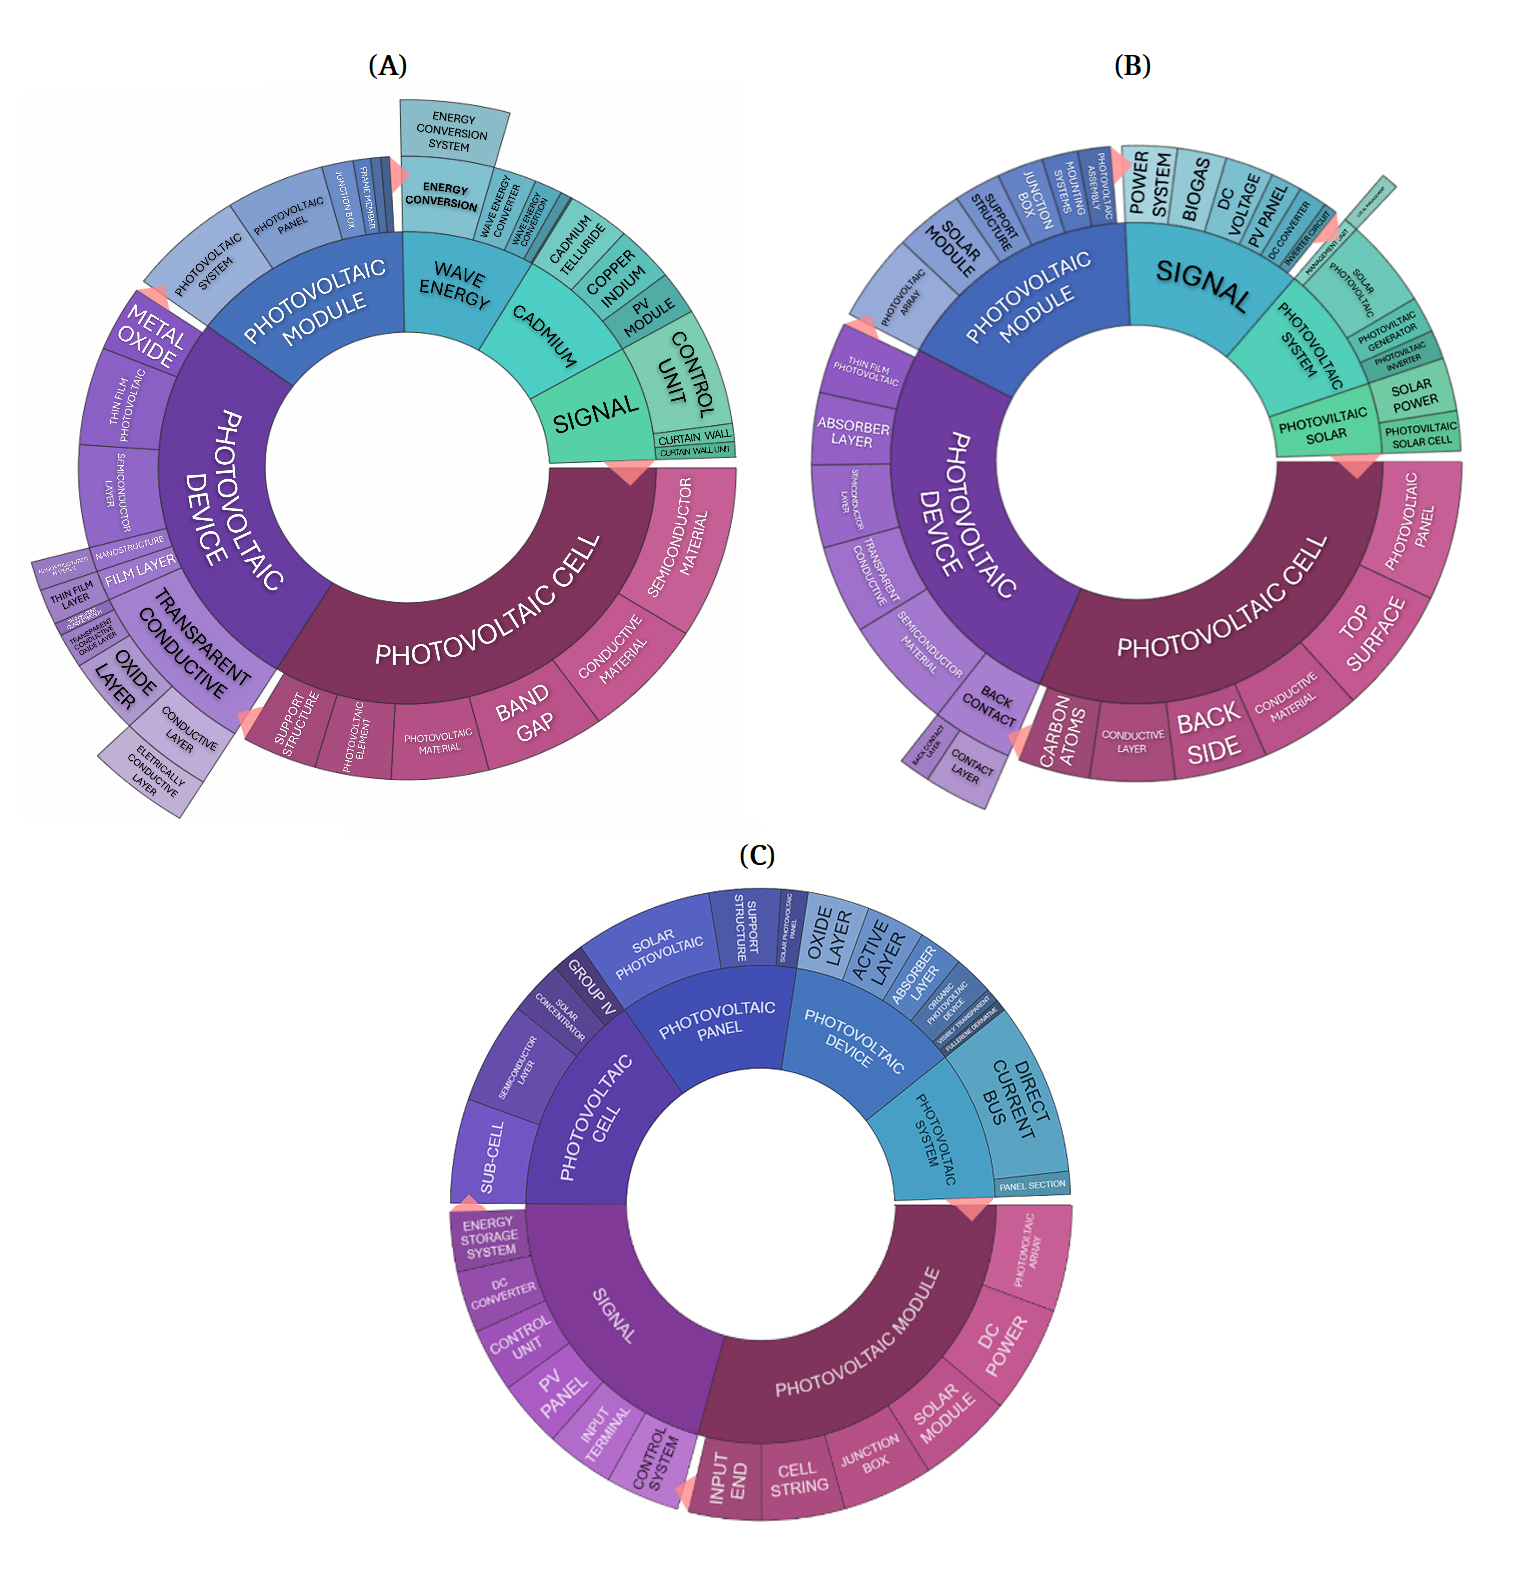 Figure 5. Green energy patent clusters: (A) 2005–2012; (B) 2013–2017; (C) 2018–2025.
Figure 5C demonstrates further concentration in advanced material engineering and system optimisation. This cluster composition is dominated by multilayer device structures and substrate-related topics, reflecting intensification in photovoltaic material research, particularly in next-generation architectures. The representation of intelligent control and switching technologies also increases, indicating deeper integration of power management systems. Peripheral renewable themes persist but no longer structure the core innovation agenda. Figures 5A–C document a sequential transition from diversified renewable exploration to photovoltaic consolidation and, subsequently, to material-driven optimisation and intelligent system control.
According to Figure 5, the innovative centre of gravity had already shifted toward photovoltaic system integration and perovskite-based material engineering before such changes became visible in the published literature. Therefore, the results empirically substantiate the temporal advantage of patent data academic sources in identifying the evolving frontiers of technological development.
Analyses of the three-period patent technology landscape maps (Figure 6) provide additional evidence of sequential reorientation in green energy innovation.
Figure 6A displays a dispersed technological structure encompassing multiple renewable pathways. Wave energy ranked first, whereas bioenergy-related themes, e.g., biodiesel, ester, alkyl, and biogas, collectively occupied substantial shares. Inverter technologies were present but not structurally dominant. Materials-related topics, such as thin-film devices and conductive layers, were prominent, reflecting the emphasis on manufacturing processes. The distribution reflects a multi-directional experimentation phase in which marine and fuel-based renewables competed alongside early photovoltaic development, without a clearly established technological core.
Figure 6B shows a structural shift in this stage. Inverter technologies became the leading topic, more than tripling from the previous period, marking a transition from energy-type experimentation toward photovoltaic system integration. Organic materials and roof-related applications have expanded significantly, indicating a growing emphasis on building-integrated photovoltaics. The number of core photovoltaics components, including absorber layer and DC systems, also increased markedly. In contrast, biodiesel, fuel, and wave-related themes declined in prominence. The technological centre of gravity consolidated around solar photovoltaic architectures and power management systems.
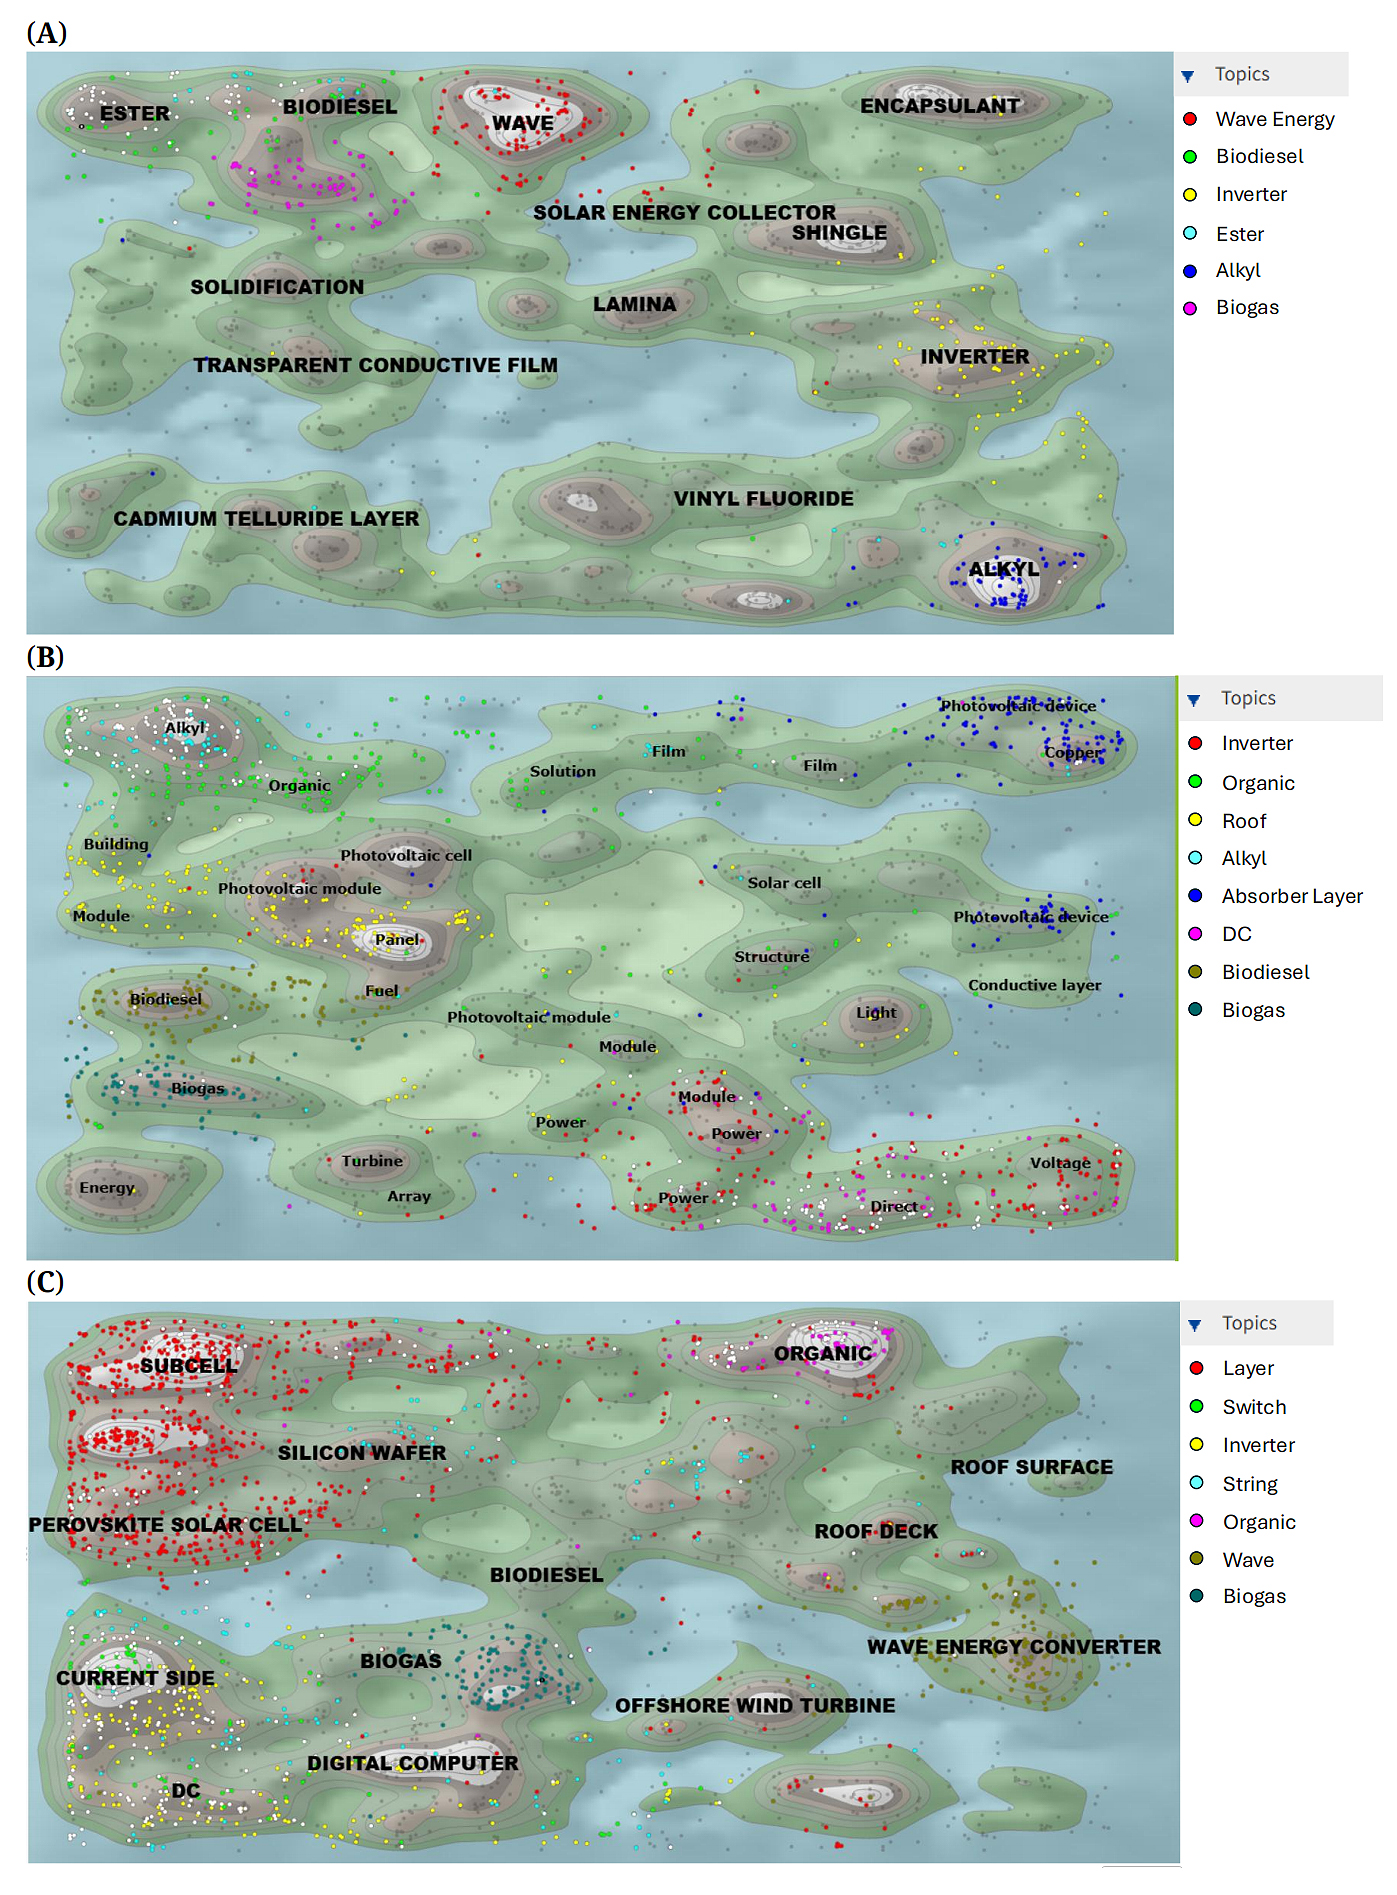 Figure 6. (A) Diversified exploration phase from 2005 to 2012; (B) Solar consolidation phase from 2013 to 2017; (C) 2018–2025 Integrated and intelligent systems phase.
Figure 6C reveals further structural concentration coupled with deeper integration. The category layer dominates the landscape, while the substrate expanded substantially, reflecting the intensification of multilayer photovoltaic device architectures, particularly perovskite-based systems. Concurrently, intelligent control technologies, including switches and strings, have gained prominence, indicating the deepening of system-level optimisation. Perovskite emerged explicitly as a distinct topic, confirming the rise of next-generation photovoltaic materials. During this phase, the overall technological trajectory is firmly centered on high-efficiency solar materials and intelligent power management systems.
Assignee and Inventor Collaboration NetworkThe assignee-level heatmap in Figure 7 illustrates clear technological clustering and differentiated competitive positioning among major firms. IBM records the highest patent volume, with a relatively dispersed distribution across technology domains, suggesting broad cross-disciplinary capabilities spanning power conversion, control systems, and materials-related technologies. However, its presence in the manufacturing of core photovoltaic modules appears comparatively limited.
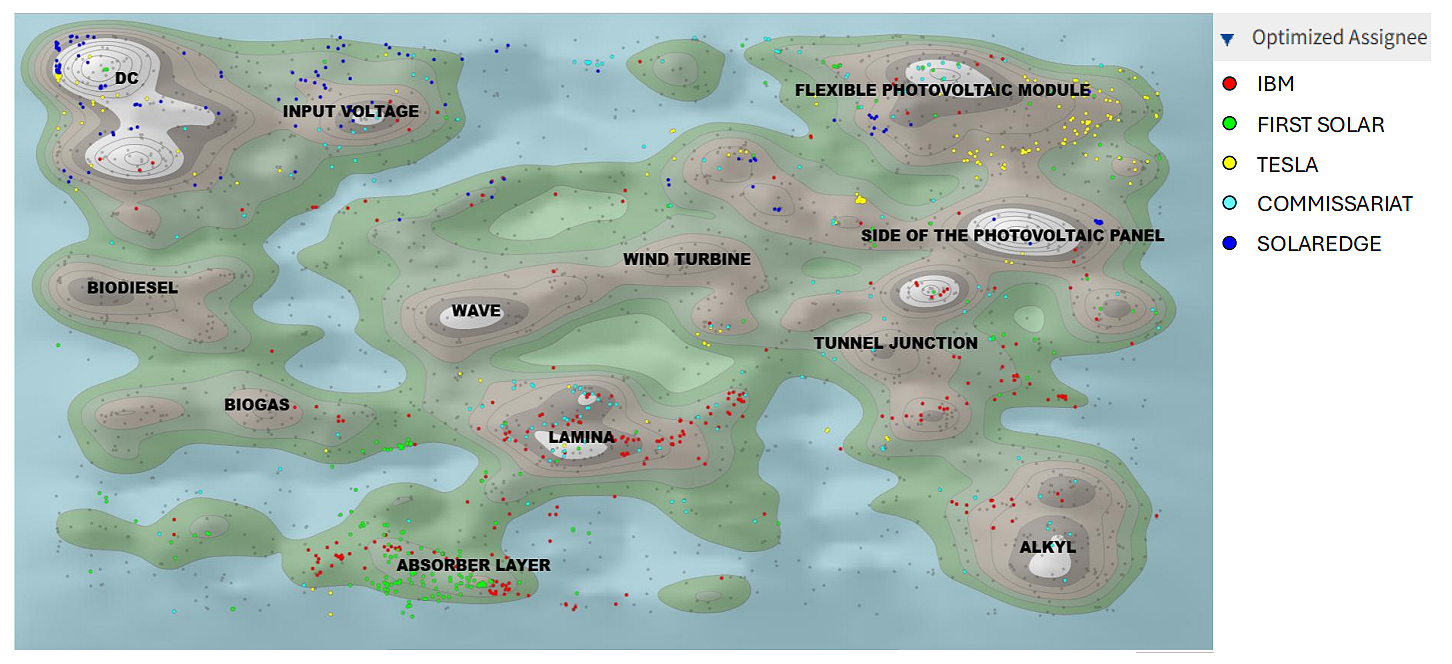 Figure 7. Assignee heatmap.
In contrast, First Solar and Tesla display a pronounced concentration around module-related and system-integration themes, indicating strengths in photovoltaic device development and storage-coupled energy systems. Huawei and SolarEdge cluster strongly in the inverter and intelligent control categories, reflecting their competitive specialisation in power electronics and energy management infrastructure. Overall, the heatmap indicates a structural shift in competitive dynamics from isolated advances in materials or specific energy pathways to system-level competition centred on high-efficiency device architectures and intelligent power management integration.
In addition, co-occurrence networks were constructed at the assignee and inventor levels using VOSviewer to examine structural interaction patterns in the green energy innovation system. The density visualization in Figure 8 reveals a partially centralised structure characterised by a dense core surrounded by peripheral nodes and confirms a core–periphery configuration. High-density zones are concentrated around established industrial–research hubs, whereas peripheral regions correspond to firms with narrower collaborative footprints. The overall structure reflects selective connectivity within the green energy innovation ecosystem, with collaboration concentrated among a subset of highly embedded actors while a substantial proportion of assignees remain weakly linked.
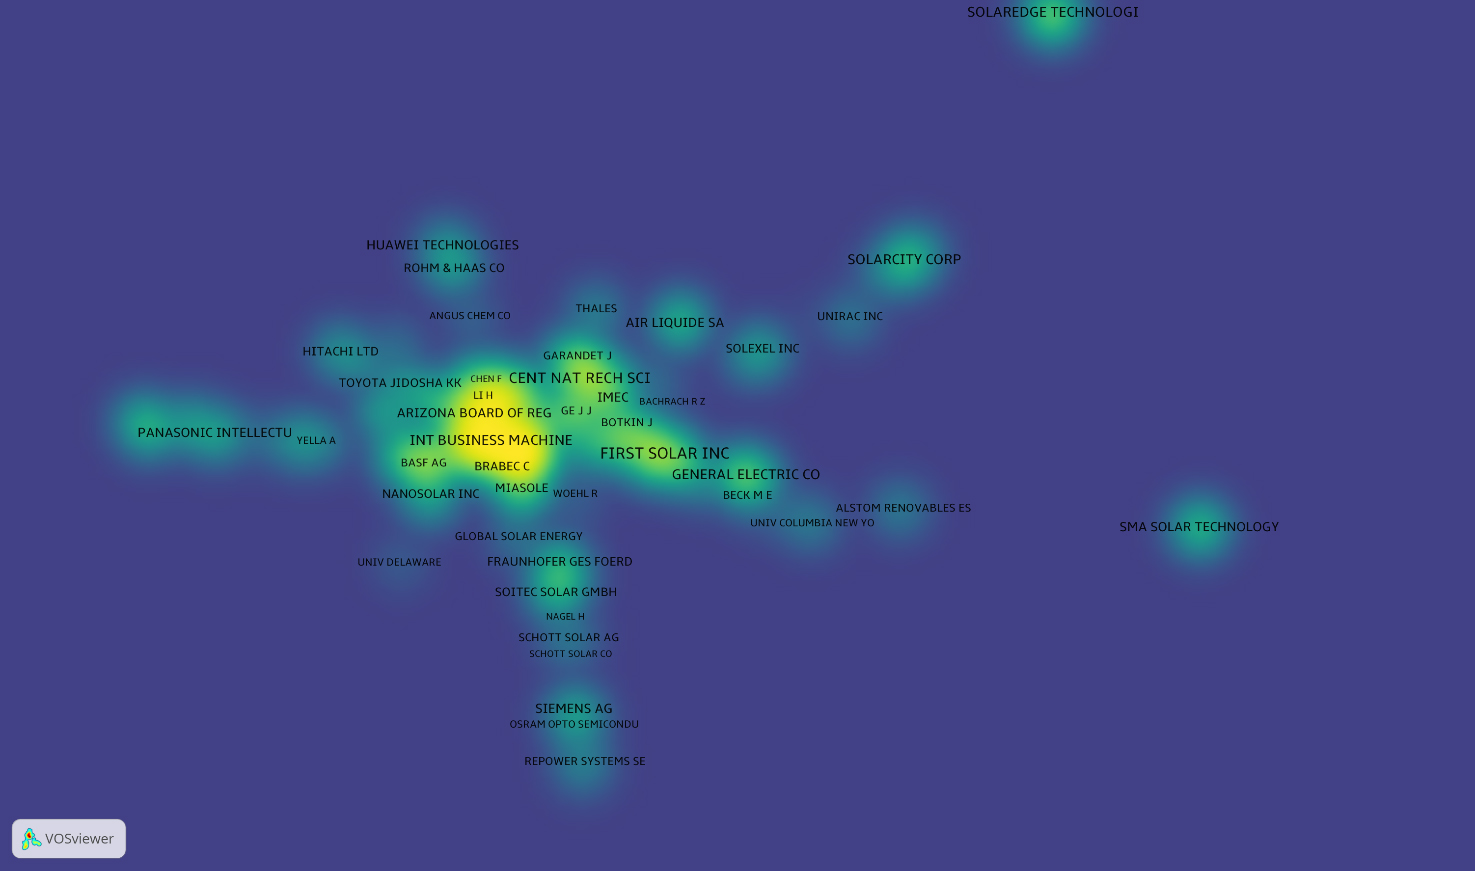 Figure 8. Assignee density visualisation.
In contrast, several prominent technological firms, such as SolarEdge, SolarCity, and SMA Solar, are positioned at a greater spatial distance from the central cluster. Their relatively lower degree of connectivity suggests that the assignee network has more specialised or internally concentrated innovation strategies rather than broad collaborative engagement.
Using a stricter minimum link strength of five, 1531 of 3149 qualified inventors were connected within the collaboration network. The inventor map (Figure 9) exhibits a more modular structure composed of tightly knit clusters than the assignee network. Collaboration is predominantly team-based, with strong intra-group ties and limited cross-cluster integration.
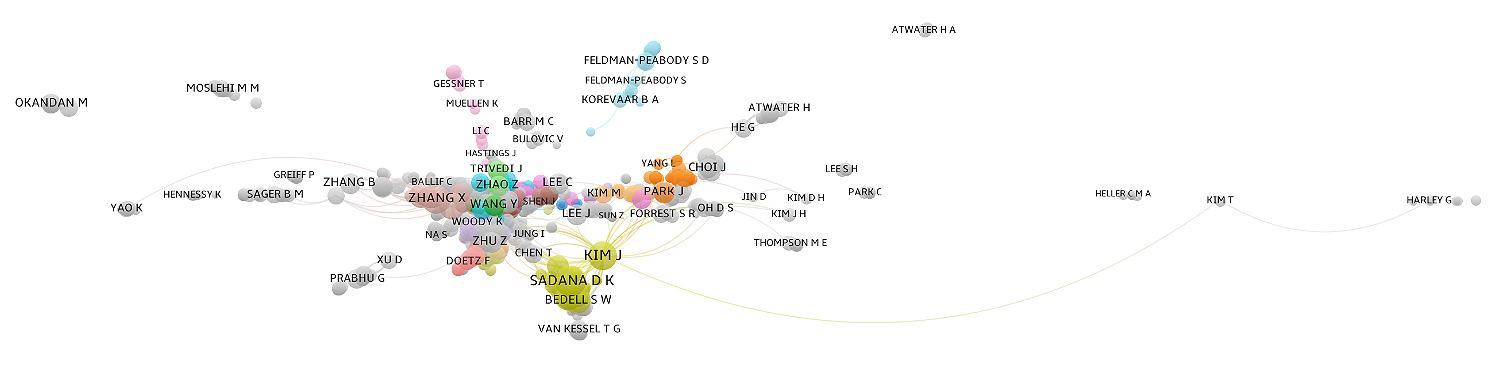 Figure 9. Inventor network.
The two network levels reveal differentiated connectivity patterns. Organisational collaboration demonstrates selective centralisation around major industrial research hubs, whereas inventor collaboration is more locally cohesive and modular. This dual structure suggests that technological evolution in the green energy domain is driven by concentrated organisational cores and specialised inventor teams, rather than uniformly distributed collaboration across the ecosystem. Network configuration complements the earlier topic and concentration analyses, indicating that uneven connectivity at both institutional and individual levels accompanies technological consolidation.
LLM-based Semantic Clustering of Patent AbstractsClusters of related terms were delineated by examining the interrelationships among concepts, enabling a more nuanced understanding of dominant themes and emerging trends. Braun and Clarke’s six-phase [81] thematic analysis was applied in addition to the semantic analysis described above, encompassing data familiarisation, initial code generation, theme identification, theme review, theme definition, and report writing. To support the code generation and theme identification stages of the thematic analysis, t-distributed Stochastic Neighbour Embedding (t-SNE) was applied to project the 768-dimensional SciBERT embeddings into a two-dimensional space, enabling a qualitative evaluation of the distribution and separability of abstract representations. Figure 10 presents the resulting two-dimensional scatter plot, with data points coloured according to their respective k-means cluster assignments. t-SNE provides a low-dimensional projection for visual inspection and does not preserve global distances; therefore, clusters identified by k-means were interpreted using centroid proximity and representative abstracts rather than visual separation alone.
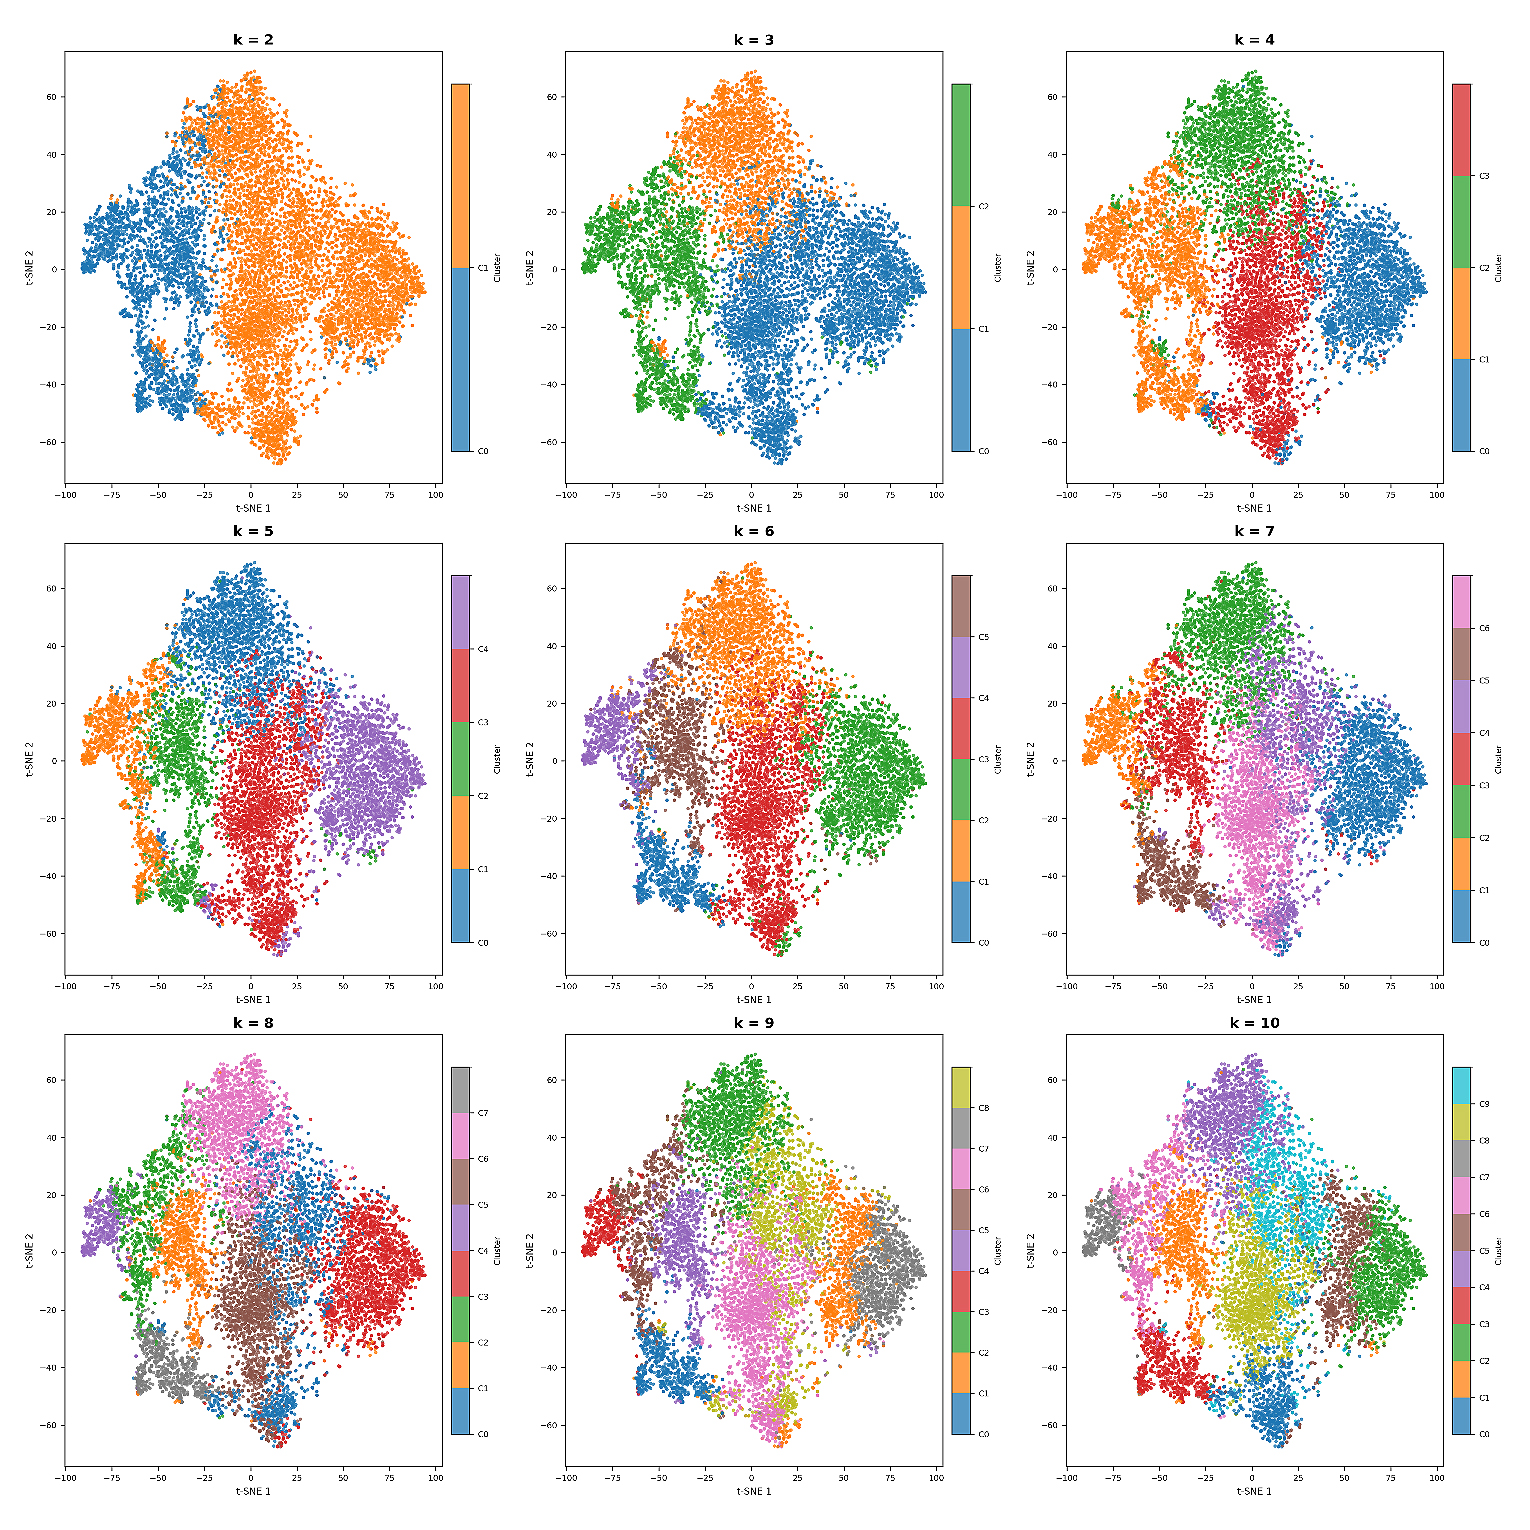 Figure 10. t-SNE visualisation of clustered abstracts using SciBERT embeddings.
K-means clustering was performed with a fixed random seed (random_state = 42) to ensure consistent starts and reproducible partitioning. Clustering solutions across k = 2 to k = 10 were systematically evaluated using three internal validation indices: silhouette coefficient, Davies–Bouldin Index (DBI), and Calinski–Harabasz Index (CHI), as shown in Table 1. Cluster selection therefore the dual criteria of statistical acceptability and domain interpretability. As expected, these metrics favour lower k values, reflecting stronger geometric separation at coarser partitions. This is a recognised characteristic of high-dimensional transformer embedding spaces, where semantic distinctions are distributed and continuous rather than geometrically discrete, representing a known limitation of internal metrics in this context [82]. While k = 2 yielded the strongest geometric separation across all three indices (silhouette = 0.143, DBI = 2.325, CHI = 1679.71), the two-cluster solution collapsed substantively distinct green energy innovation domains into insufficiently granular groupings, rendering the output unsuitable for technology-level patent analysis.
 Table 1. Internal Clustering Validation Metrics Across k = 2 to 10 (SciBERT Embeddings).
According to Table 1 and Figure 10, configurations with k = 7 to k = 10 exhibited progressive poorer performance across all three indices along with increasing cluster fragmentation and were rejected on both statistical and interpretive grounds. As Table 1 shows only insignificant differences in statistical acceptability for k = 3 to k = 6, Figure 10, which reflects domain interpretability, was consequently used to determine the optimal k. Considering configurations at k = 3, distinct innovation domains including bioenergy conversion, organic photovoltaic chemistry, and semiconductor device engineering remained conflated within single clusters. This provides no meaningful improvement in thematic resolution. In contract, configurations at k = 6 introduced subdivisions within the already coherent domains. Photovoltaic device and materials engineering were split into two clusters sharing nearly identical core vocabulary, including photovoltaic, semiconductor, substrate, silicon, coating, and absorber, with differences limited to minor process-level emphasis, such as deposition and nanoparticles, in one subcluster.
Validation metrics remained within an acceptable range, while yielding four- and five five-cluster solutions that were thematically coherent and mutually distinguishable, corresponding to recognisable innovation streams in the green energy literature. Compared with k = 4, configurations at k = 5 differentiates themes such as bioenergy processes, organic photovoltaic materials, and semiconductor device engineering into separate clusters, thereby avoiding the problem of over-aggregation. Accordingly, k = 5 was selected as the most parsimonious and analytically meaningful configuration, balancing statistical coherence with domain interpretability, consistent with established practice of scientific corpora in embedding-based clustering [83].
Table 2 shows the results of the five clusters that demonstrated good thematic coherence and domain specificity. Cluster 0 represents an integrated approach to renewable energy by combining biomass energy conversion and photovoltaic materials. Biomass energy technologies, including biogas, biodiesel, fermentation, anaerobic, and ethanol, produce fuels from organic waste, simultaneously enabling energy recovery and waste management. Advances in photovoltaic materials, particularly photovoltaic, perovskite, semiconductor, and silicon, have enabled efficient solar-to-electric conversion. The intersection of these domains lies in hybrid systems, where photovoltaic electricity powers biomass energy conversion units, and biogas or biodiesel can complement intermittent solar generation. Such integration enhances energy resilience, promotes circular resource use, and reduces lifecycle emissions, offering a holistic pathway toward sustainable energy infrastructure.
Cluster 1 focuses on photovoltaic materials engineering and optical structure design in solar cells. Key materials such as silicon, perovskite, cadmium, and graphene, are engineered to optimise the cell’s light absorption and charge transport. Structural processes, including layer deposition, coating, etching, transparent electrode integration, and dielectric layer fabrication are employed to enhance internal optical management and maximise energy conversion efficiency. The interplay between materials and structural processes determines critical features, particularly the internal material composition and optical performance of the absorber, enabling precise control of light harvesting, loss minimisation, and improved overall device efficiency. This integrated approach underpins the advancement of high-performance, next-generation solar cell technologies.
Cluster 2 addresses the power management of photovoltaic power generation systems, emphasising the integration of power electronics and system monitoring technologies. Inverter, converter, and maximum power point tracking (mppt) technologies facilitate energy conversion, optimising the efficiency of electricity generation from photovoltaic panels. Advanced monitoring, detection, and sensor technologies enable comprehensive system monitoring, ensuring real-time assessment of system performance and rapid fault identification. The integration strategies of energy systems, including coupling with biogas units or turbine-based systems such as wind or hydropower, enhances energy supply stability and reliability. Application scenarios span the entire energy chain, from photovoltaic panels through inverters and converters to the power grid, enabling efficient, resilient, and sustainable energy management.
Cluster 3 focuses on organic and polymer photovoltaic materials chemistry, emphasising the synthesis and optimisation of organic materials for solar energy applications. Key organic materials include polymer, copolymer, thiophene, and fullerene, which are engineered to enhance light absorption, charge transport, and overall device performance. Core chemical processes such as polymerization, the use of catalyst systems, and appropriate solvent selection are critical for controlling molecular structure, morphology, and electronic properties. The group also intersects with related technologies such as biodiesel, highlighting the potential to leverage shared chemical principles in organic synthesis for both biofuel production and high-performance organic photovoltaic material development. This integrative approach advances the design of efficient, sustainable, and chemically versatile organic solar cells.
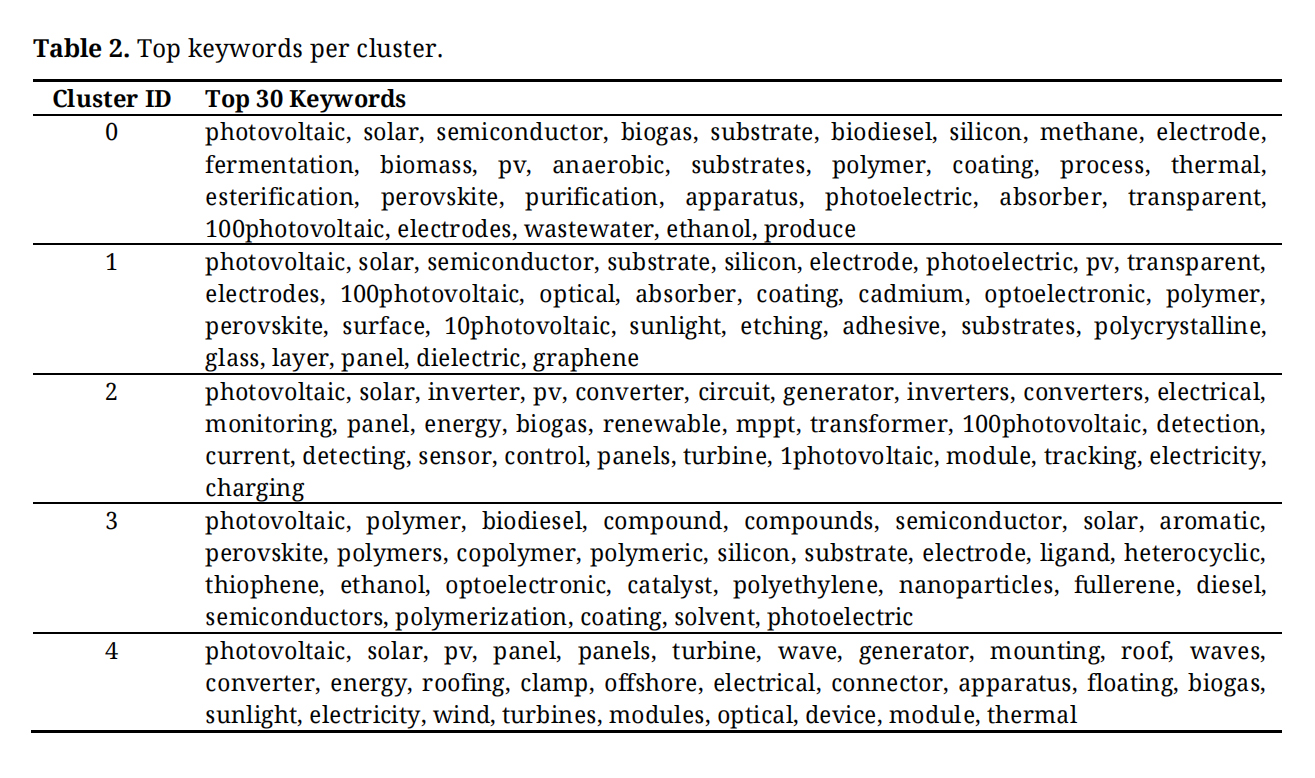 Table 2. Top keywords per cluster.
Cluster 4 focuses on the hardware and installation of renewable energy systems, highlighting the integration of system-level integration and mechanical structure principles in practical deployment. Key installation elements include mounting, roof, clamp, and floating configurations, such as those used in reservoir photovoltaic systems, which provide flexibility in diverse deployment environments. The cluster also emphasises multi-energy integration, combining solar, wave, wind, and biogas sources to enhance system resilience and optimise energy output. Critical hardware components, including connector and apparatus elements, ensure structural stability, electrical connectivity, and operational reliability. The focus on these characteristics underscores the importance of the physical deployment of large-scale systems and the effective coupling of multiple energy sources, enabling sustainable, efficient, and adaptable renewable energy infrastructures.
The distribution of keywords across the five clusters reveals a sophisticated hub-and-spoke network topology, where central nodes such as photovoltaic, semiconductor, and biogas function as cross-disciplinary anchors. This structural repetition is not indicative of categorical redundancy but reflects the multi-layered nature of the green energy field that traces technologies from molecular synthesis to infrastructural deployment. These clusters are best conceptualised as a hierarchical technology stack. At the foundational layer, Cluster 3 (photovoltaic device engineering; red cluster in Figure 10) and Cluster 1 (organic photovoltaic chemistry; orange cluster in Figure 10) focus on the chemical synthesis and physical structure of inorganic and organic photovoltaics. Parallel to this, Cluster 0 (bioconversion; blue cluster in Figure 10) represents a biological energy pathway, that shares electrochemical principles with photovoltaics through common elements like electrodes and substrates.
The framework transitions to Cluster 2 (power management; green cluster in Figure 10), which constitutes an intermediate control layer. This stage processes energy from subordinate layers, using inverters and tracking to optimise the efficiency of both photovoltaic panels and biogas generators. At the apex, Cluster 4 (system integration; purple cluster in Figure 10) embodies the deployment layer, integrating these refined technologies into practical environments such as rooftops and offshore platforms. This vertical progression is underpinned by horizontal integration, where semiconductors serve as solar absorbers and high-speed electronic switches. Ultimately, this ecosystem demonstrates that the sustainability of energy infrastructure depends on porous boundaries between disciplines. The research landscape ensures functional coherence across the entire energy value chain by coupling diverse energy carriers and managing their conversion stages, from microscale materials development to macroscale grid implementation.
This study systematically analysed the evolution of green energy innovation from 2005 to 2025 based on the proposed MPISA framework. The findings reveal a cyclical patenting trajectory: a modest emergence phase (2005–2009), a rapid surge in innovation (2010–2014), a period of fluctuation and consolidation (2015–2022), and a robust resurgence since 2022. The technological landscape has undergone a sequential reorientation, transitioning from diversified renewable exploration (wave energy and biofuels between 2005 and 2012) to solar photovoltaic consolidation (2013–2017) and finally to an integrated and intelligent systems phase (2018–2025). This latest phase is defined by material-driven optimisation, such as perovskite-based architectures, and the deep integration of intelligent control and switching technologies. Analysis of leading assignees further demonstrates that while traditional hardware manufacturers have slowed down, tech giants and vertically integrated firms such as IBM and Tesla are consolidating influence by bridging the gap between energy generation, storage, and digital power management. In addition, the findings from the LLM-based thematic clustering indicate that green energy innovation is structured as a hierarchical technology stack rather than as a collection of isolated fields. Five distinct themes span materials chemistry, device physics, bioconversion, power management, and system integration, corresponding to four hierarchical layers: the foundational layer, the biological energy pathway, the intermediate control layer, and the deployment layer.
The findings of this study collectively affirm what patent-based analysis can reveal that publication-lagged and policy-level methods structurally cannot. The documented patent trajectory—progressing from diversified renewable experimentation through photovoltaic consolidation to material-driven optimisation centred on perovskite architectures and intelligent power management—reflects a technological reorientation that was already well underway before conventional publication-based sources could register its emergence, confirming that patent data afford a temporally proximate account of innovation dynamics. The assignee analysis further establishes that the competitive landscape is being reshaped not by the incremental advances of incumbent manufacturers but by the strategic repositioning of technology conglomerates and vertically integrated firms, a firm-level reconfiguration that aggregated macroeconomic modelling approaches are structurally precluded from detecting, given their reliance on economy-wide datasets that obscure the strategic behaviour of individual firms.
This study offers valuable insights for green energy practitioners engaged in R&D management, intellectual property (IP) management, and strategic business planning. Managers should shift from isolated component-level development toward system-level integration for R&D management. Innovation is increasingly concentrated on the central control architecture of energy systems, particularly intelligent inverters and advanced power electronics designed to optimise efficiency and enhance grid stability. The identification of a hierarchical technology stack further indicates the importance of coordinating innovation across vertically linked layers, from materials to deployment. From an IP management perspective, the results point to the need for sustained attention to how patent technologies evolve over time and to the firms that shape these developments in the green energy sector. Rather than focusing solely on patent counts or legal status indicators, IP analysis should examine changes in technological focus and competitive leadership. Patent ownership and portfolio orientation across related firms provide useful insights into strategic positioning along the technology stack. Additionally, as organisations increasingly enter green energy through mergers and acquisitions, shifts in patent ownership and corporate group structure often signal strategic realignment and emerging industry consolidation. Accounting for these dynamics allows IP management to better anticipate competitive risks and the technological control distribution. The clustering results suggest a restructuring of competitive leadership, with established manufacturers losing relative dominance and emerging actors strengthening their positions through digitally coordinated energy architectures. From a strategic perspective, stakeholders should shift their focus from standalone hardware to system intelligence, specifically within intelligent power management and smart grid integration. As value creation migrates toward integrated solutions, competitive advantage will increasingly depend on cross-disciplinary proficiency. Organisations capable of leveraging shared chemical and physical principles, such as those connecting biofuels and organic photovoltaics, will be better positioned to develop resilient and circular energy ecosystems.
The proposed MPISA framework integrates portfolio-level structural analysis with embedding-based semantic clustering to improve patent analytics. Rather than relying solely on IPC/CPC classifications, the framework incorporates textual representations of patent content to capture relationships that extend beyond hierarchical code structures. The resulting clusters reveal distinct yet interconnected innovation layers, that differentiate materials-level photovoltaic research, system-level power conversion and optimisation, and deployment-oriented infrastructure technologies. This layered configuration reflects increasing functional specialisation across the renewable energy value chain while highlighting the interdependencies among technological domains. MPISA provides a more nuanced mapping of innovation architecture than classification-based approaches alone by combining structural and semantic perspectives. Despite its comprehensive scope, this study has certain limitations. First, the dataset was restricted to patent publications in the United States, which may not fully capture global innovation dynamics within European or Asian jurisdictions. Second, the analysis focused on a predefined set of five principal green energy categories (solar, wind, hydro, geothermal, and biomass) based on specific USPTO classifications, potentially omitting niche or nascent sustainable technologies. Future research could address these gaps by incorporating multi-jurisdictional data and expanding the technological scope to include a broader array of climate change mitigation technologies.
The dataset of the study is available from the authors upon reasonable request.
Conceptualization, C-HH and Y-CC; methodology, C-HH; software, Y-CC; validation, C-HH and Y-CC; formal analysis, C-HH; data curation, Y-CC; writing—original draft preparation, Y-CC; writing—review and editing, C-HH; visualization, Y-CC; supervision, C-HH. All authors have read and agreed to the published version of the manuscript.
The authors declare that they have no conflicts of interest.
No funding for this paper.
1.
2.
3.
4.
5.
6.
7.
8.
9.
10.
11.
12.
13.
14.
15.
16.
17.
18.
19.
20.
21.
22.
23.
24.
25.
26.
27.
28.
29.
30.
31.
32.
33.
34.
35.
36.
37.
38.
39.

Copyright © Hapres Co., Ltd. Privacy Policy | Terms and Conditions


