Location: Home >> Detail
J Sustain Res. 2026;8(2):e260037. https://doi.org/10.20900/jsr20260037
 ,
Tankiso Moloi
,
Tankiso Moloi
Department of Accountancy, College of Business and Economics, University of Johannesburg, Auckland Park, P.O. Box 524, Johannesburg 2006, South Africa
* Correspondence: Busola Simon-Ilogho
Poverty remains a critical challenge in sub-Saharan Africa that continually demands innovative solutions. This paper examined the impact of financial and digital inclusion on the poverty rate in sub-Saharan Africa, covering data from the year 2000 to 2023. It combined financial inclusion variables (automated teller machine availability and mobile money) with digital-based inclusion variables (mobile subscription and internet accessibility) to assess their moderating impact on poverty rate. The Systems Generalised Method of Moments models were employed for analysis. Key findings from the study show that neither automated teller machine availability nor mobile money usage significantly reduce poverty rates. However, mobile subscriptions alone show a negative impact on poverty in all examinations. The findings also demonstrate that digital inclusion (via the internet and mobile access) does not moderate the relationship between financial inclusion and poverty alleviation. Policy makers, management, and stakeholders (that make key decisions) could consider investing in increasing mobile subscription (especially smart devices), as evidence shows that it is relevant in the increasingly digitalised society and it has contributed to reducing the rate of poverty.
Poverty is a generally undesired negative state of being associated with most marginalised communities in the global south [1]. Poverty has been linked to several societal problems over the years, such as high crime rates, illiteracy, inequality, poor access to basic health services, financial exclusion, malnutrition, low life expectancy, illegal activities, and corruption [2–4]. Therefore, the global fight against extreme poverty is not a new agenda.
The Millennium Development Goals targeted alleviating extreme poverty and hunger before 2015. This goal was not completely realised. Despite this unfulfilled agenda, the 2015 sustainable development goals (SDGs) reemphasised the ambitions to eliminate and eradicate poverty “in all forms and everywhere” [5–7]. Yet, SDG 1, targeting to end all forms of poverty globally, is amongst the SDGs that are not on track to be realised by 2030 [8,9]. This reality has been a major area of focus in the academia over the years, especially in recent years, with several studies seeking to examine determinants or factors that influence poverty eradication [10–13]. Several other studies have identified factors that could impact poverty alleviation, with examples including education [14], corporate social responsibility [15], agriculture [16], relocation [17], technology innovation, globalisation, and financial development [18].
States signatory to the SDGs agreed that the goal of ending poverty must be accomplished without neglecting the goals of reducing inequality and improving education and health [19]. One of the widely discussed topics that highlight inequality reduction is the subject of inclusion, especially digital and financial inclusion. Financial inclusion is essential to empowering cities and marginalised pockets of society, many of which are in the global south [1], especially in Africa.
In a digitised era, financial inclusion has been greatly influenced by innovative products in financial institutions [20], and increased digital inclusion across the globe. In recent times, the digitalised banking and financial services have been regarded as pivotal to fostering global economic inclusion, which is expected to impact poverty alleviation by 2030 [21]. Access to digital financial services and banking functions is a big part of why financial inclusion is an empowering tool for the economic transformation of marginalised communities, as individuals within these communities are exposed to services that can facilitate their emancipation from poverty. Hence, this study examined the impact of financial and digital inclusion on poverty rates in sub-Saharan Africa (SSA).
A few studies have examined the influence of financial inclusion (and digital financial inclusion) on poverty rate, but many of these have not considered the influence of digital inclusion as an enabler (or catalyst) of financial inclusion and economic empowerment. For studies, [22–25] all examined financial inclusion and poverty globally by investigating multiple countries (each over 100), but none of these studies examined the concept of digital inclusion as a separate interactor.
In addition, certain African-focused studies [26–34] have investigated financial inclusion and poverty mostly within sub-Saharan Africa with several methods. Furthermore, none of these studies examined the concept of digital inclusion as a variable or an interactor. Most of the studies, like [35,36], have investigated the impact of financial inclusion on poverty using proxies like savings, insurance, borrowing, credit, and automated teller machine (ATM) access. However, they have not separately interpreted the influence of the usage and accessibility dimensions and their interactions with digital inclusion proxies. Studies like [37] examined digital financial inclusion and poverty by using mobile penetration and the internet (digital inclusion proxies) as proxies for digital financial inclusion, but these proxies do not represent digital financial inclusion.
Therefore, this paper aimed at distinctly separating the influence of the usage and accessibility (availability) dimensions of financial inclusion on poverty and providing insights on the interactive influence of digital inclusion on poverty alleviation (economic empowerment) in sub-Saharan Africa. The study thus had following research objectives:
●
●
●
The next section of this paper displays stylised facts that highlight the reality of poverty and trends in mobile money, ATMs, internet access, and mobile subscription in sub-Saharan Africa. Afterwards, the review of empirical of literature, followed by practical link between variables and theoretical underpinnings, then the methods and results of the examinations are presented. The study concludes with the discussion of key findings and highlighting recommendations, policy implications, and limitations of the study.
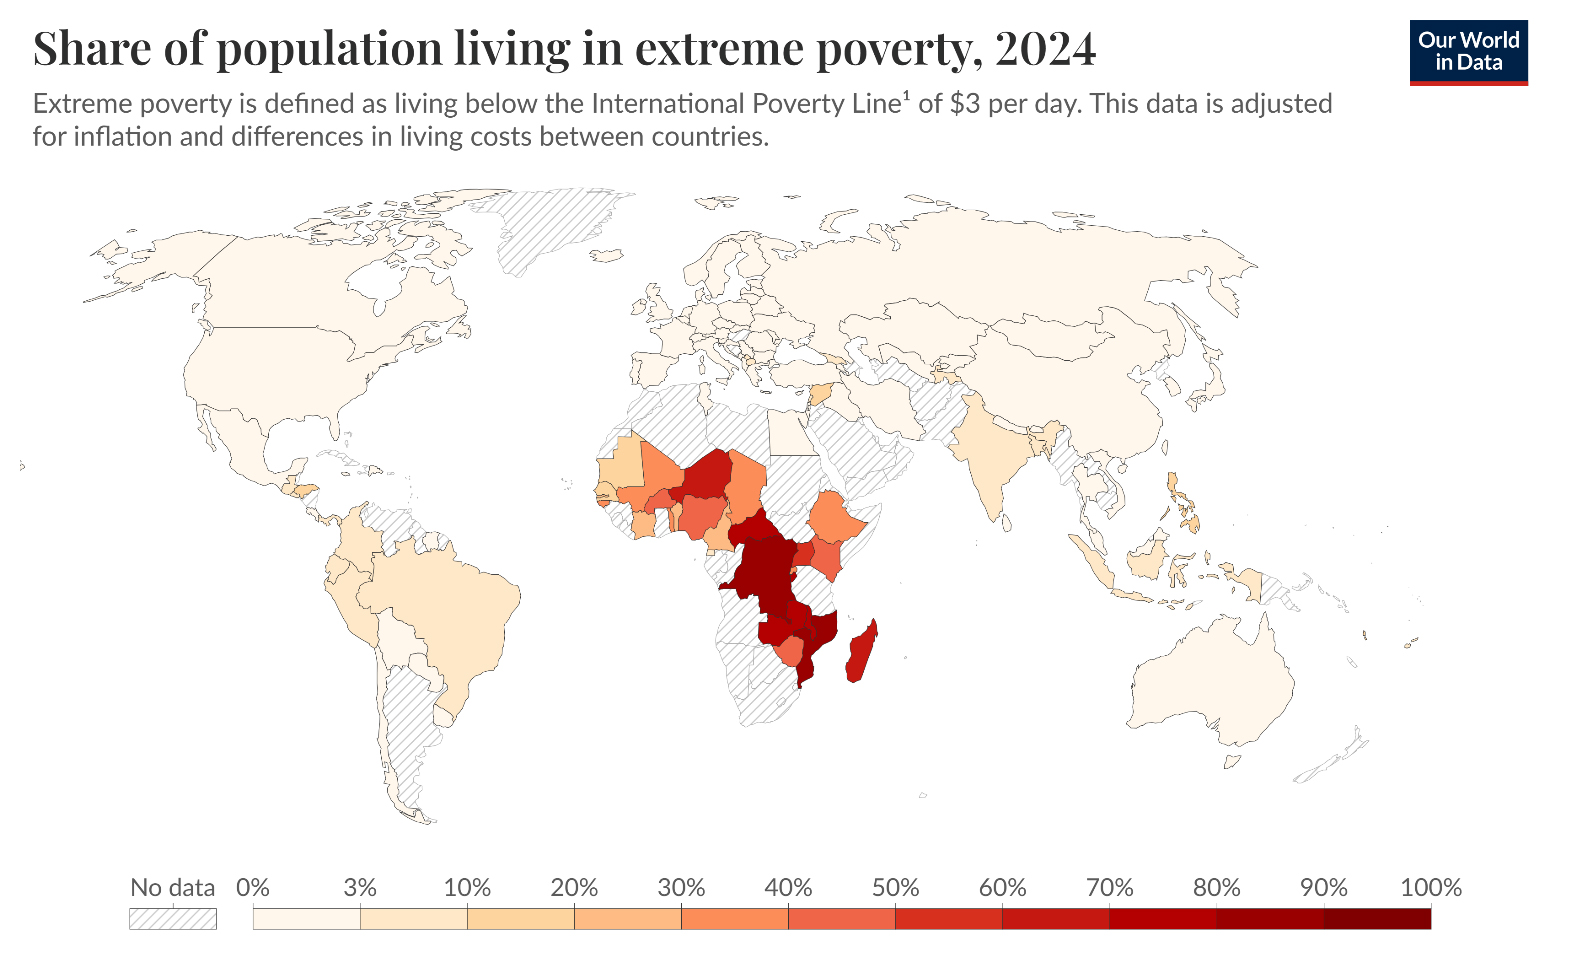
Stylised FactsPoverty remains a critical challenge in many parts of Africa. As of 2019, sub-Saharan Africa recorded the highest rate of extreme poverty (living on less than $2.15 per day), with 35.1% of its population falling under this category [38]. South Asia was the closest next, with a significantly lower value of 8.5% of its population (in poverty). Although statistics show that there has been a decline in extreme poverty in SSA since the 1990s, the pace of reduction has been slower compared to other regions [17], a figure significantly lower than that of SSA. In addition, out of the 20 countries with the most significant income inequality (globally), 12 are in Africa, highlighting the continent’s struggle with economic disparity. Furthermore, in 2022, approximately half of Africa’s rural population lived in extreme poverty, a stark contrast to the 10% in urban settings [39]. Alongside this pervasive poverty, malnutrition is widespread across Africa [40]. As reported in Figure 1 below, Nigeria and the Democratic Republic of Congo were home to 11.9% and 11.3% of the world’s population in extreme poverty in 2023 [40]. Other countries in SSA, such as Tanzania (4.3%), Mozambique (3.5%), South Africa (3%), Madagascar (2.8%), Uganda (2.7%, Angola2.6%, South Sudan2.1%, and Malawi 1.8%, reported better but relatively high poverty [40].
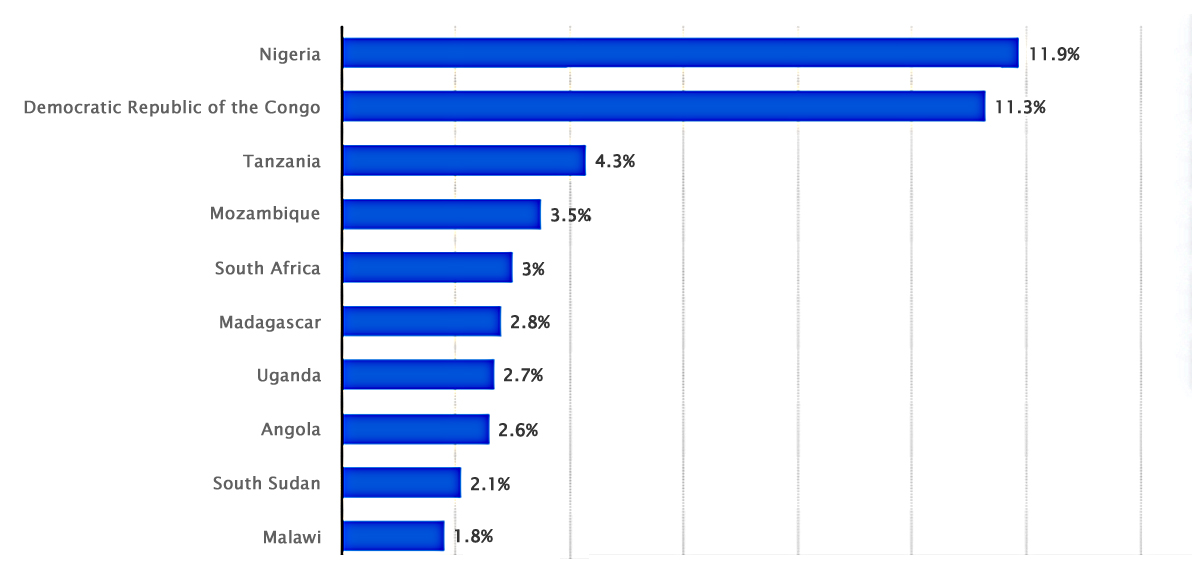 Figure 1. Ten African countries with the highest share of global population living below the extreme poverty line in 2023 [40].
Figure 2 shows the global population living in extreme poverty. It ranges from 0% to 100% as seen in the figure. It can be observed that a more significant percentage of extreme poverty is in the African region, with Botswana having 14.4%, South Africa 20.48%, Nigeria 30.86%, Niger 41.35%, Sierra Leone 42.99%, Liberia 44.43%, Angola, 49.9%, Zambia 58.75%, Mozambique 63.68%, and South Sudan 76.5% [41]. The poverty rate of other countries, as depicted in Figure 2, includes that of the United States at 1%, Canada at 0.25%, France at 0.02%, Spain at 0.79%, China at 0.09%, Australia at 0.5%, and Brazil at 4.86% [42]. These two groups of poverty rates (“Africa” and “other countries”) are at stark contrast, which justifies the focus of the present stud on examining sub-Saharan Africa.
The SDG 1, which anchors on “End poverty in all its forms everywhere”, is the first of the 17 objectives of the 2030 Agenda for Sustainable Development, which signifies its importance and the commitment to reducing global poverty. According to [44], the multifaceted character of poverty makes it necessary for SDG 1 objectives to take into consideration factors such as income, but also access to essential services, nutrition, healthcare, education, employment, technology, food security, sustainability, inclusive institutions, secure ownership rights, and susceptibility to catastrophes. These recognises the interdependent relationships between key factors and poverty as indicated by [45]. Some of these factors, like inequality (inclusion), go beyond mere financial measurements and are therefore essential complementary indicators that capture the human development, vulnerability, and rights [46]. One of the major mediums promoted to curb economic inequality is inclusive financing.
Inclusion has been a common agenda globally, and it is supported by the SDG goals 4 and 10 on “inclusive quality education” and the “reduction of inequalities”. One of the aspects of inclusion that relates to poverty alleviation is financial inclusion. The possibility of alleviating poverty through financial inclusion is because of inclusive financing aims at the penetration of marginalised, informal, and lower-class communities [47,48], while bringing access to essential financial services that could empower individuals within such communities, eventually leading to reduced social inequalities. This intervention can catalyse livelihood development, poverty reduction, and women’s empowerment, when there is improved access to credits, savings tools, and payment services catered to grassroots entrepreneurs and families. For instance, evidence from [44] showed evidence that microcredit disbursements from financial institutions can facilitate smallholder farmers’ investments in inputs and technology, increasing agricultural production, food security, and dietary variety within Nigeria. This sort of Agricultural-based economic empowerment will ripple into reduction cost of food and its availability, reducing cost of living and improving wellbeing (poverty alleviation). These are some of the benefits in financial and digital inclusion. The following set of figures showcases mobile phones and its corresponding effect on different groups. For instance, Figure 3 displays the rate of mobile phone subscriptions per 100 people from 2000 to 2024 in selected Sub-Saharan Africa countries [49]. Next was Figure 4 which shows the share of adults who uses a mobile phone in Sub-Saharan African countries [50]. Finally. Figure 5 shows active mobile money accounts globally 2010 to 2023 [51].
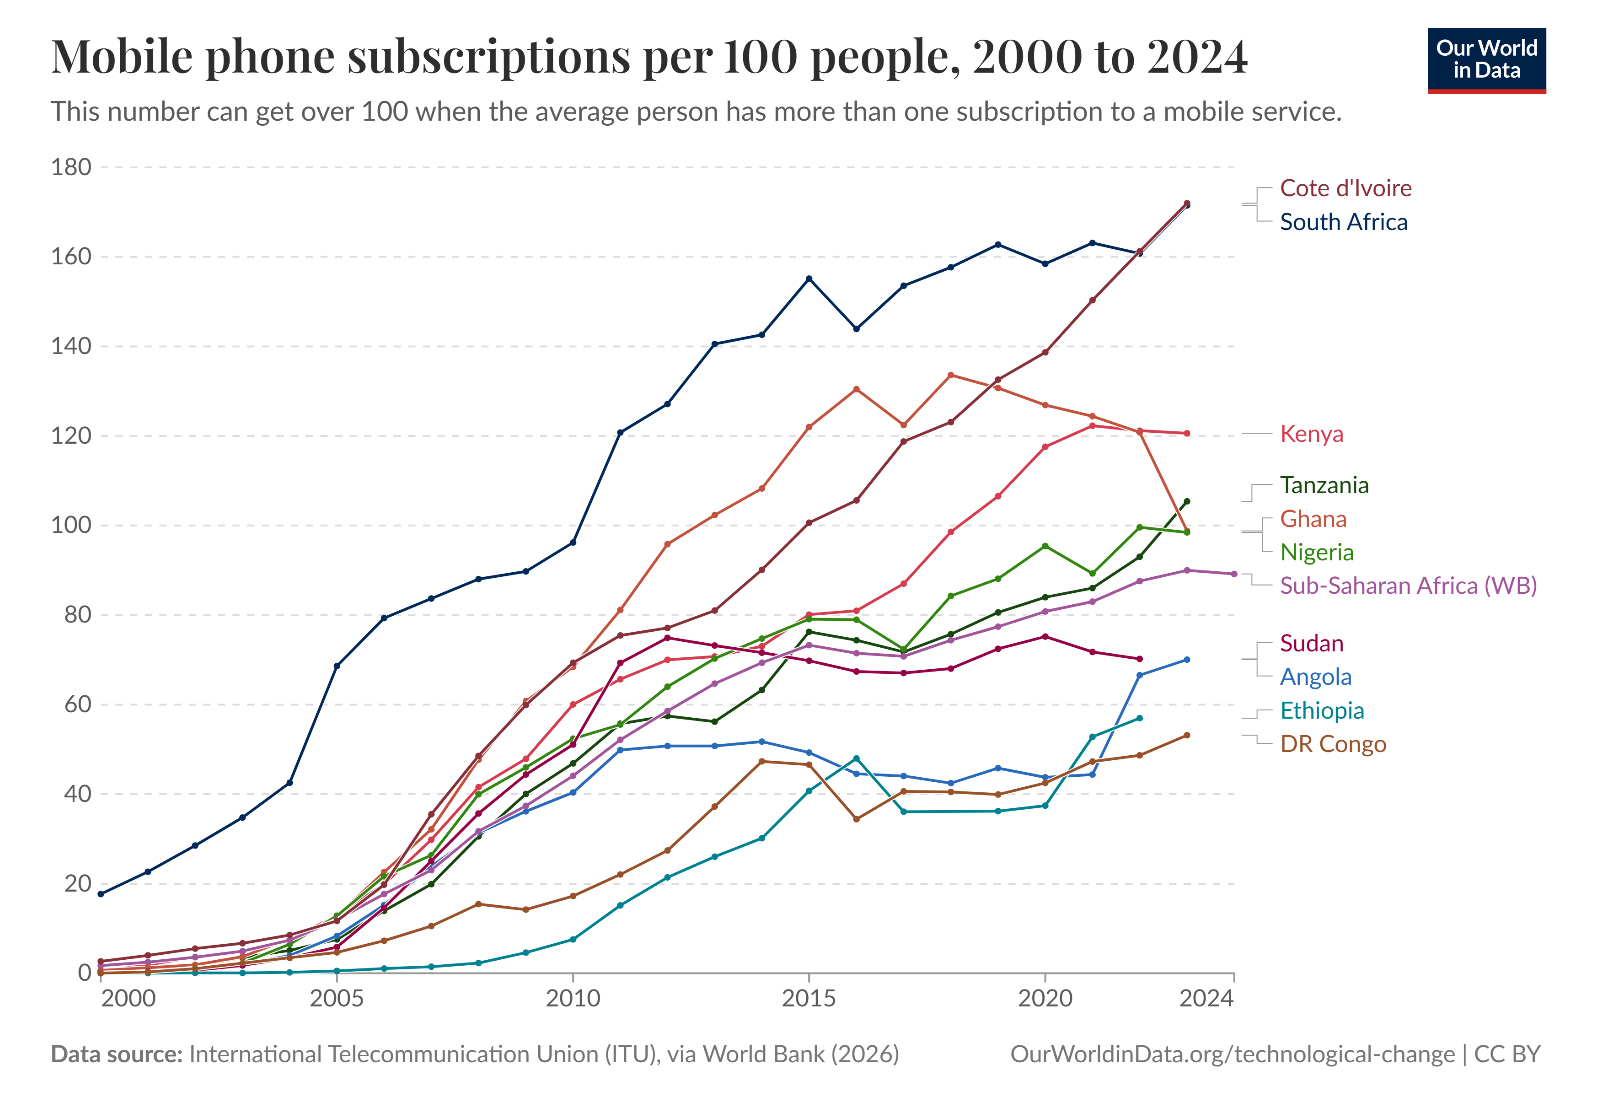 Figure 3. Mobile phone subscriptions per 100 people, 2000 to 2023 [49].
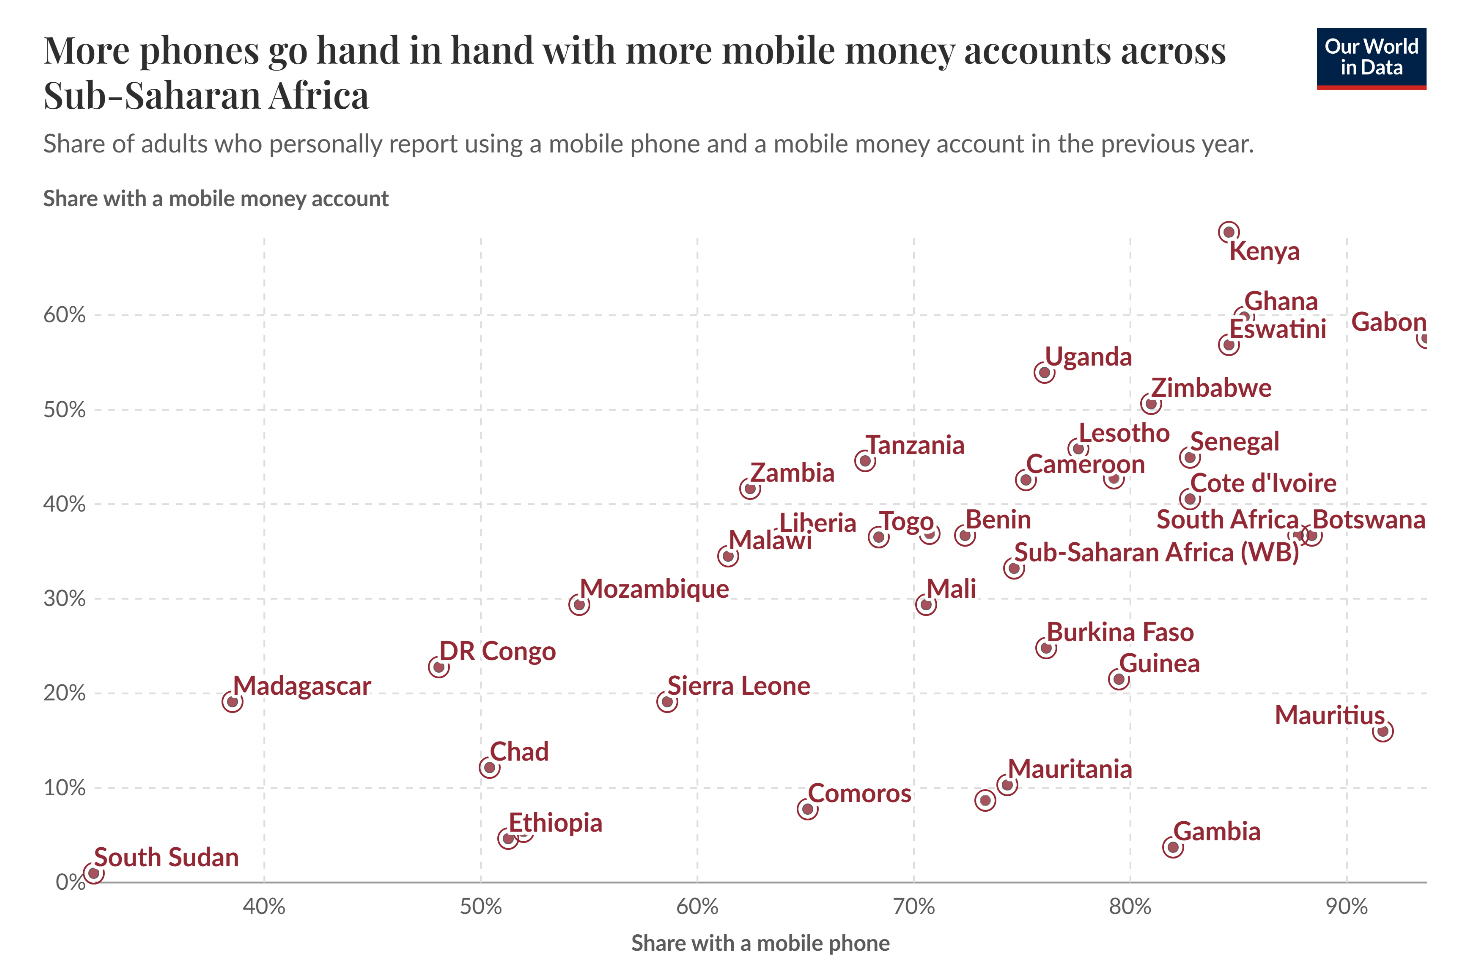 Figure 4. Mobile money accounts in sub-Saharan Africa [50].
 Figure 5. Active mobile money accounts globally 2010 to 2023 [51].
A couple of studies over the years and across the globe have examined financial inclusion and poverty, with most of the studies coming to similar inferences about the impact of financial inclusion on poverty reduction. For instance, Park and Mercado (2021) [23] covered 151 countries in examining the cross-country impact of financial inclusion on reducing poverty and inequality. Their study employed a cross-sectional research approach, and the results revealed that in high and middle-income economies, financial inclusion significantly influences poverty by increasing economic growth and reducing the poverty rate. However, their results do not indicate any significant effect on inequalities. Equally, Omar and Inaba (2020) [22] examined the influence of financial inclusion on poverty, covering 116 developing countries across the globe from 2004 to 2016. After employing unbalanced annual panel data, the study’s findings revealed that financial inclusion significantly alleviates poverty and inequalities in these countries. Both studies covered multiple countries but were not focused on sub-Saharan Africa.
Furthermore, Churchill and Marisetty (2020) [52] investigated the effect of financial inclusion on forty-five thousand households in India. This examination differs from the above studies because it focused on the financial inclusion of a single nation. Their study obtained household poverty probability index (PPI) data, revealing that financial inclusion reduces poverty. Their study recommends the promotion of financial inclusion across India.
Other studies that have examined the influence of financial inclusion on poverty across the globe include [24,25]. The effect of financial inclusion on diminishing poverty in the Southern Americas was examined by [24]. Their study investigated 13 South American nations using Limited Information Maximum Likelihood (LIML) and Feasible Generalised Least Squares (FGLS). The findings from the study revealed that financial inclusion is a powerful tool that can significantly tackle poverty and inequality. The study also highlighted the importance of fusing inclusion (mobile use) and technology, arguing that this can decrease poverty and inequity. The study by [24] targeted a specific non-African region in South America. The measurement of financial inclusion with mobile use is a limitation because mobile use only represents technology use or digital inclusion rather than financial inclusion. Hence, mobile money or mobile financial services would be the best measurement for financial inclusion.
Likewise [23], explored the influence of financial inclusion on alleviating poverty in 156 countries from 2004 to 2019 using static and dynamic panel estimation methods as a method of analysis. The study found that financial inclusion has a significant and positive influence on poverty alleviation in the low-income or developing countries examined, but not in the developed countries. This result implies that the higher the inclusion levels, the lower the poverty in developing economies, and that financial inclusion is not so significant in influencing poverty in developed economies because these economies are already advanced in technology and have higher inclusion.
These studies all show that financial inclusion can impact poverty through the examination of multiple nations across the globe. These reviewed studies clearly show that the studies examined outside of Africa had the same outcomes. Therefore, there is an expectation that financial inclusion will impact poverty negatively. However, after observing the common results among the prior reviewed studies outside of Africa, this research reviewed studies within the continent of Africa in the next paragraph.
Financial Inclusion and Poverty Reduction in AfricaAn example of an Africa-focused investigation is the work of [37], which assessed the impact of digital financial inclusion on poverty reduction and the informal sector in Africa with data spanning 22 years from 42 African nations. The author employed the Generalised Method of Moments (GMM) system, and the results show that mobile penetration and internet usage positively impact the development of the informal sector and poverty reduction [37]. This implies that digital financial inclusion helps reduce the poverty rate and underdevelopment. However, the measurement of digital financial inclusion was proxied with mobile penetration and internet usage, which are both ICT measurements. Similarly, Khan et al. (2022) [29] investigated the impact of financial inclusion on income inequality, economic stability, and poverty across 54 African countries. The study focused on data from between 2001 and 2019. Their work employed multiple regression on data collected, and the findings reveal that financial inclusion facilitates the reduction of poverty and income inequality and improves financial stability. In addition, Agyemang-Badu et al. (2018) [26] examined poverty, income inequality, and financial inclusion in Africa, covering 48 countries and employing fixed effect panel regression. Their study revealed that financial inclusion has an inverse effect on poverty rate and income inequality. This implies that financial inclusion reduces poverty rate and income inequality. Using varying methods of panel data analysis, the three studies above all reveal that financial inclusion helps reduce the poverty rate.
Also, Tweneboah and Nsiah (2024) [33] investigated financial stability, poverty reduction, and financial inclusion from 2004 to 2020 (17 years). Their study used the Autoregressive Distributed Lag (ARDL) for analysis. The results reveal that financial inclusion has a positive relationship with financial stability and household consumption expenditure in the long and short run. Their work also demonstrates that financial inclusion impacts poverty reduction and confirms that financial stability moderates the impact of financial inclusion on poverty in Africa.
Furthermore, Yiadom et al. (2021) [34] examined the effect of financial inclusion on poverty and growth in Africa by analysing the influence of institutions. Their study covered eight years of examination from 2011 to 2018, covering 42 nations. They employed dynamic panel regression, and their results show that strong institutions in the examined nations facilitate the reduction of the poverty rate via the financial inclusion. The consideration of moderating or interacting factors like financial stability and institutional strength, as done in [33,34], reveals the influence of other factors that could be captured as controls.
Some other financial inclusion and poverty alleviation studies examining African nations but focusing on the sub-Saharan region mainly provided similar results. For, Mohammed et al. (2017) [31] examined poverty reduction and financial inclusion in thirty-five sub-Saharan African nations and focused on whether financial inclusion could improve welfare benefits using the propensity score matching technique and the treatment effect model. Their results show that the financially included poor have better wealth and welfare benefits. This testifies to the positive impact of financial inclusion on poverty reduction and on the poverty rate.
In addition, Ibrahim et al. (2019) [35] examined financial inclusion and its impact on poverty reduction in sub-Saharan Africa, covering thirty-eight years (1980–2017). Their study employed the static panel data model, and their findings revealed that certain financial inclusion services, such as savings, credits to the private sector, information technology, and ATM access, and other factors like government expenditure and inflation, positively impact poverty reduction. Equally, Nsiah et al. (2021) [32] investigated the impact of financial inclusion on poverty reduction in the sub-Saharan region from 2010 to 2017 using the Differenced generalised method of moments (GMM) and Hansen’s Estimation. The results show that financial inclusion impacts poverty by reducing the poverty rate. Their results indicated that financial inclusion reduces poverty beyond the threshold of 0.365.
Some West Africa-based studies also produced findings that perfectly agree with the findings highlighted above. For instance, Asare and Hongli (2020) [27] assessed poverty alleviation and financial inclusion in West Africa, covering 12 years (2004 to 2015) using dynamic panel data methods for analysis. Their results show that financial inclusion positively impacts poverty alleviation. They used number of loans, ATMs, and commercial banks available per person as representation for financial inclusion. Their findings also imply that financial inclusion negatively impacts the poverty rate.
Similarly, Koomson et al. (2020) [30] examined the impact of financial inclusion on poverty and vulnerability, but they covered a single West African nation, namely Ghana. They used the survey method on data from between 2016 and 2017. The investigation used the three-stage feasible least squares for analysis, and the results show that increased financial inclusion reduces the household’s likelihood of poverty and sets future possibilities by preventing future vulnerabilities. Hussaini and Chibuzo (2018) also investigated the impact of financial inclusion on poverty alleviation by covering only Nigeria. The study employed a random sampling technique to select respondents for the survey. Three hundred and eighty-four customers were questioned, and the data were analysed using partial least square (PLS) and Structural Equation Modelling (SEM). The results show that financial inclusion reduces poverty.
Other studies that examined single African nations are the works of [28,36]. Mhlanga et al. (2021) [36] examined the impact of financial inclusion on poverty alleviation among farmers in Zimbabwe using a simple regression method. The findings from their work revealed that financial inclusion impacts poverty reduction amongst farmers in Zimbabwe, and they recommend promoting inclusion amongst farmers via saving, insurance, and borrowing transactions. Mahalika et al. (2023) [28] assessed the relationship between poverty and financial inclusion in South Africa, covering seven years (2011–2016). Their study employed the quantile regression method, revealing that individuals from lower financial inclusion quantiles have a greater likelihood of poverty. This implies that financial inclusion impacts the poverty rate negatively.
With all twenty empirical studies examined from across the globe, it is glaring that they have a common outcome that indicates that financial inclusion plays a decisive role in contributing to the decline of poverty, especially in developing nations. After the summarised Table 1 below, the paper provides a sub section that explains the practical influence of digital inclusion and financial inclusion on poverty alleviation (economic empowerment). After that, it provides theories that serve as fundamental frameworks for this relationship.
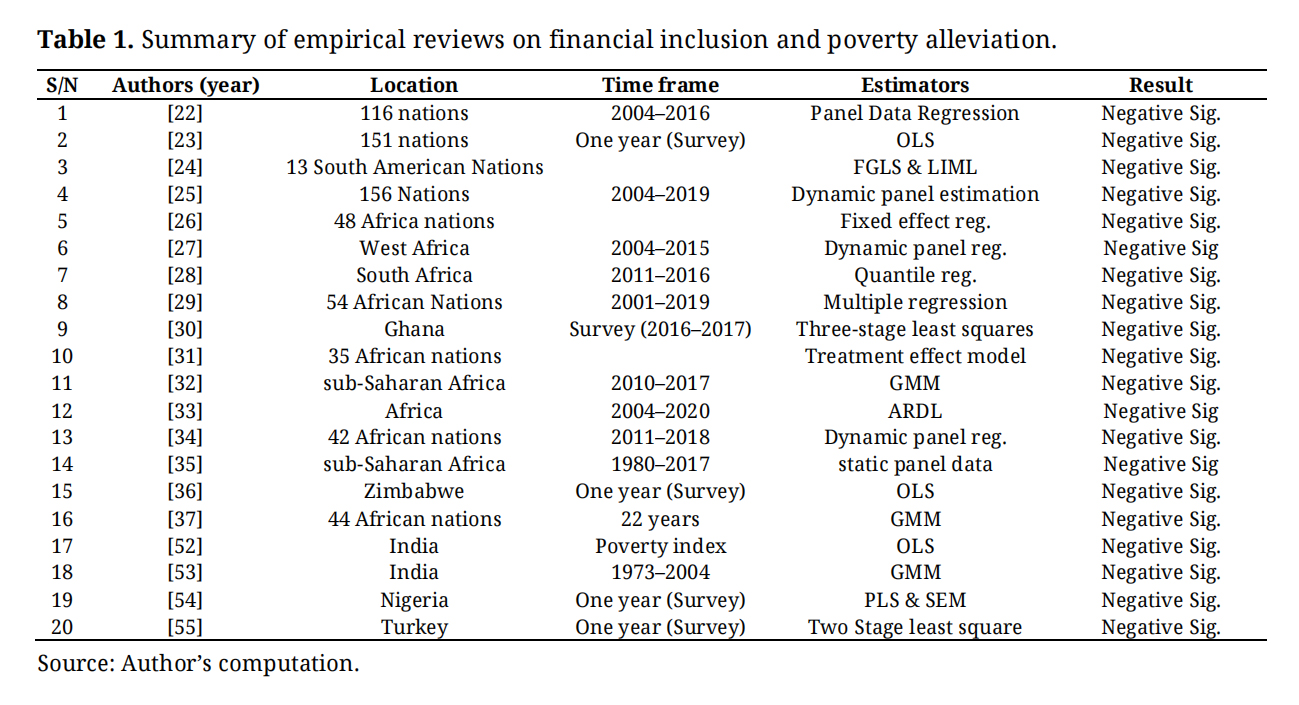 Table 1. Summary of empirical reviews on financial inclusion and poverty alleviation.
Financial inclusion has emerged as a key socio-economic strategy and has been embedded in modern social policy agenda over the past 20 years [49,56,57]. Financial inclusion is the access to financial systems and services by both the mainstream and underground parts of any given population, which widens the participation in economic and commercial activities. The opposite of this is what can be called financial exclusion, and this is what has been rampant in minority communities [58]. However, with the increased use of digitalised means of livelihood like the mobile phones (text messaging), digital devices (security tokens), and smart phones (bank applications), financial services have been advanced into services that can be rendered at the comfort of one’s house.
Despite extensive research, studies [22,26,31,33,34,37] have examined financial inclusion by using a variety of proxies that are banking-related such as ATMs, mobile money, personal remittances paid/received, savings, and credit availability, limiting their scope to the effects of financial inclusion. Therefore, they have not considered the moderating effect of ICT/Digital-based inclusion, such as internet access and mobile phone subscriptions. These interacting effects are expected to shed more light on the impact of digital financial inclusion on poverty alleviation. The studies have not comprehensively examined how digital inclusion (internet access and mobile subscriptions) moderates the impact of financial inclusion proxies (ATM access and mobile money) on poverty alleviation in sub-Saharan Africa.
In this study, the financial inclusion proxies measure two different dimensions of financial inclusion in usage (mobile money usage/subscription) and accessibility dimensions (ATMs available per 1000 adults). These gaps are very critical because of the rapid digitisation of financial services and the unique socio-economic context in sub-Saharan Africa. Hence, the research hypotheses of this work were framed in the null form as follows:
H1: ATM availability does not influence poverty alleviation in sub-Saharan Africa.
H2: Mobile money usage does not influence poverty alleviation in sub-Saharan Africa.
Then, the interacting effect of digital inclusion is captured in hypotheses three.
H3: Digital inclusion does not moderate the impact of financial inclusion on poverty alleviation in sub-Saharan Africa.
The first hypothesis tested for the influence of the accessibility dimension of financial inclusion on poverty. This examined the impact that access to financial inclusion facilities like (ATMs) can have on poverty. The second hypothesis examines the usage dimensions of financial inclusion to establish if the emergence and usage of mobile money (in particular) has influenced poverty. The third hypothesis explains the influence of digital inclusion on the relationship between financial inclusion and poverty. The influence of the proxies of ATMs and mobile banking in H1 and H2 with poverty has been explained and established existing literature. The relationship captured in H3 can be depicted using the conceptual models explained in Figure 6 below.
The first model (Figure 6a) shows the listed proxies that are moderated to impact poverty as a dependent variable. These proxies are represented by abbreviations (in a bracket) that is used in the next model (Figure 6b).
This model captures four moderation combinations of the proxies for financial inclusion and digital inclusion. These combinations represent realistic possibilities of how these two inclusion variables can be combined. For instance, the combination Mobile Money (MM) and Internet (I) explain the combined use of mobile money and the internet for financial or digital purposes. The combination of these two would provide avenues for mobile money transactions (e-wallet), use of bank applications, websites, and other internet-related transactions as well as economic empowering digital activities within the scope of the internet. Another example is the MM*MS combination which captures facilities like the USSD, transaction text alerts services, customer care hotline use, and other mobile-related digital and banking activities common only to mobile phones.
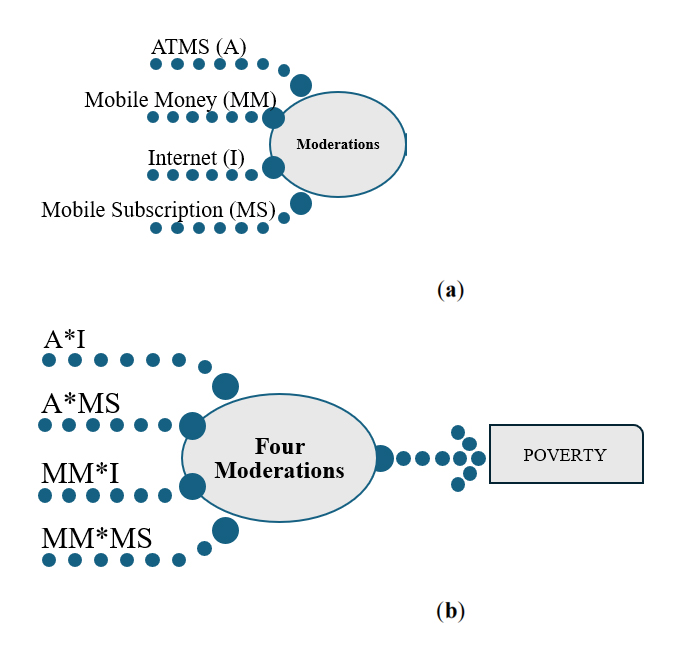 Figure 6. (a) Conceptual Model depicting the proxies of financial inclusion (top two) and the digital inclusion (bottom two). (b) Conceptual Model depicting four moderation combinations of financial and digital inclusion on poverty.
Economic empowerment in the digitalised world increasingly occurs in virtual spaces, enabling individuals to earn income outside traditional office environments through internet-enabled technologies [59]. Digitalisation has expanded economic participation by facilitating online jobs, digital payment systems, and freelancing opportunities, thus reshaping labour markets and reducing geographical constraints to employment [59]. In parallel, social media platforms have emerged as important economic tools, supporting online entrepreneurship, social media marketing, and income-generating activities for individuals and small businesses [60].
Access to internet-enabled smartphones, combined with relevant digital skills, is particularly empowering for individuals in marginalised communities, as digital literacy significantly improves participation, resilience, and income outcomes in online labour markets [61,62]. Platforms such as YouTube, TikTok, X (formerly Twitter), and Instagram have created new income-earning opportunities for content creators and micro-entrepreneurs, who are commonly integrated into digital payment systems and virtual bank accounts to receive earnings [60]. This interaction between digital inclusion and financial inclusion represents a contemporary pathway through which digital technologies enhance economic empowerment and financial autonomy, especially in developing-country contexts [61].
Besides direct economic empowerment, [60] (an African-based study) notes that platforms like YouTube, Facebook, and LinkedIn have served as feeds and direct access to education and knowledge. These platforms have mediums for skill development and education (including AI education and the trend of content creation), which further empowers youths economically. All these are facilitated by the access to internet and smart mobile devices (digital inclusion).
Theoretical ReviewThis study was anchored in a set of well-established economic and behavioural theories, complemented by broader development policy frameworks, to explain the interaction between financial inclusion, digital inclusion, and poverty alleviation. Transaction cost theory, the capability approach, human capital theory, and the technology acceptance model provided the core theoretical foundations by explaining how access, capabilities, skills, and technology adoption shape economic participation. These perspectives were further enriched by insights from financial innovation and digital divide scholarship, which highlight the role of digitally enabled financial services in reducing costs, expanding access, and mitigating inequality. In addition, the Sustainable Development Goals framework was used to situate these theoretical arguments within a wider development policy context, particularly with respect to inclusive growth, technological progress, and poverty reduction.
The information and transaction cost theory, originally by [63] and modified by [64] rests on the core idea that the high cost of transaction and information limits market participation. This assumption is relevant when digital means (mobile phones, internet, and other digital platforms) have contributed to cost reduction of access to financial services, thus making financial inclusion scalable through digital channels and empowering communities (poverty alleviation). Furthermore, the idea that development depends on expansion of individual capabilities and freedom was captured by the capability approach theory by [65]. This theory’s relevance to this paper is hinged on the capacity expansion capabilities of digital inclusion (information, education, and market access) and financial inclusion (savings, investment, and risk management services). The capabilities and freedom provided by these also empower individuals economically (poverty alleviation). Another relevant theory is the financial innovation theory [66], which explains the influence of financial innovations in providing access and performance (cost) efficiency. Several financial innovations nowadays are supported by digitalisation and powered through digital inclusion (mobile money, digital credit, virtual cards, e-insurance, and bank and fintech mobile applications), leading to empowerment. This theory could also link with technology acceptance model theory, where digital technologies enhance financial inclusion acceptance.
However, the most relevant theories are the Digital Divide Theory [67], the Sustainable Development framework [68], and the Human Capital Theory [69]. The Digital Divide Theory explicitly captures inequality that stems from unequal access to digital technologies, indicating that financial inclusion without digital inclusion will reinforce inequality, but when combined they have the potential to reduce inequality, extending to poverty alleviation. Practical examples of this (explained above) potential/possibility can be seen in the social media world, with the of wealthy social media content creators (of various economic background) that depended solely on digital platforms (social media) for earnings. The Sustainable Development framework supports poverty reduction through the integration of economic, social, and technology-driven strategies, two of which are financial inclusion (SDG 1 & 8) and Digital inclusion (SDG 9). Lastly, the Human Capital Theory emphasises on investments in knowledge and skill to increase productivity and earnings, which is facilitated by digital inclusion (digital literacy and access to online education) and financial inclusion (that facilitates investment in education and skill). All these theories provide links between financial inclusion, digital inclusion, and poverty alleviation, further strengthening the relationships.
This study examined the top ten sub-Saharan African economies. This ranking category is based on the last Gross Domestic Product value in 2023. Following the work of [70,71] on financial inclusion and poverty alleviation, the study examined 10 SSA nations. The study selected the top ten highest-ranking SSA countries based on GDP. The selection was also influenced by the following:
I. Economic representativeness and structural influence:
The top ten economies represent a strong portion of the total economic output of the entire sub-Saharan African community. In addition, these economies have a strong influence on the regional financial markets, economic trends, and technology diffusion. Besides this, they are systemically better positioned economies whose financial and digital sectors would easily adopt and facilitate more inclusion dynamics [72] at a scale larger than the economies with lower economic output if they were to implement findings.
II. The top ten selected countries have a more complete and consistently available multiple-layer data necessary for this robust econometric analysis.
III. These economies have also proven leadership in early digital financial inclusion adoption over the years with Kenya spearheading mobile money leadership, South Africa leading in formal digital banking, and Nigeria emerging as a leader in digital payments and fintech regulations.
Moreover, the ten selected nations represent each economic region within SSA. For instance, South Africa, DRC, Angola, and Tanzania fall under the Southern African Development Community (SADC); Angola and DRC fall under the Economic Community of Central African States (ECCAS), while Ethiopia, Sudan, Kenya, and Tanzania fall under the East African Community (EAC), and Nigeria, Ghana, and Cote d’Ivoire are part of Economic Community of West African State (ECOWAS). However, Mali, Burkina Faso and Niger are no longer part of ECOWAS, as they have moved into the newly created Alliance of Sahel States.
Secondary data on poverty rate, financial inclusion availability (ATM and mobile money subscription), unemployment rate, GDP growth, labour force participation, GDP inflation, population growth, and internet access in these countries were collected from credible sources (the database of World Bank, the global economy, and Our World in Data). The study’s representations of financial inclusion are all direct financial inclusion proxies in ATMs and mobile money services. Automated teller machines (ATMs) are mostly used by banking institutions, while mobile money service is essentially a financial technology used by both traditional, neo banks, and FinTech firms. Unemployment, labour force participation, and gross domestic product growth were captured as control variables because they reflect and sometimes influence (in case of unemployment) the poverty rate within an economy.
The 10 African countries selected based on their GDP value (as at the year-end 2023) according to World Bank are listed in Table 2.
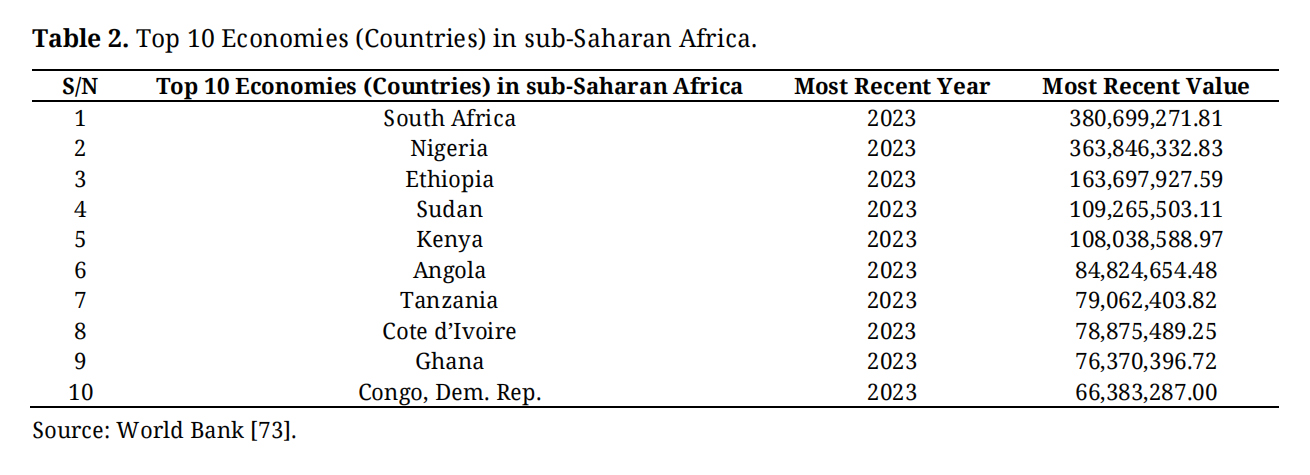 Table 2. Top 10 Economies (Countries) in sub-Saharan Africa.
The data analysis method employed in this study is the random effect panel using Estimated Generalised Least Square (EGLS) regression and the generalised method of moments. This is because the former helps as controls for unobserved country-specific heterogeneity, while the latter addresses dynamic panel bias. Both are also great methods for longitudinal poverty studies with a lag applied to the dependent variable. The applied lag helps to express the influence of dependent variables from the preceding year (yr1) on the current year. For example, the impact of dependent variables from the year 2000 was revealed in the year 2001, which is captured in the model.
Measurement of variablesThe financial inclusion proxies used in this study cover the usage and accessibility dimensions of financial inclusion stated by the world bank (World Bank, 2023) but do not capture the quality dimensions, which is best measured via survey (to harvest the quality of experiences from users). Since this study did not use a mixed methods approach or the survey research design, it was limited to secondary data collection, which is appropriate for the usage and accessibility measure of financial inclusion and has been used by prior research in the last six years [22,25,28-29,33–35],
The choice of proxies (ATMs availability) for accessibility measure (mobile money) and usage measure is because they may point more to digitalisation than (for instance) commercial bank accessibility (accessibility measure), and savings, personal remittance, or active accounts (usage measure). Mobile money and ATMS are inclusion infrastructures that became more popular in sub-Saharan Africa in the early 21st century, though they are not considered new innovations nowadays. However, proxies like commercial bank accessibility, savings, personal remittance, or active accounts have always existed in different forms for more than two decades; hence, they may be more traditional. Table 3 show the breakdown of variables used in the study and their sources.
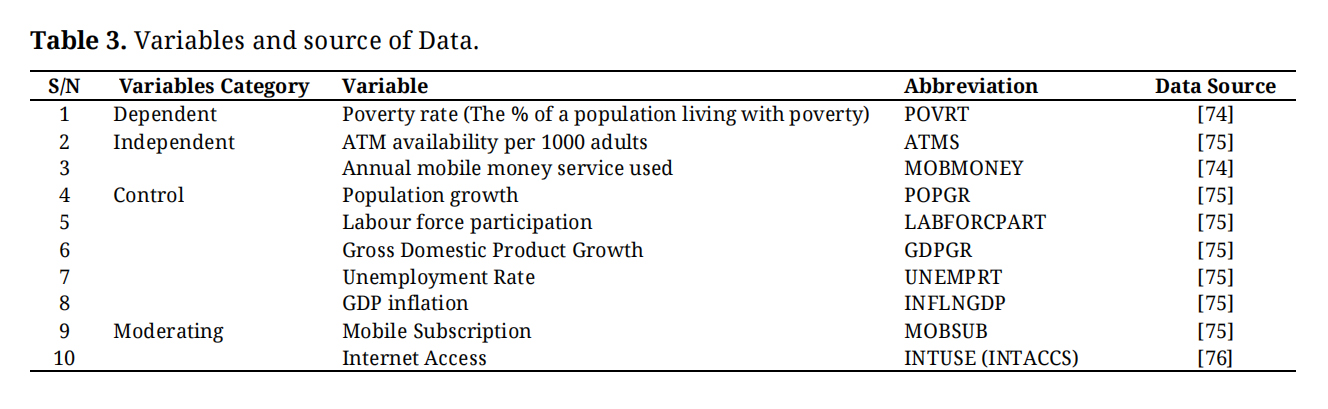 Table 3. Variables and source of Data.
The independent variables are ATMs and Mobile money, representing ATM availability and mobile money service respectively. The data on mobile money usage/subscription were used to define mobile money service, and data on ATM accessibility per 100,000 adults were used to represent ATM availability. The control variable was used based on reasons discussed below.
Generally, poverty in a nation can be determined by the low income of individuals. Hence, it is determined by individual business revenue in the case of entrepreneurs or low wages or remuneration in the case of the employed [76]. That a nation’s salary scale or minimum wage is poor and cannot command value to meet a minimum global average standard of living is a reflection of poverty [77,78]. This also means that when the level of unemployment is high, then there would be high prevalence of poverty within that community [79,80]. Studies like [77,78] have revealed the impact of the increase in minimum wage on workers in a country and how that can help reduce poverty and inequities. Still, if the level of unemployment within that region is out of proportion, the increase in wages will have very little to no effect on poverty reduction. Therefore, studies like [81,82] suggest a nexus between unemployment and poverty, presenting the need to control unemployment in the examined nations.
In addition to unemployment, economic elements like inflation could affect the purchasing power or value of wages paid to employees. This point, therefore, means that even when wages are increased, it could systematically spur up market prices since production and service companies would need to increase the overall payroll amount, influencing the overall cost of production and prices of goods and services. This chain of events could raise prices and lower citizens’ purchasing power. The works of [83,84] have examined this effect and opined that inflation contributes to poverty in a nation. Therefore, inflation must also be controlled for in this examination.
The population growth in a nation could be influential when generating statistics on poverty rate. The number of individuals living in a country within a period must be considered when determining the poverty rate. Therefore, when this population increases or reduces, either because of immigration, emigration, urbanisation, or birth or death, there will be changes regarding the number of poor people available and the total population when calculating the poverty rate. This is why population growth over periods would need to be considered when determining the poverty rate, hence the need to control population growth within the examined countries and, thus, the adjusted inflation by GDP.
The factor of GDP is paramount to gaining insights into the poverty rate, as the GDP is usually a proxy or reflection of the economic performance of that nation. According to the World Bank and the IMF, the GDP per capita reveals the average productivity per individual (in population) in monetary terms [85]. Hence, GDP can also reflect the standard of living within a nation, which should be controlled when examining the poverty rate.
In addition, there should also be control for gross domestic savings because the level of savings within a nation can also reflect the consumption habits of a nation and explain the reason for poverty by reflecting the consumption tendencies of a nation collectively. Gross domestic savings influence the economic development of a nation and poverty reduction according to a United Nations University World Institute for Development Economic Research (UNUWIDER) article in 2023 titled “The domestic savings shortfall in developing countries – what can be done about it?”. However, Gross Domestic Savings was not controlled for because of missing data for some countries and for the sake of data consistency and a tangible number of observations from ten nations. Furthermore, labour force totals and participation must be considered control variables because they impact both independent and dependent variables. The number of people in a labour force market from a given national population will simultaneously determine the potential for employment and unemployment rates. In addition to this, it will determine the number of individuals in the formal registered sector because formal employment is expected to be documented and can influence the use of banks and access to other financial services such as insurance, given that most employees have access to the bank, accounting for the receipt of wages or salaries. These factors impact financial inclusion levels and are controlled for.
Model SpecificationSome of the previous financial inclusion and poverty studies like [47] have employed linear models. This study [47] model by incorporating its variables (POVRT, ATMS, POPGR, INTUSE, GDPGR, INFLNGDP, UNEMPRT, LABFRCPAT, MOBSUB) without log as stated:
To capture the effect of the previous year on the current year, a lag is applied on the dependent variable because the impact of the independent influences future results of the dependent variable.
While the dependent and independent variables are expressed in a simple linear expression y= f(x1, x2), the control variables such as GDP growth rate (GDPGR), Mobile subscription (MOBSUB), Internet access (INTUSE), Unemployment rate (UNEMPRT), GDP adjusted Inflation rate (INFLRTGDP), population growth (POPGR), and participation (LABFRCEPAT) are added to complete the expression y = f(x1, x2, z1, z2…) in model one. Automated teller machines represent financial inclusion in this model based on hypothesis one.
Model two reveals another proxy representation for financial inclusion in the form of mobile money service availability with a lagged dependent variable expressed thus:
The two models revealed the distinct effects of two financial inclusion proxies in answering the same question. However, the third model reveals a moderating effect of digital inclusion variables like internet access and mobile phone subscription. It excludes control variables to focus on the moderating impacts, and it includes the essential dependent variable proxies thus:
The descriptive data reveal the statistical distribution of data collected across the 10 nations. Notable descriptives from the table above reveal the mean of all variables. The GDP growth, on average (mean), is relatively low (5.15%) per year compared to population growth (2.59%). The digital inclusion proxy data (internet access) reveal that at a maximum (16.15) internet access is reasonably average, while at a minimum (0.015), there is little to no access to the internet for digitalised activities. With a standard deviation of 19.28, there is clear separation between those who have access to the internet and those who do not, which signals the presence of inequalities. An even worse standard deviation (46.67) is seen with MOBSUB (mobile subscription), signalling that while there is good access to mobile phones as revealed in the high subscription numbers (174.02) per 100 persons, there are also people who do not have access to one mobile device (0.039 per 100 persons).
The mean Mobile money usage and ATM availability in Table 4 reveal 29% (approximate usage) by population and 10 ATMs approximately available per 100,000 adults, respectively. The average mobile money usage is solid given that the average mobile subscription is 60.9% of the population. However, the number of ATMs available (10.41) per 100,000 adults is too low and depicts the small number of available ATMs compared to the population in these countries. This minimum number (0.02) of ATMs per 100,000 is as good as zero (0) ATMs available per 100,000.
In addition, based on the statistics, the average percentage of people living in poverty from this group of nations is an alarming 42.8% (Table 4), which is a balance (of their regional digitalisation leadership capabilities, yet poverty challenge) and an acceptable reason for selection.
The descriptive statistics reveal that the average percentage of people living in poverty in the top ten sub-Saharan African region is alarming to the tune of 42.7% as of 2023, which is a great chunk of the percentage of people living in poverty (8.7%) globally as of 2022 [41]. The maximum percentage is 56% and the minimum percentage is 36.7%, which are not so far apart. The minimum and maximum percentages indicate that even the most productive nations in sub-Saharan Africa (based on GDP) are still experiencing huge levels of poverty, especially in marginalised communities characterised by no livelihood and poor access to health services, financial services and basic amenities. Despite these poverty percentages, the GDP growth shows a good average percentage of 5%, with a maximum of 15%. The minimum GDP growth of −5.963 also shows declines and reflects struggles in one of the ten sub-Saharan nations over the examined period.
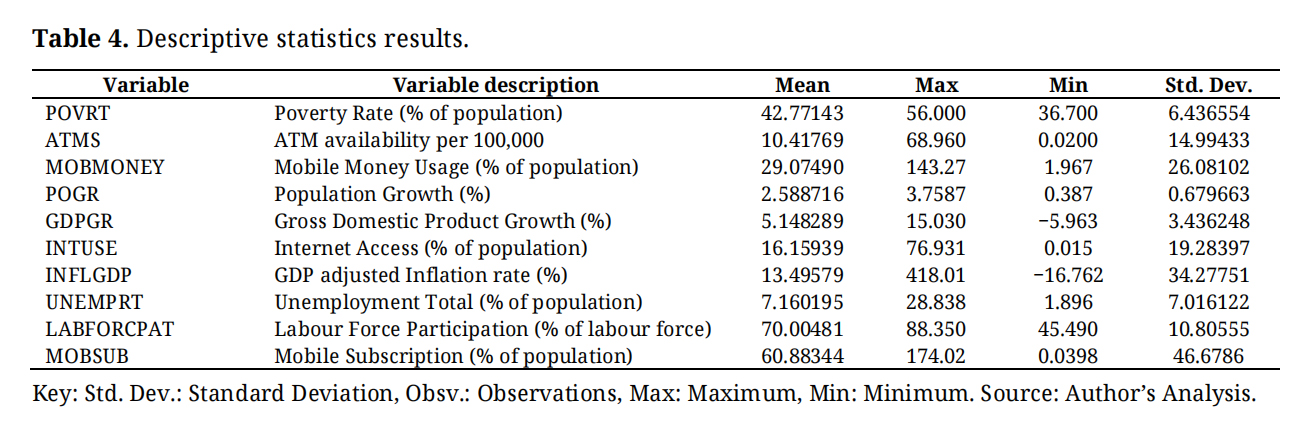 Table 4. Descriptive statistics results.
The panel unit root test was done before the econometrics regression analysis. This test helps to reveal the presence of a unit root within the database used and to determine if it is stationary. The hypothesis that indicates “the presence of a unit root” was tested. The results in the Table 5 below show that there is stationarity (below 0.05) at level with MOBMONEY, GDPGR, INFLNGDP and POVRT across all the methods. However, the rest of the variables were only stationary at first difference and were, therefore, would be analysed at first difference (Δ).
The Kao Residual Co-integration was a supplementary co-integration test used in the study to confirm the co-integration state of the data used. The Kao Residual Co-integration in Table 6 leads us to reject the null hypothesis, which states that there is “No co-integration” because the results from the probability score (Augmented Dickey-Fuller Test) reveal a significant score of 0.00 below 0.05. Therefore, there is a long-run relationship between variables across different units in the panel. This long-run relationship improves statistical outcomes, and it indicates that even if there is any deviation in time, in the long run, variables will co-integrate.
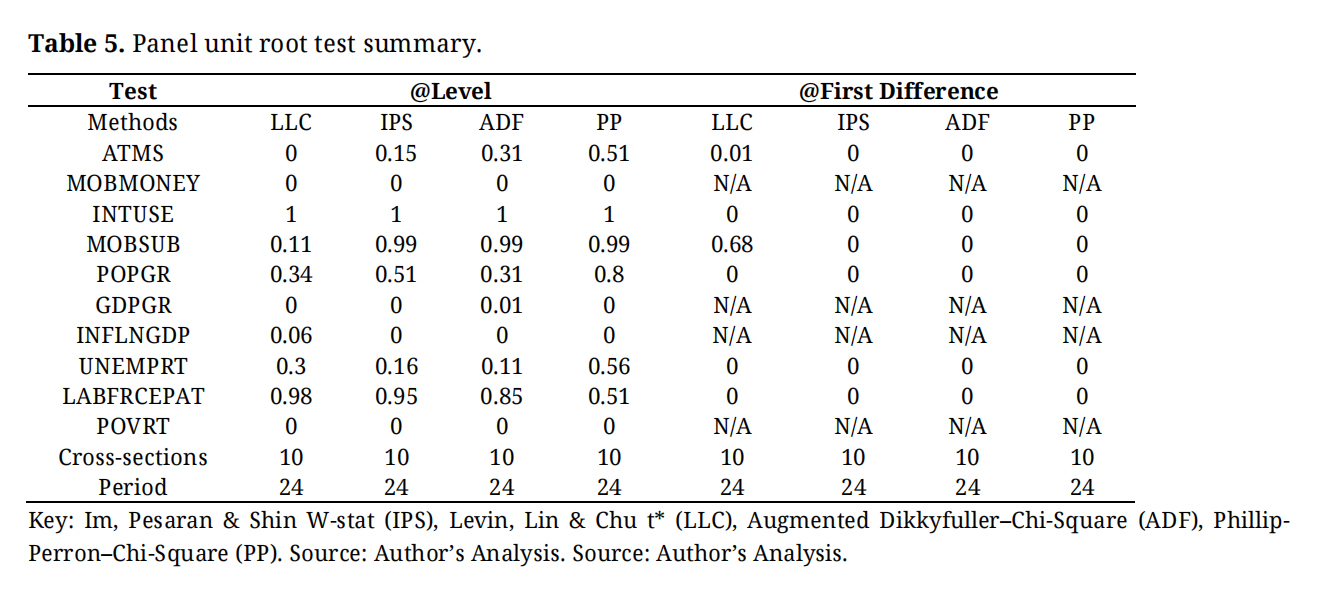 Table 5. Panel unit root test summary.
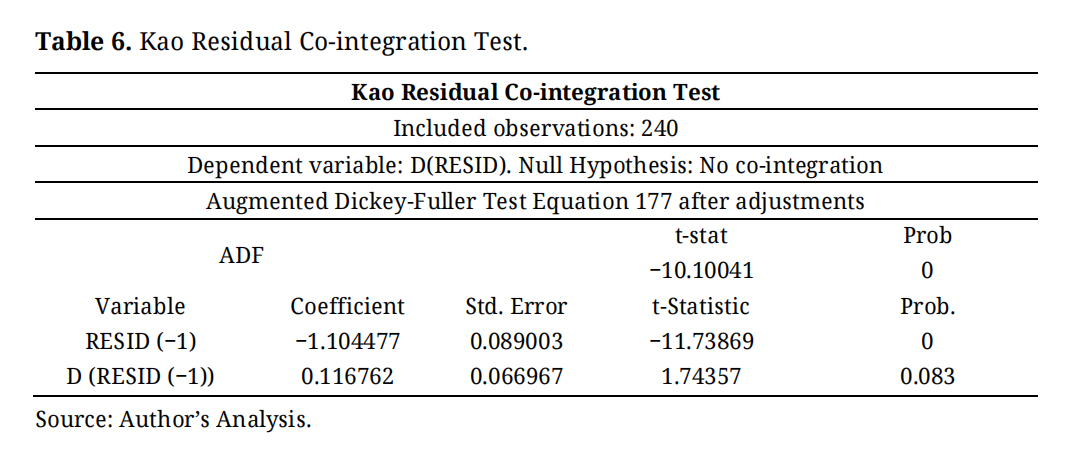 Table 6. Kao Residual Co-integration Test.
The study employed regression analysis methods to test the effect of financial inclusion on the countries’ poverty rate. The regression method employed in this study is the generalised method of moments (GMM). This was used to obtain a robust observation. The GMM is robust to outliers and can handle cases of missing or unbalanced data. The study examined the lagged effect of financial inclusion by lagging the poverty rate as Povrt (−1). This result implies that the study tested whether the current year’s independence and control variables influence the following year’s poverty rate.
Table 7 depicts the results from the analysis, with ATM as the main independent variable. The GMM results also show a statistically significant and negative impact of GDPGR and MOBSUB on poverty rate based on respective P-values (both of 0.00) and coefficients (−0.037 & −0.018). The table shows that the rest explanatory variables (LABFRCETOTAL, UNEMPRT, INFLNGDP, INTUSE, and POPGR) have statistically insignificant impact on poverty rate based on their p-values. In addition, the results from the multicollinearity test, with centred VIF below 5, show that there is no presence of multicollinearity (especially because all values are below 2), validating results from the regression. This result implies that the financial inclusion availability dimension (ATMs per 100,000 adult) does not impact poverty rate. Therefore, with an adjusted R-squared of 0.99 and an acceptable Durbin-Watson of 1.52 (between 1.5 & 2.5) indicating no positive or negative autocorrelation (and that the model is a good fit and is robust), it is safe to accept null hypothesis one, which states that “ATM availability does not influence poverty alleviation”.
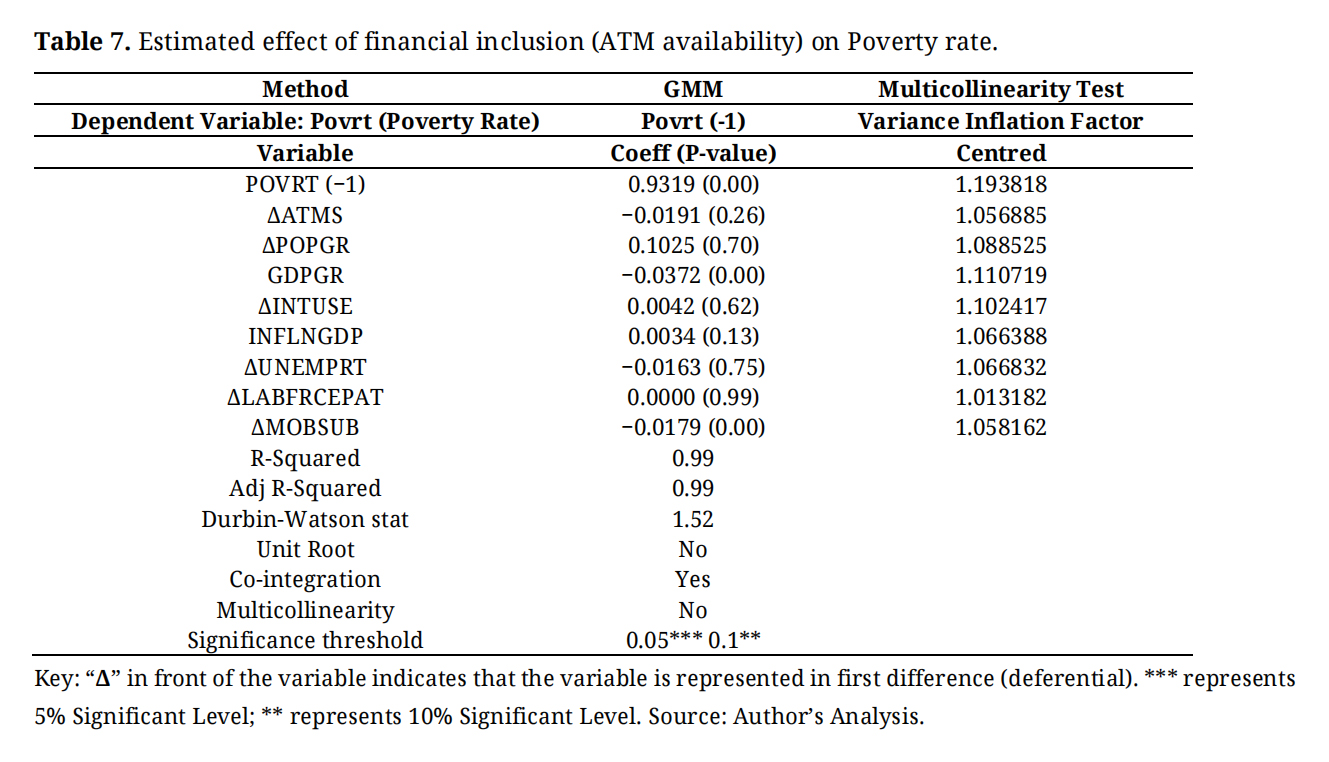 Table 7. Estimated effect of financial inclusion (ATM availability) on Poverty rate.
In addition, with the digitally inclusive variables in INTUSE and MOBSUB, only MOBSUB significantly impacts the reduction in poverty rate with its negative coefficient. The implication of these results is that GDPGR and MOBSUB impact negatively on poverty rate, showing that a percentage increase will lead to respective changes in poverty rate by −0.037 and −0.018. This result also implies that there is a 1.8% reduction in poverty rate when there is a 1% increase in mobile subscription. This would thus inform policy recommendations.
Table 8 shows that GDPGR (0.00) and MOBSUB (0.00) have p-values that are statistically significant (below the 0.05 and 0.1 threshold), indicating a negative impact on poverty rate (based on coefficients). In addition, the tangibility of impact varied with GDPGR and MOBSUB, showing that a percentage increase will lead to respective changes in poverty rate by −0.038 and −0.0177. Again, this implies that there is approximately 1.8% reduction in poverty rate when there is 1% increase in mobile subscription, which confirms the result from the previous analysis and further strengthens potential policy recommendations.
Conversely, MOBMONEY, POPGR, LABFRCEPAT, INTUSE, INFLNGDP, and UNEMPRT do not show significant p-values indicating no impact on poverty rate. The result from the financial inclusion usage proxy (MOBMONEY) show no impact on poverty rate. Therefore, with an adjusted R-squared of 0.99 and an acceptable Durbin-Watson of 1.50, it is safe to accept the null hypothesis that states that, “Mobile money usage does not influence poverty alleviation”. Similar to the analysis for model one, the results of the multicollinearity test of this examination show that all centred variance inflation factors are below 5 (and below 2). Furthermore, with the consistent significant results from the analyses in Tables 7 and 8, the study introduces these variables as moderators in the next analysis for testing hypothesis three (Table 9).
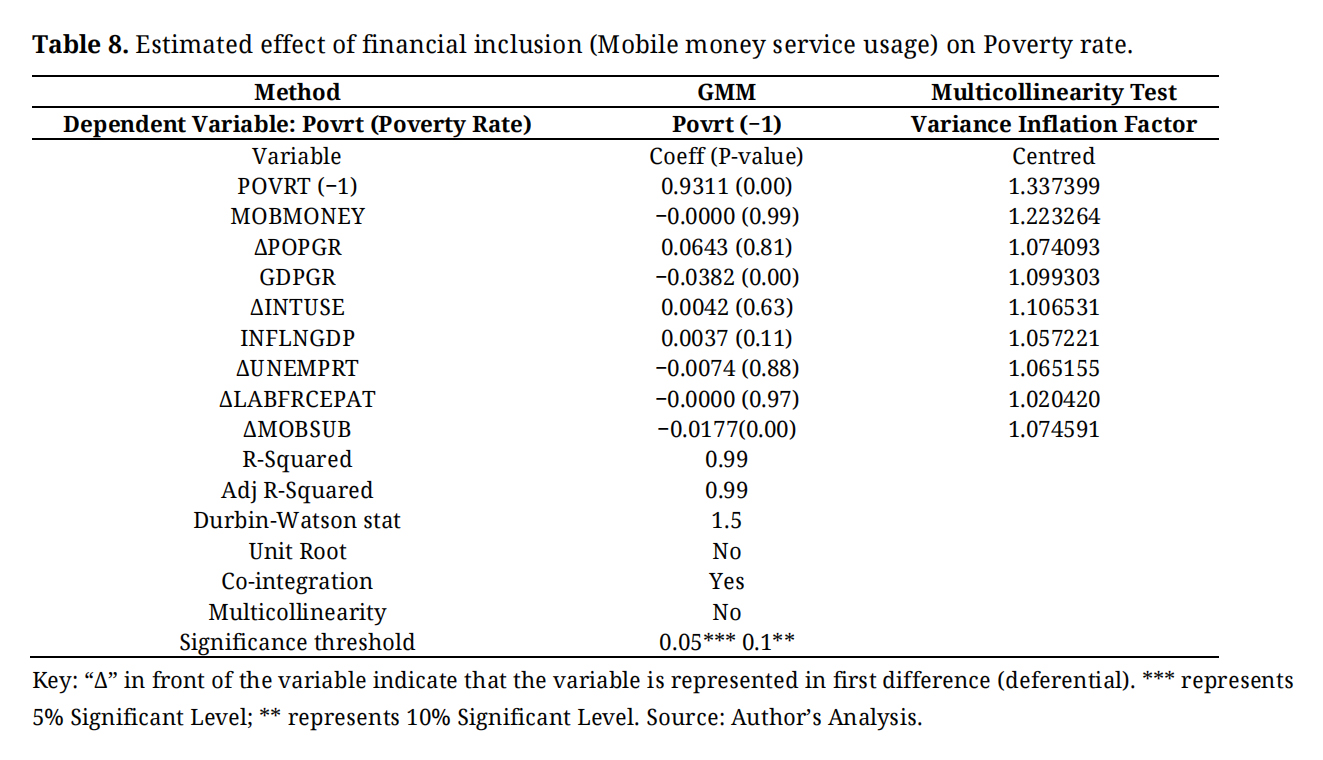 Table 8. Estimated effect of financial inclusion (Mobile money service usage) on Poverty rate.
Table 9 show the moderating effect of digital inclusion proxies on the impact of financial proxies on poverty rate. The table shows that none of the four combinations had significant impact on poverty rate. However, mobile subscription showed a significantly negative impact on poverty rate, which is consistent with its results in the first examinations, although it does not moderate ATM or Mobile money in impacting poverty rate.
The implication of the above results is that the combination of ATMs with mobile subscription as well as the combination of ATMs with Internet usage do not lead to alleviation of poverty. Similarly, the combination of Mobile money usage with internet usage as well as the combination Mobile money with mobile subscription do not lead to reduced poverty. Therefore, the hypothesis that states that “digital inclusion does not moderate the impact of financial inclusion on poverty alleviation in sub-Saharan Africa” is accepted. Furthermore, the multicollinearity test validates the results because it shows that there is no significant multicollinearity in the results (all centred VIF are below 5), though because they are above 2, there is an insignificant (immaterial) level of multicollinearity, which is expected because of the model specification (interacting variables).
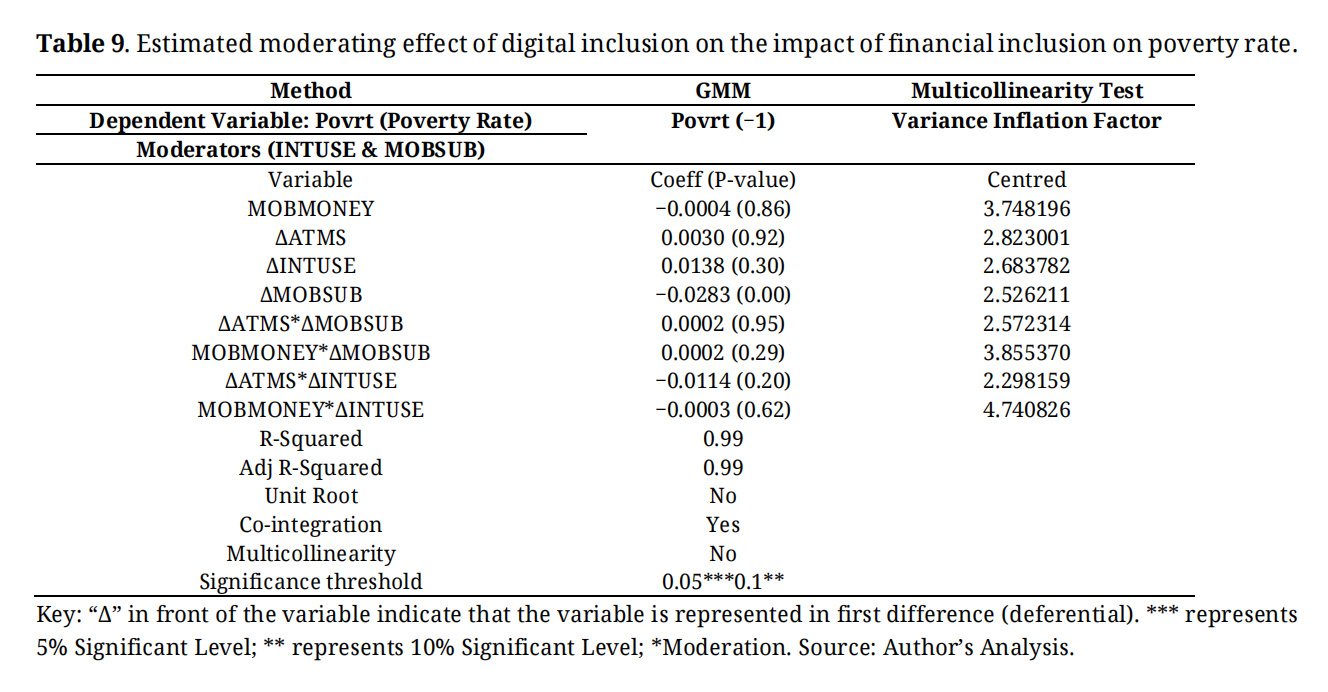 Table 9. Estimated moderating effect of digital inclusion on the impact of financial inclusion on poverty rate.
These results (as shown in Tables 7 and 8) mean that the accessibility and usage measure of financial inclusion have no impact on the reduction of poverty. Furthermore, when combined with digital inclusion variables in moderation, the impact remains statistically insignificant. These results (in terms of tested H1 and H2) are inconsistent with the works of other authors [22,23,25,26,28,31,35,37] because of the outcome of the p-values. However, when considering the direction of the coefficients, it is important to interpret the negative coefficients seen with both the ATMS (H1) and MOBILEMONEY (H2) results. These negative coefficients indicate a deep meaning to the influence of these proxies on poverty rate. The negative coefficients connote that increases in ATMS and Mobile money will lead to poverty reduction if the p-values are significant. This direction of the coefficients is consistent with the results from the studies, as all indicated a negative relationship between financial inclusion and poverty. Moreover, the results agree with those of [41,84], which indicate that financial inclusion does not impact poverty reduction. The p-values in their results were also not statistically significant.
In addition, all the three examinations show that mobile subscription (digital inclusion) consistently leads to reduced poverty rate but does not impact poverty reduction when combined with financial inclusion variables. The result for mobile subscription in this case showed that a percentage (1%) increase in mobile phones subscription will lead to a 2.8% reduction poverty rate. This also confirms the results obtained in early examinations (Tables 7 and 8).
In addition, the moderation examination showed that when combined with internet use/access, financial inclusion does not impact poverty rate reduction. The results specifically indicated a negative insignificant impact when financial inclusion combined with internet usage/access but a positive insignificant impact when combining with mobile subscription. These results are explained in the discussion of findings section.
Summary of findingsThis paper examined the impact of digital inclusive finance on poverty alleviation in sub-Saharan Africa, covering a 24-year observation period (2000 to 2023). Extant literature has examined financial inclusion using a variety of standardised proxies based on the accessibility, usage, and quality measures/dimensions of financial inclusion. However, the present paper examined the usage and accessibility dimensions with measurements such as mobile money usage and ATMs available per 100,000 adults while combining these variables with digital-based inclusion variables (Mobile subscription and internet accessibility) to see their moderating impact on poverty rate.
The study selected top ten sub-Saharan African economies based on their GDPs as of the year ended 2023 as seen in the World Bank Group database and based on factors described in the methodology. Based on these criteria, the study examined South Africa, Nigeria, Ethiopia, Sudan, Kenya, Angola, Tanzania, Cote d’Ivoire, Ghana, and the Democratic Republic of Congo. Data on these nations were obtained on the relevant variables from public and credible databases (WDI for world bank database, Our world in data and the global economy). The study employed the Generalised method of moment (GMM) for its panel data analysis. The results of the study are summarised in the Table 10 below.
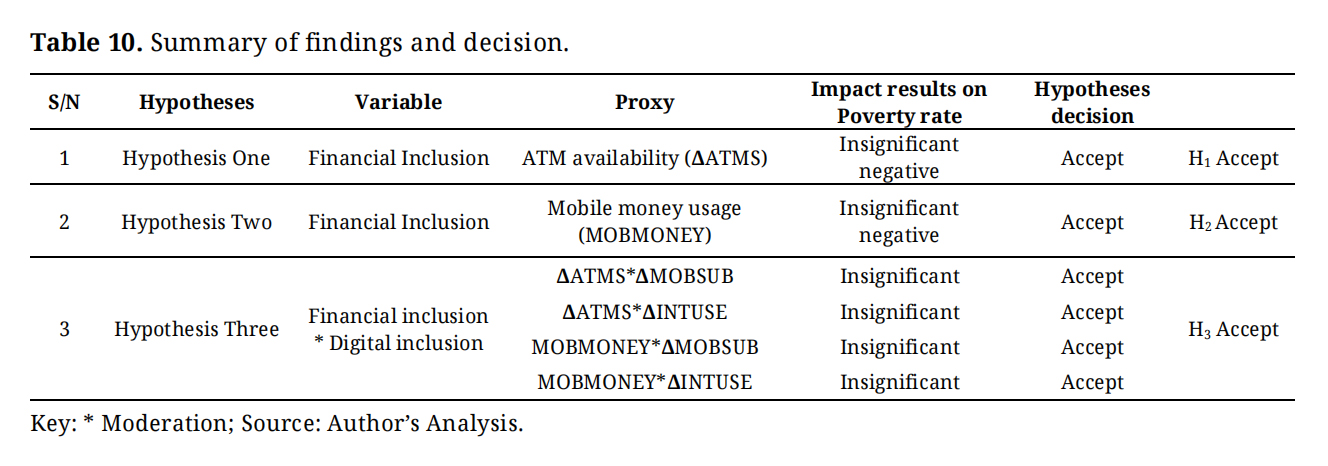 Table 10. Summary of findings and decision.
Hypotheses in this paper was divided into three tests. The first and second were towards the respective influence of ATM accessibility and mobile money usage on poverty rate, while the third was on the moderating influence of the digital inclusion measures on the first and second tests as stated in hypothesis three. The test results from this paper show that null hypotheses one, two, and three were accepted.
Discussion of Findings and Policy ImplicationsFurther observations from the results are discussed in this sub-section. The paper starts from the observations with the individual digital and financial inclusion proxies before it highlights observations from the moderation effects. Amongst the digital inclusion proxies, mobile subscription was the only proxy to show statistically significant negative influence on poverty rate in all the examinations. This indicates its contribution to poverty alleviation in SSA over the examined years. Based on the statistics (Table 4), the average percentage of mobile subscription usage is approximately 61%, signalling that above half of the population of the selected nations use mobile devices. However, the statistics do not specifically separate smart phones subscription from the rest. The assumptions are that smart phones (which are more common with phone users in today’s virtually digital age) have contributed greatly to economic empowerment, thus alleviating poverty.
The findings on the other digital inclusion proxy (internet use/access) indicate no impact on poverty rate on all examinations. These are the same findings observed from both financial inclusion proxies (ATM availability and mobile money). At first glance, these observations suggest that these inclusion-infrastructures do not influence poverty rate. Hence, they are not necessary considerations in financial and digital inclusion poverty reduction policies. However, with a closer examination of the results, one sees the need to re-assess these results with context of the reality of the availability, accessibility, and usage of these digital and financial infrastructures. For instance, when assessing the influence of ATMS, stakeholder would have to consider the availability of ATMs within these examined nations. Facilities like ATMs (that render public cash withdrawal, transfer and deposit services) are still insufficient per 100,000 adults (see descriptives mean in Table 4). An average of 10.4 ATMs per 100,000 adults paints the picture of poor availability, and by extension, accessibility.
Policy makers should note that these facilities will remain less influential on poverty rate with the availability status (10.4 ATMs per 100,000 adults) stated above. The question is, with the negative coefficient (poverty alleviation possibility) in the results (H1), will this infrastructure be significant in poverty alleviation if the number of ATMs available per 100,000 adults increased to sufficiently serve communities? Or will ATMs become less relevant as societies become more digital and cashless? This same question can also be asked when considering mobile money usage because the reality (Table 4) is that with an average, only 29% of the population of these countries are using mobile money (see mean in Table 4) and a country even has 0.015% usage of mobile money (see minimum [min] in Table 4). This also means that the use of mobile money may not be so effective in economic empowerment (poverty reduction) of individuals in these countries if their use of mobile money is low. Again, given the negative coefficient on the result on mobile money (H2), there is a possibility that increased mobile money usage (say from 29% to 85%) may improve its significant influence on poverty (leading to poverty reduction).
However, the findings from the effect of internet access (INTUSE) do not show negative coefficient (it has a positive relationship with poverty), thus signalling its ability to increase poverty rate. This is understandable in two folds. First, the internet is usually not used in isolation; it is accessed with a device (Mobile phones, computers). Hence, the mere examination of internet in isolation from its enabling gadgets may explain the statistically insignificant p-values. Secondly, despite the first reason, studies like [37] have examined internet use/access (in this case as a financial inclusion proxy) and have indicated its influence on poverty but when considering an average of 16% access to internet in the countries examined, the insignificant influence may be expected. In addition, the positive coefficient (indicating a positive relationship with poverty) has been explained by [86], who state that internet usage increases domestic consumption because of easy and efficient access to products of interest.
The moderating effect of mobile subscription and internet access with mobile money and ATMs availability on poverty rate show no impact on the reduction of poverty in all four results (Tabel 9). The results show that the combination of mobile subscription with ATMs and mobile money have negative coefficient with insignificant probability, unlike positive coefficient with internet use/access. This outcome can also be explained by the effect of consumption. Access to the internet is intangible and may not be considered as fixed access; it is a virtual consumable, making it more of a current asset. Access to the internet influences re-occurrent expenses/consumption (via re-occurrent internet subscription). However, when comparing this with mobile devices, it is a once-off expense on initial purchase and can thus be considered a fixed asset because mobile phones last for years if managed well. Hence, the tendency for internet use/access to reduce disposable income at a frequent rate, leading to poverty compared to mobile phone (a one-off) is high. In addition, when combined with the financial inclusion variables, access to financial services via the internet could also lead to a high level of consumption, which is common with the economies like in sub-Saharan Africa that have a youthful population [71,87].
This paper investigated the impact of digitalised inclusive finance on poverty alleviation in sub-Saharan Africa. While some literature has examined the individual effects of financial inclusion on poverty using primary and secondary data [26,32,36,54], a few studies have separately examined the usage, accessibility, and quality dimension of financial inclusion on poverty. Equally, although some studies have examined digital financial inclusion proxies like mobile money [37,88], there is a gap to fill when separately considering digital inclusion and digital financial inclusion proxies. This paper examined the moderation of digital financial inclusion proxies (ATMs and Mobile money) with digital inclusion proxies (Mobile subscription and internet access). This approach was necessary to gain clear insights on the combined elements of mobile money and internet access or mobile money and mobile subscription, as these proxies are used side by side in the digitalised society we live in nowadays.
The study employed robust panel data estimations by using the GMM estimation model, covering data for 24 years from the top ten sub-Saharan African countries based on 2023 GDP. The findings from the study show that the accessibility and usage dimensions of financial inclusion have insignificant impact on the reduction of poverty. Furthermore, findings show that mobile subscription has a negative significant impact on poverty rate in all examination. In addition, when the moderation combination of financial inclusion with digital inclusion proxies was assessed, all four combinations showed no significant impact on poverty rate. These combinations are ATMs–internet access, Mobile money–internet access, ATMs–Mobile subscription, and Mobile money–mobile subscription. Two of the moderation combinations with mobile subscription showed negative insignificant impact, while two combinations with internet use/access showed negative insignificant impact on poverty.
RecommendationsBased on the findings, the mobile subscription is the only inclusion proxy that indicated influence (alleviation) on poverty rate in all examinations. This agrees with [86,87], as they also show that mobile phone leads to income diversification. Therefore, investments and efforts to integrate more financial service functions on mobile devices may be prioritised by policy makers. This would facilitate access by marginalised societies. Mobile phones, especially the app-enabled ones (smartphones), would facilitate financial service functions, reducing the need for physical banking. In addition, Africa is a big market for smart phone imports. Therefore, policies to ensure the affordability of smart phones will increase the use of smart phones and hence encourage more digital financial services in sub-Saharan Africa. This recommendation does not oppose the results because there are other financial inclusion proxies than the ones moderated; however, in all examinations, mobile subscription proved to have a positive on alleviating poverty.
In addition, policy makers, management, and other stakeholders (decision makers) should carefully consider the following summarised possibilities (earlier highlighted in the discussion) amongst others before decision making.
-
-
-
-
One of the limitations to this study was that it did not control for global socio-economic events such as the COVID-19 pandemic and the 2008/2009 global recession) that could have influenced poverty rates across the examined nations. The study argued for the justification of seven (7) other key control variables that were used in the study but could have accounted for these socio-economic global events. This was not within the scope of this paper. Future studies should consider accounting for these key global events for greater insights. Furthermore, future research could also capture a pre- and post- COVID-19 assessment of the impact of digital inclusion and financial inclusion on poverty rate because digitalisation has become the new normal in the post-COVID-19 pandemic years, and the heavy reliance on digitalised banking systems is expected to impact access to financial services even more in the coming years.
Likewise, the study does not capture qualitative dimensions of financial and digital inclusion such as service quality and user literacy. Future research could capture these using mixed methods or qualitative methodology. Furthermore, the GDP-based country selection can overlook high-poverty countries, suggesting a vital need for broader sampling.
In addition, the proxies used for examining digital and financial inclusion in this paper may have limited possibilities of outcomes. For instance, ATM availability may not be a perfect blend or interactor with digital inclusion variables like mobile phone subscription or internet. Although they can combine in function, they do not blend as a single function, unlike what internet access and mobile money do. Hence, future studies could examine more relevant measures of digital inclusion and financial inclusion such as mobile bank applications, cryptocurrency accounts (blockchain accounts), FOREX engagements, savings and investments, personal remittance, and portable computer usage (workstations). Future studies can even investigate the influence of social media earnings on poverty rate comparatively between several regions.
The dataset generated for and analysed during the study is available from the corresponding author upon reasonable request.
Conceptualization, BS-I and TM; methodology, BS-I; formal analysis, BS-I; investigation, BS-I.; resources, TM; data curation, BS-I; writing—original draft preparation, BS-I; writing—review and editing, TM; visualization, TM; supervision, TM; project administration, TM.
The authors declare that they have no conflict of interest.
The research received no external funding.
The authors acknowledge the Department of Accountancy, College of Business and Economics, University of Johannesburg for the support while undertaking this study.
1.
2.
3.
4.
5.
6.
7.
8.
9.
10.
11.
12.
13.
14.
15.
16.
17.
18.
19.
20.
21.
22.
23.
24.
25.
26.
27.
28.
29.
30.
31.
32.
33.
34.
35.
36.
37.
38.
39.
40.
41.
42.
43.
44.
45.
46.
47.
48.
49.
50.
51.
52.
53.
54.
55.
56.
57.
58.
59.
60.
61.
62.
63.
64.
65.
66.
67.
68.
69.
70.
71.
72.
73.
74.
75.
76.
77.
78.
79.
80.
81.
82.
83.
84.
85.
86.
87.
88.
Simon-Ilogho B, Moloi T. The Impact of Digital and Financial Inclusion on Sustainable Poverty Alleviation in Sub-Saharan Africa. J Sustain Res. 2026;8(2):e260037. https://doi.org/10.20900/jsr20260037

Copyright © Hapres Co., Ltd. Privacy Policy | Terms and Conditions