Location: Home >> Detail
J Sustain Res. 2026;8(4):e260086. https://doi.org/10.20900/jsr20260086
 ,
Abderahman Rejeb 1 ,
Santi Setyaningsih 2
1
2
*
Food waste in the bakery industry remains one of the most pressing sustainability challenges, as the perishability of baked goods and volatile consumer demand frequently result in high levels of unsold and expired products. To address this problem, the present study develops a simulation-based decision-support framework that replicates bakery supply chain dynamics and evaluates targeted waste-reduction strategies. Using Tecnomatix® Plant Simulation, we modeled a two-echelon supply chain consisting of one manufacturer and three retailers, with operational assumptions reflecting oven availability, labor shifts, product shelf life, and customer purchasing behavior. The system was simulated over a 90-day horizon under three intervention scenarios: (1) manufacturer-level process improvements, (2) retailer-level adjustments through extended operating hours, and (3) integrated cross-tier collaboration. Results based on 10 simulation replications show that retailer-level operational changes generated the largest performance improvement, reducing the mean food waste rate from 16.21% in the baseline to 3.20%. The combined intervention achieved the best average overall performance, with a mean production of 13,062.8 units and a mean food waste rate of 3.15%. However, its incremental advantage over the retailer-only intervention was modest. The study contributes a detailed operational implementation of discrete-event simulation using Tecnomatix® Plant Simulation to quantify the relative and combined effects of manufacturer- and retailer-level interventions in bakery operations. The findings highlight the value of operational interventions across manufacturer and retailer activities and provide a replicable modeling framework to guide sustainability-oriented decision-making in bakery and other short shelf-life supply chains.
Food waste in the bakery industry presents a significant sustainability challenge due to the perishable nature of baked goods and the high variability in consumer demand. Globally, one-third of all food produced is either lost or wasted, with bakery products being among the most frequently discarded due to their short shelf life and limited preservation options [1–3]. This waste not only results in economic losses but also exacerbates environmental impacts through resource inefficiencies and increased carbon emissions across the supply chain [4,5]. The motivation for this study stems from the persistent mismatch between production and retail operations in bakery supply chains. Manufacturers often optimize production schedules without considering demand variability at the retail level, while retailers face constraints such as limited operating hours, short shelf lives of products, and storage limitations. These disconnects frequently lead to overproduction, unsold inventory, and premature expiration of products. For bakeries, particularly small and medium-sized enterprises, this not only translates into financial loss but also weakens competitiveness in a market that already operates on tight margins. Addressing this challenge is therefore critical for both business survival and the broader goal of reducing inefficiencies in food systems.
The food supply chain (FSC) is a complex, multi-tiered network in which decisions at the manufacturing, distribution, and retail levels interact to influence outcomes such as efficiency, profitability, and waste [6]. Within this context, the bakery supply chain is particularly vulnerable to inefficiencies due to constraints imposed by freshness requirements, daily production cycles, and dynamic retail environments [3,7]. As a result, decision-makers increasingly seek operational strategies that balance demand fulfillment with waste minimization.
Simulation modeling has emerged as a valuable decision-support tool to address these complexities. By replicating real-world supply chain dynamics, simulation enables practitioners to test and evaluate alternative process flows, inventory strategies, and collaborative policies without disrupting actual operations [8–10]. In bakery-specific contexts, simulation has been used to optimize oven scheduling [11], enhance demand forecasting with AI [12], and assess sustainability trade-offs in production decisions [13,14]. In this study, we employ Tecnomatix® Plant Simulation, a discrete-event simulation platform widely used to analyze production and logistics systems. The software allows the construction of digital twins of manufacturing and distribution processes, enabling controlled experimentation with operational scenarios. Its features include modeling of material flow, resource availability, shift patterns, and inventory buffers, all of which are highly relevant to bakery operations where oven scheduling, labor allocation, and perishability constraints critically influence performance. Moreover, by testing policies in a virtual environment, Tecnomatix helps avoid costly and risky trial-and-error in live bakery operations, making it an ideal tool for studying perishable food supply chains.
Recent studies underscore the importance of integrating sustainability and collaboration across the FSC. For instance, Li et al. (2021) [15] used a quantum game theory model to demonstrate that cooperative strategies between manufacturers and retailers yield significantly better outcomes than isolated decision-making. Similarly, Beullens and Ghiami (2022) [16] highlighted how supply chain structure influences retailer performance and waste reduction. These findings are reinforced by macro-level analyses advocating for systemic policy and technology interventions to enable waste mitigation [17]. Building on these insights, this study develops a two-echelon simulation-based model tailored to the bakery industry. The model evaluates manufacturer-level, retailer-level, and combined operational interventions within a unified Tecnomatix® Plant Simulation framework. By incorporating operational assumptions related to oven availability, labor shifts, customer behavior, and product shelf life, the model enables the effects of operational changes across interconnected stages of the bakery supply chain to be examined.
Three scenarios are explored: (1) process improvements at the manufacturer level, (2) extended store hours at the retail level, and (3) integrated, cross-tier interventions. The findings demonstrate that retailer-level changes substantially reduce food waste, while the combined intervention provides a modest additional improvement in overall performance. In doing so, the study contributes a detailed operational implementation of discrete-event simulation using Tecnomatix® Plant Simulation to evaluate waste-reduction interventions across interconnected manufacturer and retailer operations.
The remainder of this paper is organized as follows. Section Literature Review reviews the existing literature on simulation in perishable food supply chains, with a particular focus on bakery-specific studies and integrated decision-making approaches. Section Method outlines the methodology, including the development of the simulation model, operational assumptions, and scenario-based analysis. Section Results and Discussion presents and discusses the simulation results across baseline, manufacturer-level, retailer-level, and integrated improvement scenarios. Section Conclusions concludes with key findings, practical implications for bakery operations, limitations, and directions for future research.
The food supply chain (FSC) is a complex, multi-layered system that involves numerous activities, including production, processing, packaging, logistics, retail, and consumption, where decisions at any stage can significantly affect sustainability, efficiency, and waste [1,6]. Perishable products, in particular, pose challenges due to their short shelf life and susceptibility to quality degradation [2]. Simulation modeling has become a widely used method to analyze such systems because it allows researchers to experiment with alternative strategies without disrupting live operations [18,19]. Agent-based and discrete-event simulation approaches have been applied to examine resilience, coordination, and waste reduction in perishable supply chains. For example, Nikounam Nezami et al. (2024) [19] modeled supply chain resilience for unnecessary perishable foods, demonstrating how scenario-based simulations can reveal vulnerabilities and mitigation options. Alidoost et al. (2025) [18] provided a comprehensive review of simulation in perishable healthcare supply chains, highlighting methodological trends and data requirements that are equally relevant for agri-food and bakery contexts. Leithner and Fikar (2022) [20] emphasized the role of high-quality data in simulation for organic fresh food supply chains, finding that integrating product quality information can improve waste prevention. Similarly, Orjuela-Castro et al. (2021) [21] developed a multi-objective model for perishable food logistics network design, balancing availability, access, and cost efficiency.
Bakery-Specific Simulation and Optimization StudiesBakery products represent one of the most waste-prone categories in retail due to rapid staling and fixed daily production schedules [3,5]. Simulation offers a practical means of optimizing these operations. Dias Capriles et al. (2023) [22] employed discrete-event simulation in a Portuguese bakery to evaluate production schedule variations and identify bottlenecks, significantly improving throughput and reducing waste. Babor et al. (2023) [11] applied a no-wait flowshop scheduling model to small and medium-sized bakeries, demonstrating that optimized sequencing reduces oven idle time and energy consumption. Hübner et al. (2024) [12] integrated AI-based demand forecasting with simulation to prevent overproduction in a German bakery chain, lowering both waste and carbon footprint.
From a sustainability perspective, Bartek et al. (2025) [23] analyzed prevention and valorization strategies for surplus bakery products at the retail level, demonstrating the environmental benefits of early intervention in waste streams. Dweiri et al. (2021) [24] examined sweet bakery waste management strategies within a circular economy framework, highlighting the potential for by-product utilization. Together, these studies underscore that simulation-driven optimization can improve efficiency and sustainability in bakery operations at both production and retail stages.
Retail- and Consumer-Level Strategies for PerishablesAt the retail level, simulation models have been used to evaluate inventory policies, pricing strategies, and customer behavior in perishable product markets. Janssen et al. (2018) [25] developed an age-based inventory model that incorporated store closing days and demand variability, reducing waste through dynamic ordering strategies. Gioia et al. (2023) [26] combined discrete choice models with simulation to analyze consumer responses to quality and price variations, showing that adaptive pricing can mitigate losses from unsold products. Bartek et al. (2025) [23] complemented these findings by demonstrating that prevention and valorisation measures, such as improved demand forecasting, price reductions, and redistribution, can significantly reduce surplus bakery waste and its environmental impact, with prevention strategies offering the highest potential for climate impact reduction.
Beyond inventory and pricing, Orjuela Castro et al. (2021) [21] explored logistics network configuration for seasonal perishable food supply chains, finding that integrating transport and retail strategies improved both service level and freshness. Pavlenko et al. (2023) [27] examined cold supply chain routing options using simulation, demonstrating that optimized transport decisions are key to maintaining quality in perishable products.
Sustainability, Resilience, and Integrated Decision-MakingRecent studies have expanded the application of simulation in perishable food supply chains to encompass sustainability and resilience dimensions. Abbasian et al. (2023) [28] proposed a hybrid optimization model for sustainable and resilient perishable supply chains that integrates environmental and cost objectives. Aziz et al. (2025) [29] analyzed ripple effects in urban perishable supply chains under disruptions, highlighting the need for resilience planning in local markets. Shadkam and Irannezhad (2025) [30] reviewed simulation optimization methods in agricultural supply chains, advocating for agent-based intelligent frameworks to enhance adaptability.
In bakery contexts, sustainability studies have examined alternative raw materials [31–33] and by-product valorization [34] These works align with broader research showing that upstream production decisions and downstream retail strategies are interdependent. Li et al. (2021) [15] demonstrated via game theory that cooperative manufacturer–retailer decisions outperform isolated ones in waste reduction and profit generation. Mirabelli and Solina (2022) [35] further stressed that integrating upstream and downstream simulation models yields a more accurate representation of perishable supply chain performance.
Recent research further emphasizes the importance of circular-economy approaches and technology-enabled waste management for improving sustainability and resource efficiency. Digital technologies can facilitate circular waste management by improving information availability, resource utilization, and environmentally oriented decision-making [36]. At the supply-chain level, integrated optimization of recycling and emission-reduction decisions can also support the simultaneous pursuit of economic and environmental objectives [37]. More broadly, circular-economy practices have been linked to socio-ecological resilience by promoting resource efficiency and reducing pressures associated with resource scarcity [38].
Research Gap and ContributionWhile previous research has explored either production-level optimization in bakeries [11,12] or retail-side waste prevention strategies [23,25]. Few studies have developed a unified simulation framework to evaluate both tiers simultaneously. Even fewer have quantified the relative and combined effects of manufacturer-only, retailer-only, and coordinated interventions in bakery supply chains. This study addresses that gap by constructing a two-echelon simulation model using Tecnomatix® Plant Simulation to test these scenarios, measuring their impact on waste reduction and production throughput. By using assumed yet realistic parameters, the model remains adaptable for various bakery contexts while demonstrating the practical value of integrated decision-making for perishable product sustainability.
This study adopts a simulation-based approach, utilizing Tecnomatix® Plant Simulation to explore strategies for increasing production output and reducing waste in the manufacturing and retailing of cakes and cupcakes. The research begins by defining a set of assumptions that inform the model’s input parameters, including processing times, availability rates, consumer behavior, shelf life, and buffer capacities. Due to limitations in accessing empirical operational data, most parameters used in the simulation were entirely hypothetical but selected to reflect plausible bakery operational scenarios. However, mixing and baking times were informed by publicly available baking guidelines and recommendations [39–42]. This approach was intentionally chosen to create a controlled, exploratory environment that demonstrates bakery supply chain dynamics and evaluates the potential impacts of small operational interventions. A simulation model was then developed to represent a typical two-echelon bakery supply chain, consisting of one manufacturer and three retailers. All operational parameters were assumed but selected within realistic ranges reported for bakery operations to illustrate supply chain dynamics and evaluate the effects of small operational changes.
Three distinct scenarios are examined: the first involves operational changes implemented solely at the manufacturer level; the second focuses on improvements introduced at the retailer level; and the third explores the combined impact of coordinated adjustments made by both the manufacturer and the three retailers. The simulation results are analyzed and discussed to provide practical insights into how individual and collaborative efforts can enhance performance across the bakery supply chain.
Simulation Model Design Manufacturer LevelThis section presents the internal production structure and operational logic assumed at the manufacturer level in the simulation model.
Production Structure and AssumptionsThe manufacturer consists of two main production lines:
●
●
To simplify the modeling, the simulation assumes that the production process involves two types of mixtures: a wet mixture and a dry mixture. These are routed through five dedicated mixing machines, each responsible for creating batter specific to a product flavor. The batter is then temporarily stored in buffers before being sent to the ovens.
Mixing Station SpecificationsTable 1 summarizes the specifications and ingredient-routing structure for each mixing machine, including product assignment, liquid and dry ingredient flow controls, processing times, availability rates, and output buffer capacities.
Each mixing station receives two ingredient streams through separate flow-control objects. Flow Control 1 regulates the transfer of liquid ingredients from the 2500 kg liquid-ingredient buffer to the five mixing machines, while Flow Control 2 regulates the transfer of dry ingredients from the 2500 kg dry-ingredient buffer. Both flow controls are connected to all five mixing machines and route the required ingredient stream to the mixing station associated with the product being produced.
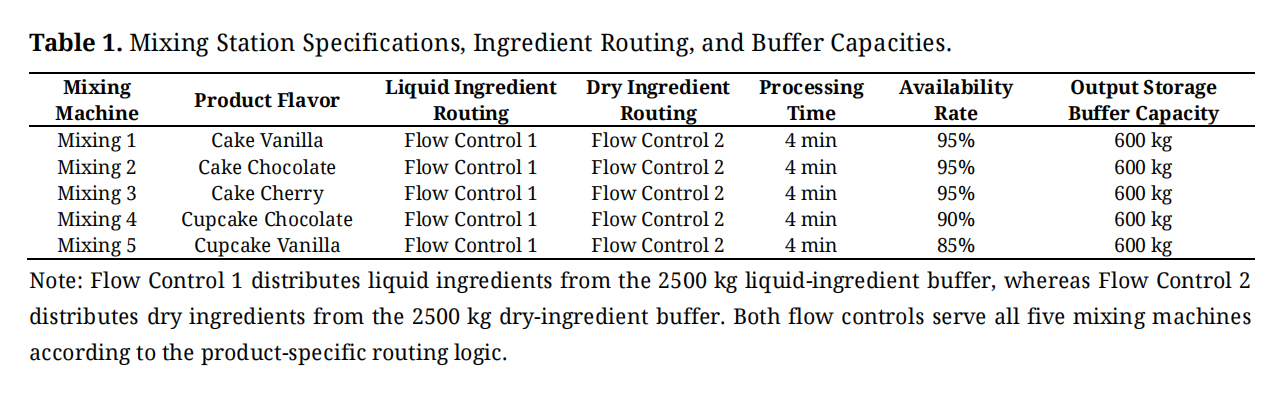 Table 1. Mixing Station Specifications, Ingredient Routing, and Buffer Capacities.
Each mixing machine is dedicated to one product flavor and processes the incoming wet and dry ingredients for four minutes. After mixing is completed, the prepared batter is transferred to the corresponding output buffer, which has a capacity of 600 kg. The batter is then sent from this buffer to the oven assigned to that product. Accordingly, the material flow at this stage follows the sequence: ingredient buffer → flow control → mixing machine → output buffer → oven.
The availability rates shown in Table 1 represent the proportion of operating time during which each mixing machine is assumed to be available for processing. These rates were introduced as modeling assumptions to represent plausible differences in equipment availability within the exploratory simulation and were not derived from empirical bakery data.
Oven SpecificationsOnce the batter is prepared and buffered, it is directed to one of five ovens for baking. Each oven receives its input from a specific mixing machine via the associated buffer. Specifically, Oven 1 receives batter from Mixing Machine 1 (Cake Vanilla), Oven 2 from Mixing Machine 2 (Cake Chocolate), Oven 3 from Mixing Machine 3 (Cake Cherry), Oven 4 from Mixing Machine 4 (Cupcake Chocolate), and Oven 5 from Mixing Machine 5 (Cupcake Vanilla). Table 2 outlines the oven assignments, their processing durations, and availability rates.
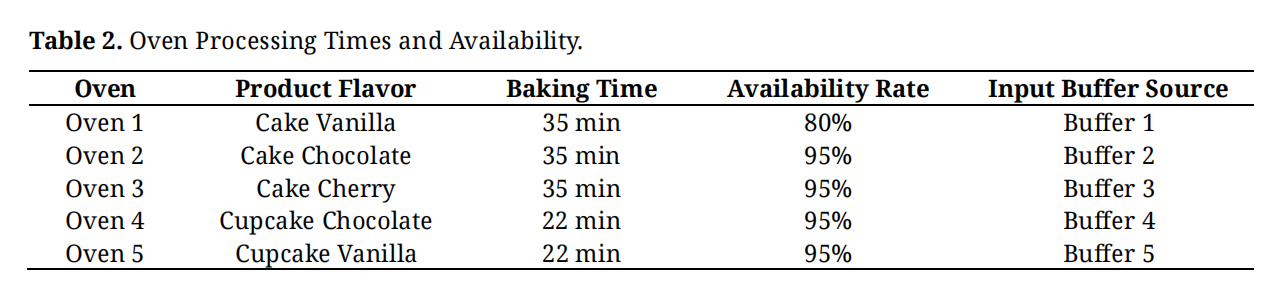 Table 2. Oven Processing Times and Availability.
Similarly, the oven availability rates were assumed parameters used to represent differences in equipment availability and were not derived from empirical observations.
Labor Allocation and ShiftsLabor resources are divided among mixing, packaging, and dismantling operations. Operating days are Monday to Friday only, and workers operate on a two-shift system to align with production timelines.
●
●
●
The working hours and break times for the two shifts are summarized in Table 3.
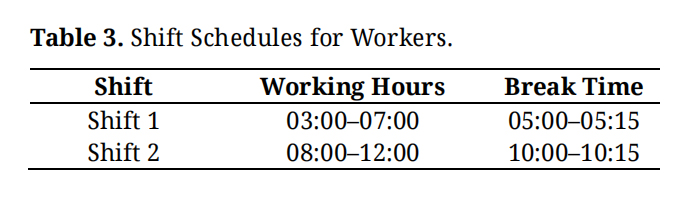 Table 3. Shift Schedules for Workers.
Finished products are sorted and distributed using two trucks:
●
●
Two delivery trucks are used in the distribution process, with each truck having a capacity of 600 units. Delivery is done once daily to all retailers. Deliveries occur on manufacturing days (Monday–Friday). During weekends, retailers remain open and satisfy customer demand from available inventory carried over from Friday, with replenishment resuming on Monday. Transportation time was intentionally excluded from this model to simplify analysis and isolate production-retail dynamics, focusing specifically on operational interventions directly related to baking, storage, and retail access. This exclusion may limit the real-world applicability of the results, and future studies should incorporate detailed transportation time to enhance realism and accuracy.
Retailer LevelThis section outlines the operational details of the three retailers receiving goods from the manufacturer. Each retailer specializes in a specific flavor:
●
●
●
Each retailer has a buffer to temporarily store incoming products before shelving. The buffer capacities for each retailer are presented in Table 4.
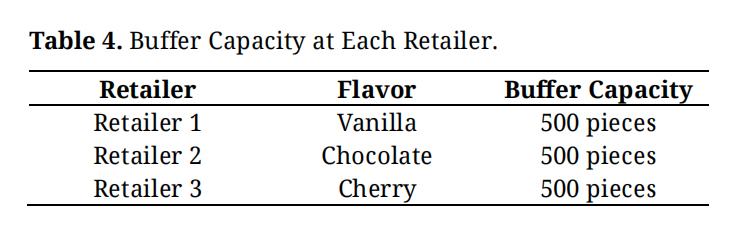 Table 4. Buffer Capacity at Each Retailer.
Customers arrive at the store following a normal distribution (mean = 5 min, SD = 2 min), with arrival times spread between 2 and 20 min. Each customer requires about 3 min to select a product and complete checkout. The customer inter-arrival distribution was adopted as a simplifying modeling assumption rather than being estimated from empirical customer-arrival data. A bounded normal distribution was used to represent arrivals concentrated around an average interval while preventing unrealistic extreme values. Future empirical applications should calibrate the arrival distribution using observed customer data and examine alternative arrival processes.
Store Operating HoursThe operating schedule for retailers is presented in Table 5.
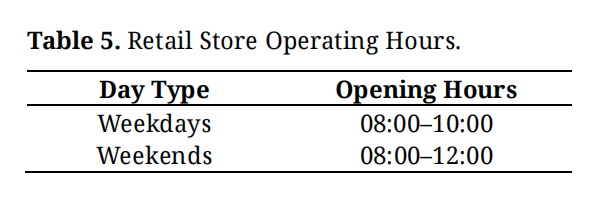 Table 5. Retail Store Operating Hours.
The two-hour weekday operating window was adopted as a deliberately constrained baseline assumption for this exploratory simulation rather than as a representation of typical bakery retail hours. This setting enables the model to evaluate whether a modest extension in customer access can influence product turnover and expiration. Accordingly, Scenario 2 extends the weekday operating window by one hour while keeping the remaining model conditions unchanged.
Simulation Setup and Expiry HandlingThe simulation is configured with the following parameters:
●
●
●
●
Product routing is controlled via logic-based flow controls:
●
- Vanilla → Retailer 1;
- Chocolate → Retailer 2;
- Cherry → Retailer 3.
●
Table 6 presents the key output metrics obtained from the first simulation replication under the baseline configuration. The first replication is presented here to illustrate the model output, while the statistical analysis reported in Section Results and Discussion is based on all 10 simulation replications.
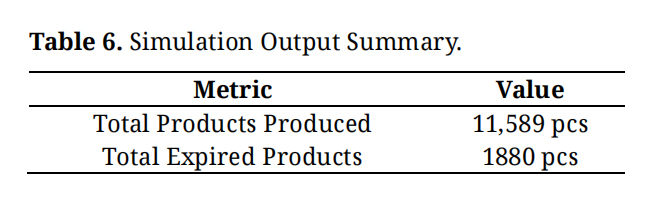 Table 6. Simulation Output Summary.
These values represent the output and waste observed in the first replication and provide an illustrative baseline of the simulation model. The complete results from all 10 replications are provided in Table A1 and summarized statistically in Section Results and Discussion.
To help contextualize the assumptions and system structure described above, Figure 1 illustrates the simulation model and output from the first replication of the baseline configuration in Tecnomatix® Plant Simulation. The visual layout reflects the operational flow at both the manufacturer and retailer levels, including ingredient mixing, buffering, baking, packaging, transportation, dismantling, and retail distribution.
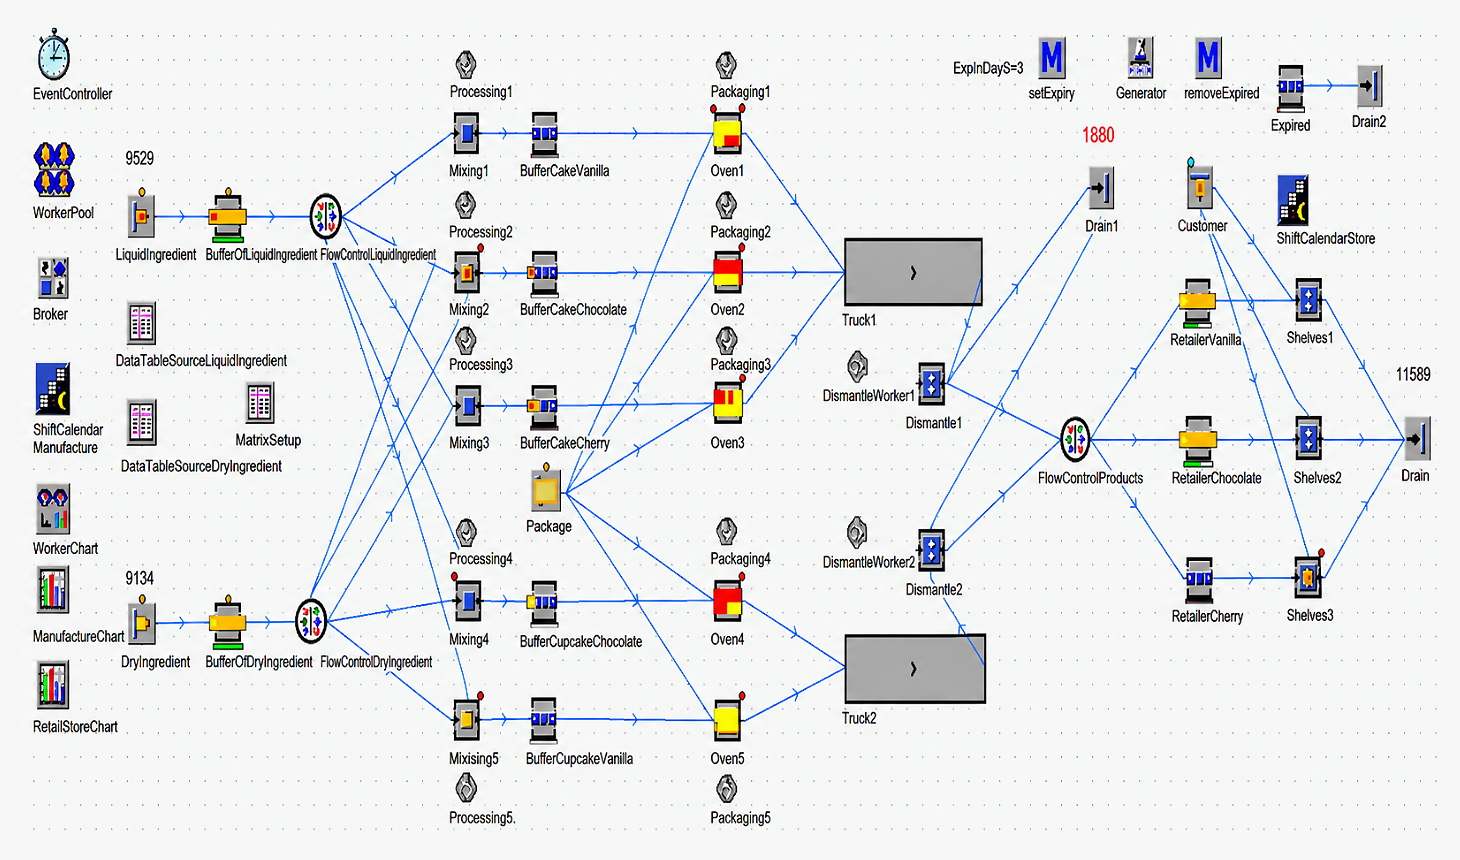 Figure 1. Overview of the Bakery Supply Chain Simulation Model in Tecnomatix® Under Base Scenario.
The simulation model of the bakery supply chain was developed using Tecnomatix® Plant Simulation 2302, a discrete-event simulation software widely used for analyzing and optimizing manufacturing and logistics systems. The platform allows users to represent complex operations using object-oriented structures, where each production stage and transport activity can be modeled as a logical block connected by material-flow links.
In the present study, the model was organized into two main subframes: one for the manufacturer and one for the retail network. Within the manufacturer frame, each production activity -mixing, baking, and packaging- was modeled using SingleProc objects to represent individual processing stations. Buffers were introduced between these stations to handle the flow and temporary storage of semi-finished goods, while FlowControl objects regulated the movement of batches between stages according to production logic and resource availability.
Labor resources were incorporated through WorkerPool objects, which were connected to the production equipment to ensure that tasks such as mixing and packaging could only be performed when workers were available. Transport between the manufacturer and retailers was handled using Transporter objects, representing delivery trucks operating on a scheduled route. Retail stores were modeled with inventory buffers and shelf areas, while the EventController coordinated daily deliveries, customer arrivals, and the disposal of expired items.
All events and interactions within the model were defined using built-in dialog parameters available in Tecnomatix®, which enabled full control of process timing, equipment availability, and product flow without requiring external scripting. During each simulation, key performance indicators (KPIs), including total production, total expired units, and retailer throughput, were automatically recorded and exported for analysis. The overall simulation horizon covered a 90-day operational period, representing a typical production quarter under realistic demand and resource constraints.
Simulation Replications and Statistical AnalysisBecause the simulation model incorporates stochastic elements, reliance on a single simulation run could make the reported results sensitive to a particular random-number sequence. Therefore, each of the four model configurations, the baseline, manufacturer-only, retailer-only, and combined scenarios, was evaluated using 10 simulation replications. Random Numbers Variants 1–10 in Tecnomatix Plant Simulation were used consistently across the four configurations. The “Increment Variant on Reset” option was enabled so that the random-number variant advanced between successive replications. Appendix A provides results for all 10 random-number variants.
Each replication covered the same 90-day simulation horizon, while the operating parameters defining each scenario remained unchanged. No warm-up period was applied because the model represents a finite 90-day operating horizon, and the initial system conditions form part of the simulated period. At the end of each replication, total production and total expired products were recorded as the principal performance indicators. The food waste rate was calculated as the number of expired products divided by total production.
For each scenario, the mean and standard deviation across the 10 replications were calculated. Uncertainty around the mean was evaluated using a 95% confidence interval based on the Student’s t distribution:
where represents the replication mean, s is the sample standard deviation, and n is the number of replications. For 10 replications, the corresponding critical value is t0.975,9 = 2.262. This replication-based procedure reduces reliance on a single stochastic realization and provides a more robust basis for comparing the baseline and intervention scenarios. The individual outputs from all 10 random-number variants for each model configuration are reported in Table A1.
Optimization and Scenario Analysis ApproachThe optimization component of this study was designed to evaluate practical improvements in production and distribution efficiency rather than to perform algorithmic optimization. The process followed a scenario-based optimization approach, where alternative operational strategies were tested systematically within the simulation model and compared based on performance outcomes.
The first step involved identifying operational bottlenecks observed in the baseline simulation, particularly in oven utilization and product expiration levels. Based on these insights, key decision variables were defined, namely, oven assignment schedules, buffer capacities, and retailer operating hours. These parameters were then modified to create a series of test scenarios aimed at improving productivity and reducing waste. Three main optimization scenarios were developed:
1.
2.
3.
Each scenario was simulated over the same 90-day horizon under identical input conditions. The results were analyzed in terms of total products produced, total expired products, and overall waste reduction relative to the baseline configuration. This approach provided a structured yet practical optimization framework that reflects the way small and medium-sized bakeries can test operational strategies before implementation in real settings. The scenario-based optimization framework thus served as an experimental design tool, enabling comparative assessment of different policy alternatives within a controlled digital environment.
Mathematical Model FrameworkTo provide analytical support for the simulation framework, a mathematical model was developed to formalize the key decision relationships within the bakery supply chain. While the complete system in Tecnomatix® Plant Simulation includes multiple stochastic subsystems, mixing, baking, packaging, transport, and retail operations, the formulation below focuses on the inventory–expiry subsystem, which governs the dominant sustainability outcomes of interest: food waste and throughput. This subsystem integrates production output, delivery timing, shelf-life limits, and consumer demand, making it the critical driver of efficiency and waste reduction in perishable bakery operations. The same analytical framework can be extended in future research to include additional production scheduling and logistics constraints for upstream processes.
Sets and Indices
p ∈ P : product types (cakes: vanilla, chocolate, cherry; cupcakes: vanilla, chocolate);
r ∈ R : retailers (1: vanilla, 2: chocolate, 3: cherry);
a ∈ A = {0, 1, 2}: product age in days (expires after age 2);
t = 1, …, T: days in the simulation horizon.
Parameters
: mixing time (min/batch);
: baking time (min/batch);
: effective oven availability (0–1);
H: productive minutes per day from the shift schedule;
: batch size (pieces) per bake cycle;
: retailer buffer capacity (pieces);
: realized daily demand (stochastic in simulation).
The daily production capacity for each product p is calculated as:
Decision and State Variables
: quantity of product p produced on day t ;
: shipment of product p to retailer r on day t ;
: inventory of product p at retailer r with age a;
: units of product p sold from the inventory of age a;
: expired units of product p removed at retailer r on day t.
Production and Shipment Constraints
Retail Capacity Constraint
Inventory Aging and Sales Dynamics
Inventory is tracked by product age and updated in a first-in, first-out (FIFO) sequence within each day. New arrivals from the manufacturer enter as age-0 stock:
for a = 1, 2:
daily sales follow a first-in, first-out (FIFO) rule:
Expiry Process
Inventory reaching age three is removed at the start of the next day:
Objective Function
The dual objective is to minimize product expiry while maximizing throughput:
Performance Measures
all decision variables are non-negative:
this mathematical formulation mirrors the logic implemented in the Tecnomatix® Plant Simulation model, capturing perishable inventory aging, finite buffer capacity, oven availability, and demand-driven retail depletion. It provides a concise analytical foundation linking the discrete-event model to the study’s sustainability objectives.
where WR represents the food waste rate, expressed as the percentage of total produced items that expire during the simulation horizon.
The mathematical formulation above defines the operational relationships implemented in the simulation. The production-capacity equation determines the maximum feasible production according to oven availability, available productive time, baking time, and batch size. The production and shipment constraints ensure that the quantity distributed to retailers does not exceed available production, while the retailer-capacity constraint prevents inventory from exceeding the specified buffer capacity. The inventory-aging and FIFO equations govern the daily progression and sale of products according to their age, and products remaining beyond the specified three-day shelf life are recorded as expired units. These relationships are evaluated dynamically within Tecnomatix® Plant Simulation during each replication as products are produced, transferred, stored, sold, aged, and removed upon expiration.
To demonstrate the quantitative application of the performance measures, the baseline configuration can be used as an illustrative calculation. Across the 10 simulation replications, mean production was 11,522.2 units, and mean expired products were 1867.9 units. Accordingly, the food waste rate was calculated as:
under the manufacturer-only configuration, mean production was 11,532.8 units, and mean expired products were 1857.3 units. Accordingly:
for the retailer-only configuration, mean production increased to 13,055.7 units, and mean expired products decreased to 417.9 units, resulting in:
finally, the combined configuration resulted in a mean production of 13,062.8 units, and mean expired products of 411.3 units:
these calculations demonstrate substantial differences in the effectiveness of the interventions. Relative to the baseline, the manufacturer-only intervention reduced the food waste rate by only 0.10%, from 16.21% to 16.11%, indicating a limited effect. In contrast, the retailer-only intervention reduced the waste rate by 13.01%, to 3.20%. The combined configuration achieved the lowest waste rate of 3.15%, representing a reduction of 13.06% relative to the baseline. However, its additional improvement over the retailer-only configuration was only 0.05%. These results indicate that the retailer-level intervention accounted for the majority of the observed waste reduction, while the manufacturer-level adjustment provided only a modest additional contribution when implemented jointly. The complete replication-level outputs underlying these calculations are reported in Table A1, while the corresponding means, standard deviations, and 95% confidence intervals are presented and discussed in Section Results and Discussion.
Scenario-Based Analysis for Operational ImprovementsFour model configurations were evaluated: the baseline configuration and three intervention scenarios. The baseline represents the initial operating conditions of the simulated bakery supply chain, while the intervention scenarios modify manufacturer-level operations, retailer-level operations, or both simultaneously. The operational changes defining each configuration are described below. Performance outcomes are reported separately in Section Results and Discussion based on 10 simulation replications for each configuration. The following sub-sections detail each scenario:
Scenario 1: Improvements at the Manufacturer Level OnlyIn this scenario, a minor but impactful change was introduced: the ovens assigned to Cake Vanilla and Cupcake Chocolate were swapped. Specifically, Oven 1 (originally at 80% availability and linked to Mixing Machine 1 for Cake Vanilla) was exchanged with Oven 4 (previously at 95% availability and linked to Mixing Machine 4 for Cupcake Chocolate). The mixing machine assignments remained unchanged, but the higher-efficiency Oven 4 now bakes Cake Vanilla batter, while the lower-efficiency Oven 1 bakes Cupcake Chocolate. This strategic reassignment was designed to improve production capacity for Cake Vanilla, which had been limited by its connection to the lowest-performing oven.
Cake Vanilla production is reassigned to Oven 4 (95% availability), relieving the mixing machine bottleneck and marginally increasing throughput. The production flow is smoother, with shorter queues at the mixer.
Figure 2 illustrates the updated simulation model configuration, which reflects the reallocation of oven resources. The figure presents the first replication of this scenario for illustration, while the results reported in Section Results and Discussionare based on all 10 simulation replications.
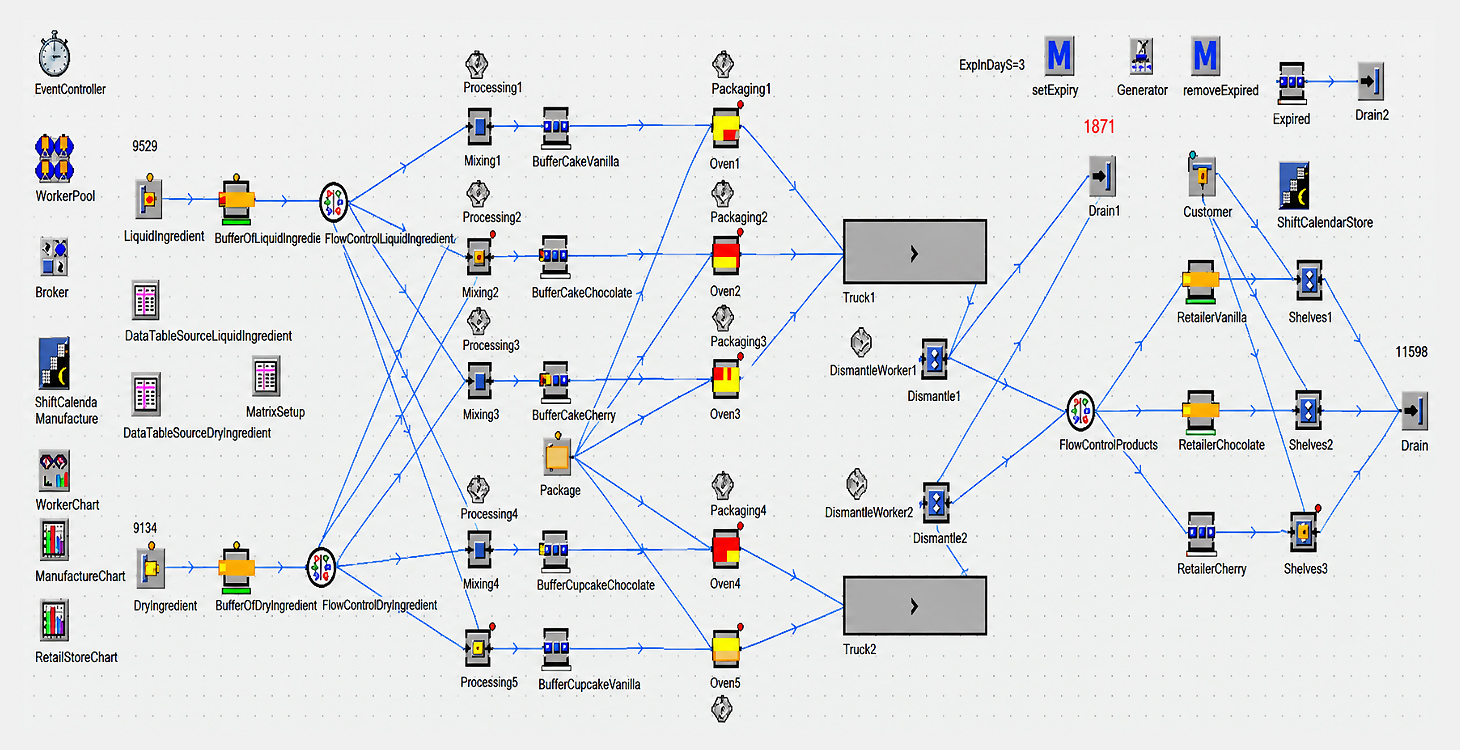 Figure 2.
Overview of the Bakery Supply Chain Simulation Model in Tecnomatix® Under Improvements at the Manufacturer Level Only.
In this scenario, a targeted change was made to the retailers’ weekday operating hours. To improve customer access and purchasing opportunities, the simulation extended weekday store hours by one additional hour, from 08:00–10:00 to 08:00–11:00, while weekend hours remained unchanged at 08:00–12:00. This extension aimed to allow more customers to access products before expiration, thus reducing the likelihood of unsold, expired goods and enhancing overall supply chain responsiveness.
Extended weekday store hours (08:00–11:00) significantly reduce expired products by aligning customer access with product availability. Production remains unchanged from Scenario 1, but retail turnover improves dramatically. As shown in Figure 3, the retailer’s operating schedule was extended to increase consumer access. The figure presents the first replication of this scenario for illustration, while the results reported in Section Results and Discussion are based on all 10 simulation replications.
Scenario 3: Integrated Improvements Across Manufacturer and RetailersIn the final scenario, the improvements applied at both the manufacturer and retailer levels were implemented together to assess the combined effects of coordinated interventions across the supply chain. Specifically, this scenario included:
The oven reassignment at the manufacturer level, where Oven 1 (80% availability) and Oven 4 (95% availability) were swapped. In addition, an extension of weekday retailer operating hours from 08:00–10:00 to 08:00–11:00. The goal was to evaluate whether the combined interventions would result in better performance than when applied independently.
Combining manufacturer and retailer interventions results in the lowest waste (379 units) and highest production (13,191 units). The visual highlights both the oven reassignment and extended store hours as complementary actions.
Figure 4 illustrates the integrated simulation environment where both manufacturing and retail adjustments were applied concurrently. The figure presents the first replication of this scenario for illustration, while the results reported in Section Results and Discussion are based on all 10 simulation replications.
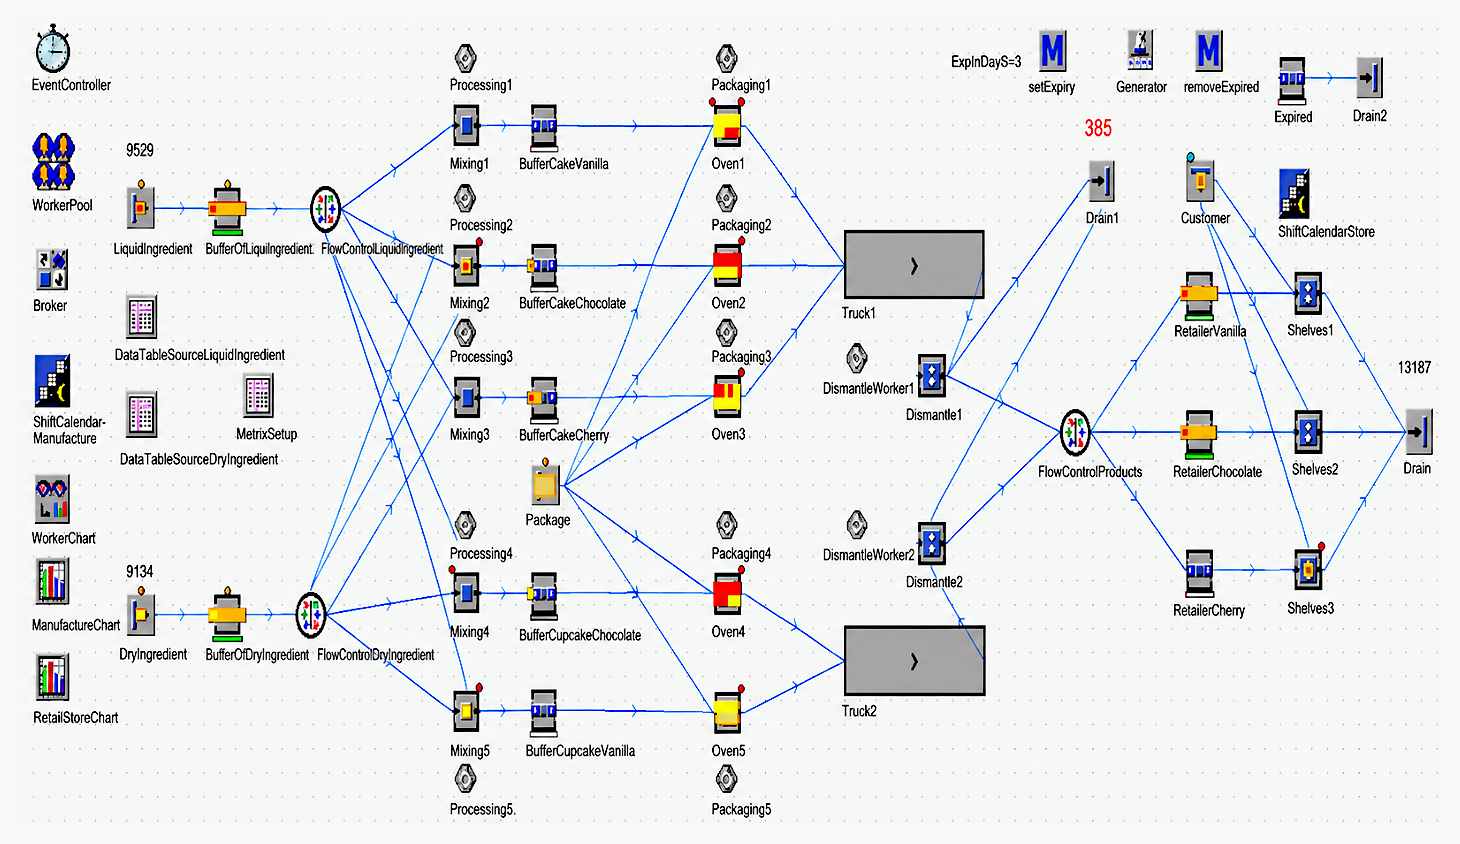 Figure 3. Overview of the Bakery Supply Chain Simulation Model in Tecnomatix® Under Improvements at the Retailers’ Level Only.
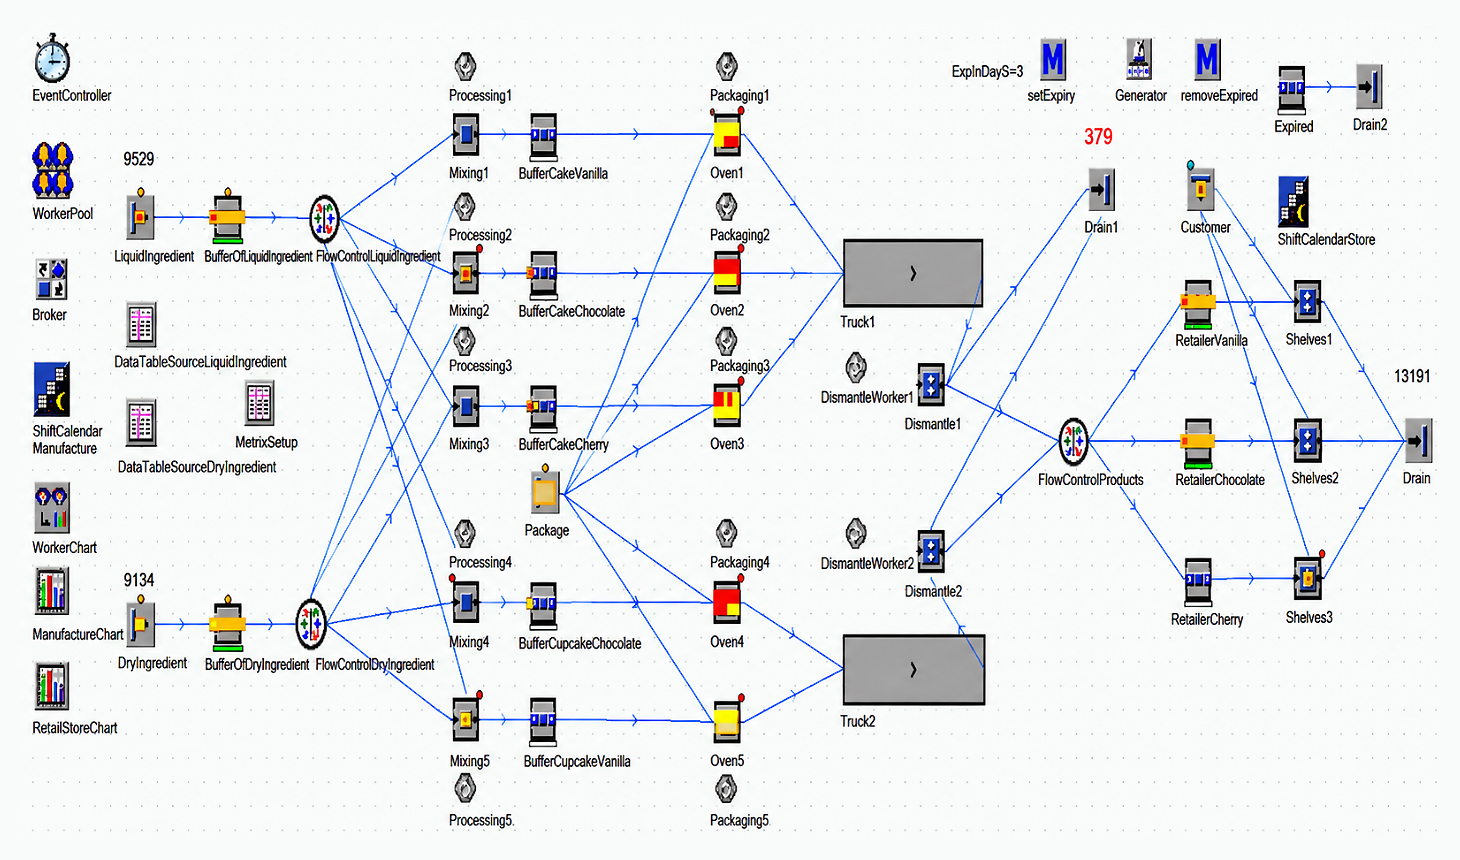 Figure 4.
Overview of the Bakery Supply Chain Simulation Model in Tecnomatix® Under Improvements at the Manufacturer and Retailers Levels.
This section presents the results of the simulation model developed using Tecnomatix® Plant Simulation to evaluate waste reduction and production efficiency in a two-echelon bakery supply chain. The model was tested under three scenarios: one focusing on improvements at the manufacturer level, another at the retailer level, and a third combining both. The goal was to understand how isolated and coordinated interventions influence the performance of perishable food supply chains, specifically for cakes and cupcakes.
Baseline Scenario PerformanceAcross the 10 simulation replications, Table 7 shows that the baseline configuration produced an average of 11,522.2 units (SD = 49.0; 95% CI: 11,487.1–11,557.3), while an average of 1867.9 units expired (SD = 82.7; 95% CI: 1808.8–1927.0). The corresponding mean food waste rate was 16.21%. These results establish the reference condition against which the three intervention scenarios are evaluated. This high percentage of waste indicates inefficiencies either in the production-distribution alignment or in consumer access to the products. Since the products have a short shelf life of only three days, even minor mismatches between production timing and customer demand can lead to significant losses.
This scenario serves as a control case for evaluating the effectiveness of operational improvements in subsequent scenarios. It also demonstrates the value of simulation as a diagnostic tool for identifying bottlenecks and points of waste accumulation that might otherwise go unnoticed in real operations.
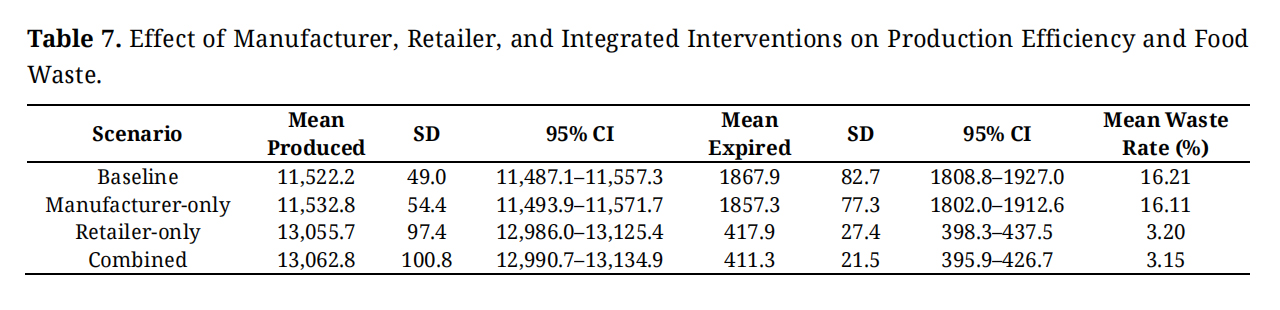 Table 7.
Effect of Manufacturer, Retailer, and Integrated Interventions on Production Efficiency and Food Waste.
The manufacturer-level intervention involved reassigning Cake Vanilla, previously baked in Oven 1 with 80% availability, to Oven 4, which had a higher availability rate of 95%, while Oven 1 was reassigned to Cupcake Chocolate. As illustrated in Figure 2, this modification was designed to improve resource allocation and production flow. Table 7 shows that across the 10 simulation replications, the intervention resulted in average production of 11,532.8 units (SD = 54.4; 95% CI: 11,493.9–11,571.7) and an average of 1857.3 expired units (SD = 77.3; 95% CI: 1802.0–1912.6), corresponding to a mean food waste rate of 16.11%. Compared with the baseline, average production increased by 10.6 units, while average expired products decreased by 10.6 units. The modest effect indicates that oven availability was not the primary system constraint; upstream mixing capacity and the fixed production schedule limited the extent to which the higher oven availability could translate into additional output. Nevertheless, the results indicate that targeted resource reallocation at the manufacturing level can contribute to improved throughput and reduced product expiration without requiring changes in demand or retailer operations.
Scenario 2: Retailer-Level ImprovementsThe retailer-only intervention generated a substantially larger improvement. Table 7 shows that across the 10 replications, average production reached 13,055.7 units (SD = 97.4; 95% CI: 12,986.0–13,125.4), while average expired products decreased to 417.9 units (SD = 27.4; 95% CI: 398.3–437.5). The corresponding mean food waste rate was 3.20%. Relative to the baseline, average production increased by 1533.5 units, while average expired products decreased by 1450.0 units. The increase in production is indirectly linked to the improved retail throughput: more customers were able to make purchases before the products expired, which signaled to the simulation logic that higher output was sustainable without increasing waste.
These results highlight the critical role that consumer access plays in the success of perishable supply chains. By extending store hours, the system improved product turnover rates, reduced stagnation in retail buffers, and minimized expired inventory. The intervention did not require additional equipment or labor at the manufacturing level, making it a highly cost-effective strategy. In practical terms, this suggests that retail-side policies can be as influential, if not more so, than production-side interventions in managing food waste.
Scenario 3: Integrated Manufacturer and Retailer ImprovementsThe final scenario combined the adjustments implemented in Scenarios 1 and 2, incorporating both the oven reassignment at the manufacturing level and the extension of retail store hours. The objective was to evaluate the overall performance of coordinated interventions across the two supply-chain levels compared with the baseline and individual interventions. The integrated configuration is presented in Figure 4, which combines the upstream production adjustment with the downstream retail improvement.
Table 7 shows that across the 10 simulation replications, the combined intervention achieved the best average overall performance, with mean production of 13,062.8 units (SD = 100.8; 95% CI: 12,990.7–13,134.9) and mean expired products of 411.3 units (SD = 21.5; 95% CI: 395.9–426.7). The corresponding mean food waste rate was 3.15%, the lowest among the four evaluated configurations. Relative to the baseline, average production increased by 1540.6 units, while average expired products decreased by 1456.6 units, demonstrating a substantial improvement in overall system performance.
The combined scenario also achieved higher average production and lower expiration than either intervention implemented individually. Compared with the retailer-only scenario, mean production increased by a further 7.1 units, while mean expired products decreased by an additional 6.6 units. Although these additional gains were relatively modest, they show that incorporating the manufacturer-level adjustment alongside the retailer-level intervention further improved the overall outcome. The findings therefore identify the combined scenario as the best-performing configuration, while also indicating that the majority of the performance improvement was driven by the retailer-level intervention.
Comparative Insights and Practical ImplicationsTo provide an overall comparison of the four model configurations, Table 7 summarizes the mean production, expired products, food waste rates, and associated variability across the 10 simulation replications.
As shown in Table 7, the interventions produced markedly different effects on overall system performance. The manufacturer-level intervention increased mean production from 11,522.2 to 11,532.8 units and reduced the mean food waste rate from 16.21% to 16.11%, demonstrating an improvement through the reallocation of existing production resources. A substantially greater improvement was observed under the retailer-level intervention, where mean production increased to 13,055.7 units, and the mean food waste rate declined to 3.20%. The combined intervention achieved the best overall average performance, with the highest mean production of 13,062.8 units and the lowest mean waste rate of 3.15%. Although its additional improvement over the retailer-only configuration was modest, the combined scenario demonstrates that integrating manufacturer- and retailer-level adjustments can provide further performance gains. Overall, the results identify retailer-level operating conditions as the primary driver of improvement while also demonstrating the value of coordinated decision-making across the two supply-chain stages. The complete replication-level results are provided in Table A1.
In percentage-point terms, the manufacturer-only intervention reduced the food waste rate by only 0.10% relative to the baseline. In comparison, the retailer-only and combined interventions reduced the waste rate by 13.01 and 13.06%, respectively. This comparison confirms that the retailer-level intervention was responsible for the majority of the observed waste reduction, while the manufacturer-level adjustment generated only a modest additional improvement in the combined configuration.
The findings emphasize several practical takeaways for bakery and similar perishable product supply chains. First, production-side adjustments, such as reassigning ovens or optimizing labor shifts, can help reduce bottlenecks, although their isolated effects may be modest. Second, retail operations, particularly store access hours, play a critical role in mitigating product expiration and maximizing throughput. Lastly, the greatest performance gains occur when supply chain stakeholders collaborate, aligning manufacturing schedules with retail access to create a more synchronized and responsive system. In addition to supporting sustainability goals, these interventions are replicable and low-cost, making them attractive for small and medium-sized enterprises (SMEs) in the bakery sector. The simulation-based approach provides a risk-free environment to test such improvements before real-world implementation, reducing operational uncertainty and enabling more confident decision-making.
It is important to note that this research is exploratory, aimed primarily at assessing potential sustainability improvements achievable through targeted operational changes rather than generating precise predictive outcomes. Consequently, the use of hypothetical data and the exclusion of transportation times represent limitations that should be considered when interpreting the results. Future empirical research should validate these findings using actual operational data, including detailed transportation logistics, to ensure robustness and applicability of simulation outcomes in real-world bakery contexts.
This research set out to examine how simulation modeling can be applied to improve sustainability in the bakery supply chain. The primary focus was on reducing food waste and increasing production output through adjustments at both the manufacturer and retailer levels. Using Tecnomatix® Plant Simulation software, the study developed a comprehensive two-echelon supply chain model involving one manufacturer and three retailers. The model integrated realistic assumptions regarding product flow, buffer capacities, labor shifts, machine availability, and shelf-life limitations for perishable baked goods.
The methodology was structured around three key scenarios. The first evaluated the impact of internal operational changes at the manufacturer level, specifically reassigning ovens to better align availability with production demand. The second examined the effect of retail-side changes, where weekday store hours were extended to increase customer access. The third scenario implemented both sets of changes concurrently to assess the effects of coordinated decision-making across the supply chain.
Results based on 10 simulation replications showed that the manufacturer-level adjustment produced a modest improvement, while the retailer-level intervention generated a substantially larger effect. Mean production increased from 11,522.2 units in the baseline to 11,532.8 units under the manufacturer-level intervention and 13,055.7 units under the retailer-level intervention, while the corresponding mean food waste rates were 16.21%, 16.11%, and 3.20%, respectively. The combined scenario achieved the best average overall performance, with mean production of 13,062.8 units and the lowest mean food waste rate of 3.15%. Although its additional improvement over the retailer-only scenario was modest, these results indicate that the retailer-level intervention was the primary driver of performance improvement, while the manufacturer-level adjustment provided only a limited additional contribution in the combined configuration. The contribution of this study lies in its detailed two-echelon simulation setup, which enables manufacturer-level, retailer-level, and combined operational interventions to be evaluated within a unified framework. By embedding operational assumptions such as oven availability, labor shifts, and retail opening hours within one framework, the model demonstrates how small but coordinated cross-tier interventions can improve sustainability performance across the modeled supply chain.
These findings offer important practical implications. For practitioners, the findings indicate that operational interventions can have substantially different effects and that identifying the stage that most strongly constrains product turnover is important when selecting waste-reduction strategies. It also illustrates the value of simulation tools for decision-making, allowing stakeholders to model and evaluate improvements without disrupting real-world operations. From an academic perspective, the research contributes to the growing body of literature on perishable supply chain management and simulation-based optimization. It underscores the importance of multi-echelon coordination and offers a replicable modeling framework that future researchers can adapt to other food sectors or operational contexts.
The study has several limitations that should be acknowledged. It relies on fixed production rates, simplified product lines, and assumed operational parameters, including mixing and baking times, rather than empirical data. Transportation time was not modeled, and consumer behavior was represented using a simplified stochastic arrival assumption that did not capture promotions, seasonality, or other sources of real-world demand variation. These modeling choices were made to ensure clarity and control within the simulation environment, but they inevitably limit the direct applicability of the findings to actual bakery operations. Future research should focus on incorporating more realistic and dynamic elements into the simulation, such as fluctuating consumer demand, variable ingredient supply, and transportation delays, as well as integrating empirical data collected from operational bakery environments. Such enhancements would improve the external validity of the results and support the development of more robust, data-driven strategies for bakery supply chain optimization. Additionally, extending the model to evaluate environmental indicators, such as energy use or carbon emissions, and leveraging AI-driven forecasting tools could further strengthen its practical relevance.
In conclusion, this study demonstrates how simulation modeling can provide valuable insights into food-waste reduction and supply chain efficiency. The findings show that the retailer-level intervention was the primary driver of improvement in the modeled system, while the manufacturer-level adjustment produced only a modest effect. Although the combined configuration achieved the best average overall performance, its additional improvement over the retailer-only configuration was small. The proposed simulation framework provides a practical basis for evaluating targeted operational decisions and supporting more efficient and sustainable bakery supply chains.
The simulation parameters and raw replication outputs supporting the findings of this study are provided in the manuscript and Table A1.
Conceptualization, HFZ, SS, and AR; data curation, HFZ and SS; methodology, HFZ and SS; formal analysis and discussion, HFZ; writing of original draft, HFZ and SS; reviewing and editing, HFZ and AR. All authors have approved the final manuscript.
The authors declare that they have no conflicts of interest.
This research received no external funding.
Appendix A. Simulation Results Across Random-Number Variants
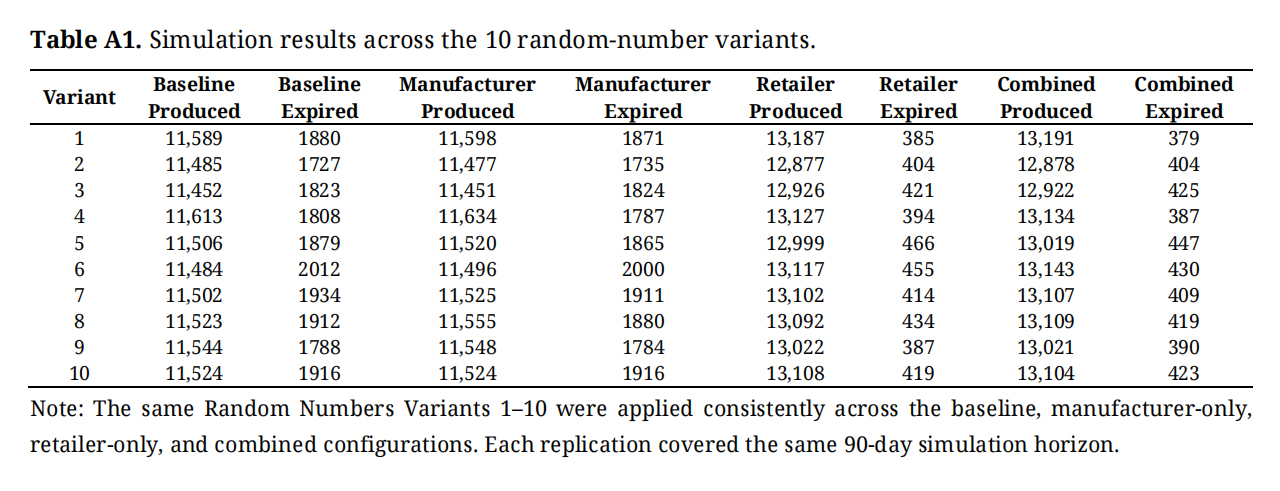 Table A1.
Simulation results across the 10 random-number variants.
1.
2.
3.
4.
5.
6.
7.
8.
9.
10.
11.
12.
13.
14.
15.
16.
17.
18.
19.
20.
21.
22.
23.
24.
25.
26.
27.
28.
29.
30.
31.
32.
33.
34.
35.
36.
37.
38.
39.
40.
41.
42.
43.
Zaher HF, Rejeb A, Setyaningsih S. Exploring Food Waste Reduction in Sustainable Bakery Operations Using Simulation. J Sustain Res. 2026;8(4):e260086. https://doi.org/10.20900/jsr20260086.

Copyright © Hapres Co., Ltd. Privacy Policy | Terms and Conditions


