Location:Home >> Detail
Med One. 2016; 1(1): 5; https://doi.org/10.20900/mo.20160005
 ,
Pengchang Wu2
,
Pengchang Wu2
1 Department of Neurosurgery, the Second Xiangya Hospital of Central South University, Changsha, Hunan 410011, P.R. China
2 Department of Neurosurgery, Xianyang Central Hospital, Xianyang, Shaanxi 712000, P.R. China
*Corresponding Author: Jun Xiang.
Background: SOX2 gene expression is elevated in glioma cells, and closely correlates with a malignant phenotype. AKT is a crucial molecule in various tumor-signaling pathways. It can be activated by SOX2 and is involved in the progression, and ovarian cancer’s resistance to chemotherapy. This study investigated SOX2 and AKT interactions in malignant glioma.
Methods: Forty-two glioma and peritumoral tissue samples were collected for a Western blot evaluation of SOX2 and AKT protein expression. MTT and EdU incorporation assays detected cell proliferation in C6 glioma cells. A Transwell migration assay was used to analyze cell migration and invasion.
Results: SOX2 and AKT protein expression in glioma tissues was significantly elevated compared to adjacent tissues and there was a positive correlation between SOX2 and ATK protein levels. MTT and EdU assays showed that SOX2 overexpression-enhanced proliferation in C6 glioma cells, while, at the same time, interfering with AKT gene expression-inhibited cell proliferation. A Transwell migration assay showed that SOX2 overexpression increased, but interference with AKT gene expression inhibited migration/invasion in C6 glioma cells.
Conclusion: SOX2 and AKT proteins were express abundantly in glioma tumor tissues. SOX2 facilitates tumor growth, proliferation, migration, and invasion possibly by upregulating AKT gene expression.
Glioma is the most common intracranial tumor in humans. It is formed by mesenchymal, or solid, cells [1]. Glioma is more commonly found in men. An unclear boundary between tumor and normal brain tissue makes complete surgical removal of tumor tissue difficult and strongly affects patient survival. Glioma patients have an average survival of less than one year [2]. Recen molecular biology developments have provided new insights into biological markers and related gliomatous molecular regulatory mechanisms. Biomarkers for targeted therapy of early glioma diagnosis of glioma are not clinically available in 2016.
The SRY-related, high-mobile group box2 (SOX2) gene is an SOX gene family member. It can modulate pluripotency and the self-renewability of embryonic stem cells, thus playing a critical role in embryonic development [3]. Previous studies have reported high SOX2 gene expressions in multiple tumors, including breast cancer, gastric carcinoma, and colorectal cancer. There is a close relationship between the SOX2 gene and tumor pathogenesis and invasion [4-7]. A previous study reported elevated SOX2 expression in glioma cells, and a close correlation with tumor malignant phenotype [8]. AKT is an important molecule in various tumor-related signaling pathways. When activated AKT can phosphorylate downstream effector molecules, thus facilitating cell growth, proliferation, migration, and invasion [9]. A recent study of ovarian cancer cells identified an SOX2 involvement in promoting tumor progression; and, by activating AKT, chemo-resistance [10]. SOX2 and AKT interaction within glioma remains unknown.
This study investigated SOX2 and AKT gene expression in cryopreserved glioma tissues, along with their biological functions within glioma cells. It also seeks to reveal associations between these two genes and their involvement in the progression/development of glioma.
Glioma and peritumoral tissues were collected from 42 glioma patients (25 males and 17 females, median age = 54) at hospital beginning in January 2014 and ending in December 2014. No patient received chemo- or radio-therapy before surgery. All patients had complete clinical data and were diagnosed with glioma by pathologists. This study was approved by the ethical committee of hospital and a written informed consent form was obtained from all participants.
2.2 Cell cultureHuman glioma cell line C6 was obtained from the Cell Bank of Shanghai Institute, Chinese Academy of Sciences, Shanghai 200050, P.R.C. C6 cells were maintained in an RPMI 1640 medium containing 10 % fetal bovine serum (FBS) (Gibco, Waltham, MA 02451, US), 0.03 % L-glutamine and penicillin/streptomycin (100 000 U/L). Cells were cultured in a humidified chamber under 5 % CO2 at 37°C.
2.3 Cell transfection and siRNA interferenceOne day before transfection, 1 × 10⁵ cells were seeded into all wells of a 6 well-plate. Each well contained 2 mL of culture medium. A mixture of plasmid DNA, or siRNA (2.5 pmol), plus interference reagent (5 μL) with transfection reagent (2 μL each) was dissolved in 0.2 mL Opti-MEM medium and incubated for 20 min at room temperature. The culture medium was discarded and washing with 1 × PBS occurred. The transfection mixture was then added to cells cultured in 1.6 mL of complete medium and incubated for 48 hours to detect protein expression.
2.4 Protein extractionCryopreserved, lymph-node tissues were powdered in liquid nitrogen and homogenized in an NP-40 lysis buffer (50 mM Tris-HCl pH 7.4, 150 mM NaCl, 5 mM MgCl2. 0.2 % Nonidet P-40, 1 mg/mL Proteinase K) to extract protein from tissue. Cells were digested using trypsin and centrifuged at 1,000 rpm × 5 min to extract protein from cells. Cell pellets were washed with 1 × PBS and re-suspended in a cell lysis buffer. After brief sonication, cell and tissue lysates were incubated on ice for 1 hour, and centrifuged at 14,000 g for 20 min at 4°C. Supernatants were collected and protein concentration was measured. Extracted proteins were kept at -80°C.
2.5 Western blotRabbit anti-human SOX2 monoclonal antibody was purchased from Boaosen Biotech (Beijing 101102, China). Goat anti-human AKT monoclonal antibody was obtained from Santa Cruz (Dallas, Texas 75220, US). Proteins were separated on 10 % SDS-PAGE gel, and transferred to nitrocellulose membranes in order to perform Western blot assay. After blocking in a 1 × TBST buffer containing 5 % non-fat milk for 2 hours, membranes were incubated overnight at 4°C with a primary antibody (1:1 000) This was followed by incubation with either IRDye 800, or IRDye 680-labeled secondary antibody (1:10,000) for 1 hr at room temperature after washing with 1 × TBST. The membranes were observed under an Odyssey Infrared Imaging System.
2.6 RT-PCRThe total RNA was extracted from cells using RNAiso Plus reagent. Single-stranded cDNA was then synthesized via reverse transcription. Fluorescent quantitative PCR was used to amplify target genes: SOX2-Forward primer, 5’-TCGCA GCCTT CTGTC CATTA -3’; SOX2-Reverse primer, 5’-TGTTG TACAC CATCC GAACT GTA -3’; AKT-Forward primer, 5’-TGCCT GTCAC ATTTT CGCCT-3’; AKT-reverse primer, 5’- TCCCA ATGTT CACAA GCGGC -3’; Actin-forward primer, 5’- ATGGG GAAGG TGAAG GTCGG AGT-3’; and, Actin-Reverse primer, 5’- TGACA AGCTT CCCGT TCTCA GCC-3’.
PCR parameters were: 95°C pre-denaturation for 10 min, followed by 39 cycles at 95°C, 30 sec; 56°C, 20 sec; and, 72°C, 30 sec. β-actin was used as an internal reference. Relative expression level was determined by the 2 △△Ct method, in which △Ct (target gene) = Ct (target gene) – Ct (actin), △△Ct (target gene) = △Ct (target gene in treatment group) - △Ct (target gene in control group). A two-tailed, or unpaired, Student t-test was used to compare means between two groups. A p < 0.05 was considered statistically significant.
2.7 MTT assayCells were grown in 96-well plates. After treatment, an MTT reagent was added to each well (10 μL each). After 3~4 hours of incubation, the culture medium was removed and 0.1 mL DMSO was added. After vortexing for 5 min, absorbance (A) value was read at 570 nm in a microplate reader (BioRad model 450).
2.8 EdU incorporationCells were seeded into 96-well plates. After treatment for 48 hrs, an EdU solution was diluted in culture medium (1:1 000 for 50 μM) and added into each well for a 2-hr incubation. Cells were then washed in PBS twice and fixed in 4 % paraformaldehyde. After treating with 2 mg/mL glycine, 1 × Apollo dye (0.1 mL) was added and the cells were incubated in the dark for 30-min. Infiltration buffer (0.5 % Triton X-100 in PBS) was then added, and the cells were incubated for 10-min with 3 repeats. Next, the cells were incubated with 1 × Hoechst 33342 reagent (1:100 in deionized water) in the dark for 30-min. After washing the cells with 1 × PBS twice, images were taken under a confocal laser scanning microscope. The number of cells was calculated using Image J software.
2.9 Tranwell migration and invasion assayFibronectin (1:100 dilution in PBS) was applied on the backside of the Transwell chamber (Costar, US) and air dried for 3 hrs. Fifty μL of Matrigel (1:5 dilution in culture medium) was used for pre-coating the inner face of the filter chamber for 2 hrs at 37°C to perform the invasion assay. For the Transwell migration assay, the Transwell chamber was not coated with Matrigel. The cell suspension (1 × 10³ cells) was added to the upper chamber, while 0.6 mL of complete medium was added to the lower chamber. The cells were incubated in the Transwell chamber for 48 hrs at 37°C, 5 % CO2. Matrigel, and cells on the membrane, were then cleared. The chamber was fixed in 4 % paraformaldehyde and stained with crystal violet solution. Five fields were randomly selected under a microscope to calculate the number of cells.
2.10 Statistical analysisData were analyzed using SPSS22.0 software. Comparisons between groups were performed using student's t-test and Pearson’s correlation analysis. One way-analysis of variance (ANOVA) was used to compare means across groups. A p < 0.05 was considered statistically significant.
Western blot showed significantly-elevated SOX2 and AKT protein levels in glioma samples when compared to peritumoral tissues (Fig. 1A and 1B). Statistical analysis revealed a positive correlation between SOX2 and AKT protein levels (p < 0.05, Fig. 1C).
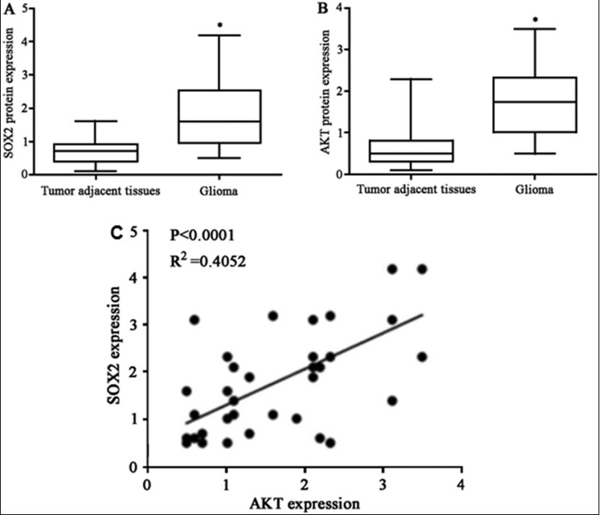 Fig.1 SOX2 and AKT protain level in glioma tissues.
SOX2 (A) and AKT (B) protein expression in glioma and . tumor adjacent tissues. *p < 0.05 vs. tumor adjacent tissues. (C) Correlation between SOX2 and AKT in glioma tissues.
SOX2 gene was over-expressed and interfered with in human glioma cell line C6 to further reveal any relationship between SOX2 and AKT and its potential mechanisms. Western blotting and RT-PCR revealed significant elevations in AKT mRNA and protein levels after SOX2 gene overexpression (Fig. 2A and 2C). SOX2 gene expression interference downregulated AKT expression (Fig. 2B and 2C).
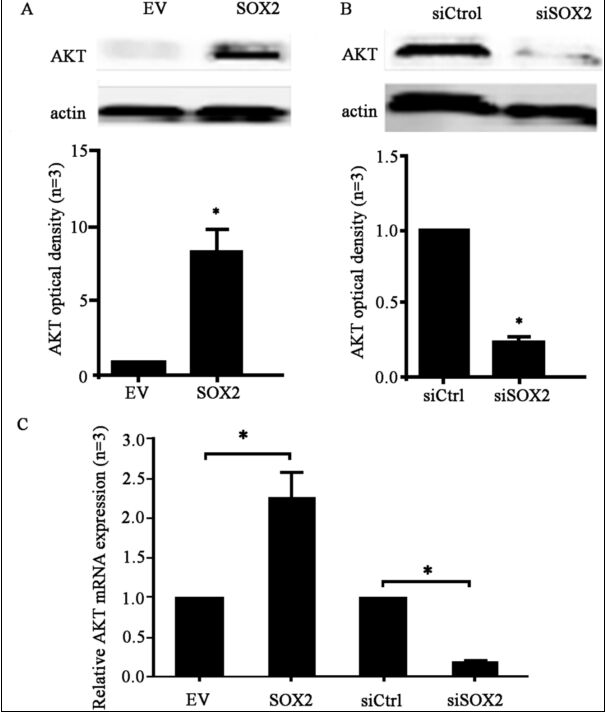 Fig. 2 AKT expression level in C6 cells after over-expressing or interfering SOX2 gene expression.
(A) AKT protein level after over-expressing SOX2 gene. (B) AKT protein level after interfering SOX2 gene expression. (C) AKT mRNA level after over-expressing and interfering SOX2 gene. EV: empty vehicle; siCtrl: control of small interference RNA. *p < 0.05 vs. controls (EV or siCtrl).
An MTT assay was used to detect glioma cell growth curves C6 (Fig. 3A). An EdU incorporation assay was used to determine cell proliferation ability (Fig. 3B and 3C). Results showed that SOX2 gene over-expression significantly elevated cell proliferation abilitities. Simultaneous SOX2 over-expression and AKT gene expression interference impaired cell proliferation capabilites compared to SOX2 over-expression alone.
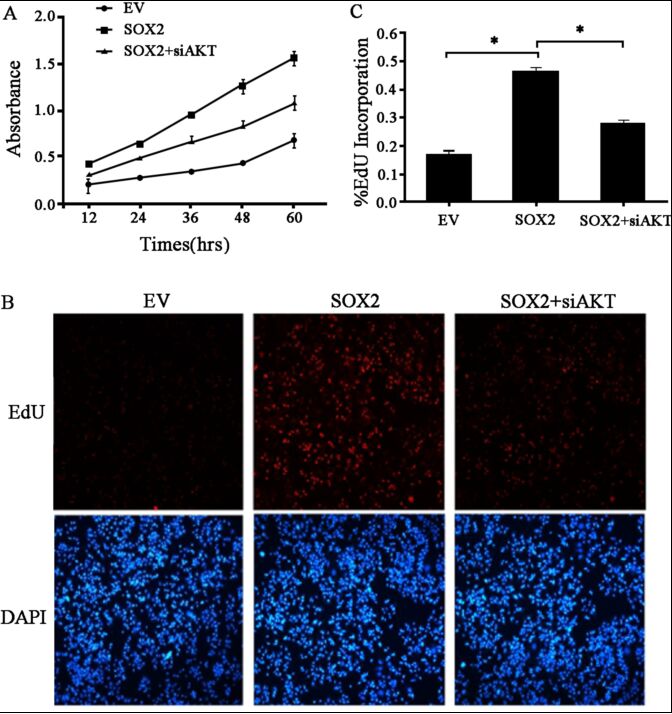 Fig. 3 Cell proliferation after over-expressing SOX2 gene and/or interfering AKT gene expression.
(A) MTT assay detected cell growth at different time points after over-expressing SOX2 gene or simultaneous over-expression of SOX2 gene and interfering AKT gene expression. (B) Representative images of EdU incorporation assay. Cells with over-expressing SOX2 gene or simultaneous over-expression of SOX2 gene and interfering of AKT gene expression. (C) EdU incorporation rate after over-expressing SOX2 or simultaneous over-expression of SOX2 gene and interfering AKT gene expression. *p < 0.05 vs. control.
A Transwell migration assay (without Matrigel) and an invasion assay (with Matrigel) were used to test SOX2 and AKT roles in cell migration and invasion, respectively. Results showed that SOX2 significantly enhanced C6 cell migration/invasion. Simultaneous SOX2 over-expression of SOX2 and AKT expression interference significantly inhibited cell migration/invasion in C6 cells (Fig. 4).
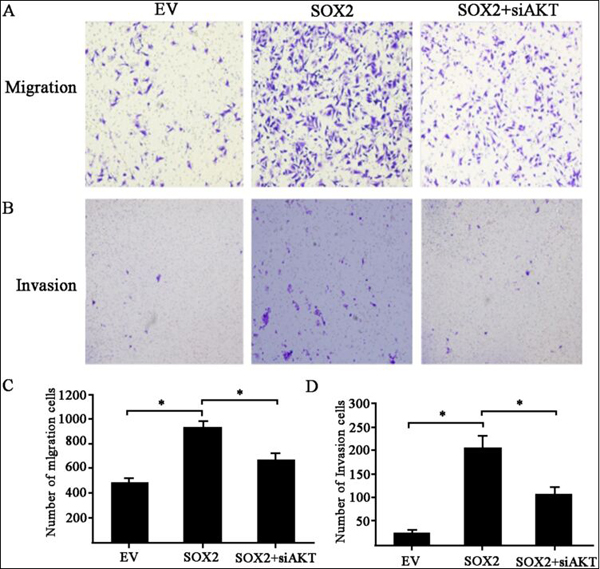 Fig. 4 C6 cell migration and invasion after overexpressing SOX2 or SOX2+siAKT treatment.
(A) and (C) Cell migration after SOX2 or SOX2+siAKT transfection (×100). (B) and (D) Cell invasion after SOX2 or SOX2+siAKT transfection (×100). *p < 0.05 vs. control (EV group).
The stem-cell transcription factor SOX2 is a critical factor in modulating embryonic development and maintaining cell pluripotency. It is closely associated with cell growth, proliferation, differentiation, and mobilization [11]. Previous studies have SOX2 gene involvement in the pathogenesis and progression of multiple tumors, including gastric carcinoma, breast cancer, colorectal carcinoma, and esophagus cancer [4-6, 12]. SOX2 over-expression has been demonstrated to facilitate cell growth, proliferation, migration, and metastasis potency in in vitro glioma cells [8]. Other in vitro and in vivo studies confirmed the correlation between the SOX2 gene; ectopic growth; and malignant glioma progression [13, 14]. Consistent with previous reports [8, 15], this study showed elevated SOX2 protein expression in glioma tissues compared to peritumoral tissues. The SOX2 regulatory mechanisms in pathogenesis, progression, and metastasis of glioma remains unknown.
AKT is a signal molecule involved in a number of signaling pathways in a variety of tumors, including glioma. AKT is commonly activated by PI3K and can phosphorylate downstream signal molecules involved in cell proliferation, differentiation, and apoptosis regulation [9]. A previous study identified a close relationship between AKT-related pathways and glioma pathogenesis [16]. Several in vitro studies have revealed a positive relationship between AKT levels and cellular potency for growth, proliferation, migration, and invasion in glioma cells [17-19]. This study showed that AKT protein level is elevated in glioma tissues compared to peritumoral tissues.
A recent study revealed that AKT is activated by SOX2 in ovarian cancer cells to facilitate tumor progression and chemo-resistance [10]. Whether AKT is also activated by SOX2 in glioma cells is unknown. This study first examined SOX2, and AKT, proteins levels in both glioma tissues and adjacent normal tissues. The results showed that both SOX2 and AKT protein levels were elevated in glioma tissues. Meanwhile, there is a close, positive correlation between SOX2 and AKT protein levels. Furthermore, this in vitro study in C6 glioma cells showed SOX2 gene overexpression or interference affected AKT mRNA and protein expression, and subsequently affected cell proliferation, migration, and invasion in C6 glioma cells. The findings suggest an SOX2 regulatory role in AKT gene expression in glioma cells. Whether the effects of SOX2 on the glioma malignancy is mediated by activating AKT needs further investigation.
In summary, SOX2, and AKT, proteins both abundantly express in glioma tissues. SOX2 regulates AKT gene expression involved in the growth, proliferation, migration, and invasion of glioma cells. This study provides evidence for SOX-2-AKT signaling in the occurrence, progression, invasion, and metastasis of glioma.
The authors declare that they have no conflict of interests.
1.
2.
3.
4.
5.
6.
7.
8.
9.
10.
11.
12.
13.
14.
15.
16.
17.
18.
19.
Xiang J, Wu P. SOX2 Regulates AKT Gene Expression Facilitating Glioma Malignancy. Med One. 2016; 1(1): 5; https://doi.org/10.20900/mo.20160005

Copyright © 2020 Hapres Co., Ltd. Privacy Policy | Terms and Conditions


