Location:Home>> Detail
Med One. 2016; 1(2): 1; https://doi.org/10.20900/mo.20160006
 ,
Dexiang Yang4 *
,
Dexiang Yang4 *
1 Tianjin Sanatorium, Tianjin 300191, P.R. China
2 Unit on Statistical Genomics, National Institute of Mental Health, NIH, Bethesda, MD 20852, USA
3 Elsevier Inc., Biology Prod Research, Rockville, MD 20852, USA
4 Respiratory Department, People's Hospital of Tongling, Tongling, Anhui 244000, P.R. China
*Corresponding Author: Dr. Yang, Department of Respiratory, the People's Hospital of Tongling, Anhui 244000, P.R. China. Email: drr11154@rjh.com.cn. or Dr. Cao, Elsevier Inc., Biology Prod Research, Rockville, MD 20852, USA.
Background: Approximately 8 % of all lung cancer is due to inherited factors. Risk more than doubles for those with relatives who have had lung cancer. To date, numerous genetic studies have found large number of genes that are related to lung cancer. Most of the studies focused on separate activities of genes that influence disease development.
Methods: Literature data mining (LDM) of over 17,884 articles for publications from 1978 to February 2016 was conducted. The articles reported multiple types of marker-disease associations between 1,925 genes and lung cancer. A gene set enrichment analysis (GSEA) and a sub-network enrichment analysis (SNEA) was performed to discover functional profiles and validate pathogenic significances of these genes to lung cancer. Finally, a network connectivity analysis (NCA) was performed to study associations between the reported genes.
Results: The reported genes demonstrate multiple types of association with lung cancer. Results from the enrichment analysis confirm the reports and suggest that these genes play significant roles in lung cancer pathogenesis, as well as in the pathogenesis of other lung cancer-related disorders. NCA results demonstrate that these genes, especially those with high RScores, present strong functional associations with each other.
Conclusion: The results suggest that lung cancer genetic causes are linked to a network composed of a large number of genes. LDM together with enrichment and network analysis could serve as an effective approach in finding these potential target genes.
Lung cancer is a malignant tumor, characterized by uncontrolled cell growth in lung tissues. Approximately 10-15 % of the cases occur in those who have never smoked [1]. These cases are often caused by a combination of genetic factors and exposure to radon gas, asbestos, second-hand smoke, or other forms of air pollution. It is estimated that inherited factors alone account for about 8 % of all lung cancer cases [2]. It is believed that the genetic causes are a combination of multiple genes and polymorphisms on chromosomes 5, 6, and 15, which are known to affect lung cancer risk [3].
Recently, there has been a number of articles reporting nearly 2,000 genes/proteins that relate to lung cancer. Many are suggested as disease biomarkers. Most these studied separate gene/protein activities. Based on how the gene-lung cancer relations were reported, these articles can generally be classified into the following categories: 1) biomarker; 2) clinical trial; 3) genetic change; 4) quantitative change; 5) regulation; and, 6) state change.
Biomarkers refer to proteins/genes that have been identified as either prognostic for, or diagnostic of, the disease. Relatively few articles have claimed that the genes investigated in their study could serve as disease biomarkers [4-9]. The observations have been inconsistent [10]. Groen et al. conclude ed that PTGS2 expression in patients with advanced non-small-cell lung cancer was neither a prognostic, or predictive, marker for treatment with celecoxib [11].
For a number of reasons, including expense and ethical issues, relatively few clinical trials have been conducted to study the relationships between these genes and lung cancer [12, 13]. Many studies, including independent studies and meta-analyses, have reported a genetic change in these genes in the case of lung cancer [14-22]. Mutation changes of these genes have demonstrated sub-group sensitivities [23-26]. Sasaki et al. showed that EGFR mutations were found in only 63 of 575 lung cancer patients [27]. This limits the use of these genes as biomarkers for diagnosis and treatment.
Quantitative change refers to changes in the abundance, activity, and/or, expression of a gene/protein in a disease state. Most reports for this type of relationship have come from gene expression studies, in which many genes were observed to demonstrate increased activity, gene and/or expression levels in lung cancer including: EGFR, CYP1A1, ALK, ROS1, ERBB2, MET, KEAP1, VEGF, PTGS2, TERT, and TP53 [28-36]. Some genes showed decreased activity, such as: GSTM1, GSTT1, ERCC1, and KRAS [37-39]. In a manner similar to to genetic changes, observed quantitative changes demonstrate case sensitivity among lung cancer patients [40, 41].
Regulation refers to changing the activity of the target by an unknown mechanism. This type of relationship is usually equivocal in describing the mechanism of the association [42-45]. Some of the studies suggested the mechanisms of the genes for lung cancer [46-49]. In addition, several revealed functional correlations between different genes and genetic factors [50, 51].
State change refers to changes in a protein/gene post-translational modification status, or alternative splicing events, associated with a disease. Only a few papers reported gene state changes in lung cancer cases [52, 53]. These studies reveal specific protein/gene state changes that may relate to lung cancer and are important for the understanding the disease mechanism.
No systematic analysis, to our knowledge, has evaluated the quality, and strength, of these reported genes as a single functional network/group in a study of the underlying biological processes of lung cancer. This study, rather than focusing on a specific marker, or function, attempts to provide a fuller view of the genetic-map related to lung cancer.
This study is structured as follows: 1) Literature data mining (LDM) to discover gene-lung cancer relations; 2) Enrichment analysis on the genes identified to validate their pathogenic significance to lung cancer; and, 3) Network connectivity analysis (NCA) to test the functional association between these reported genes.
2.1 Literature Data MiningA literature data mining (LDM) was performed for all articles available on the Pathway Studio database (www.pathwaystudio.com) until Februay 2016. This covers over 40 million scientific articles. It sought those that reported gene-lung cancer relations. It was conducted by employing a finely-tuned, Natural Language Processing (NLP) system of Pathway Studio software, which purports to be able to identify and extract relationship data from scientific literature. Only those publications containing a biological interaction defined by ResNet Exchange (RNEF) data format were included (http://www.gousinfo.com/AIC%20project/Pathway%20Studio/Elsevier%20RNEF-1.3.htm). Results are presented, including a complete gene name list, underlying article information, and the marker scores, which are described below.
2.2 Quality Metric AnalysisA quality metrics analysis was performed on all marker-disease relations. Analysis output includes quality score (QScore), citation score (CScore), novelty score (NScore), and report frequency score (RScore) at the article, as well as the marker level. These quality measures can be used to sort the marker list to obtain those with the most significance.
Using the RScore, the most frequently reported markers can be identified. At the article level, RScore = 1, indicates a marker-disease relation has been reported. If there is no reported relation then RScore = 0. At the marker level, the RScore is the sum of article level RScores, representing reported marker frequency.
Using the NScore, newly reported markers can be identified. Publication age is defined as the current year - publication year + 1. According to different publication age thresholds n, NScores are differentiated into NScore_n, where n (years) = 1, 2... ; at article level, NScore_n = 0 when the article publication age is older than n; otherwise NScore_n > 0. At the marker level, NScore_n = 0 means the marker-disease relation has been reported more than n years prior to the date of this article.
Using the CScore, marker-disease relations that are highly cited can be identified. An The article CScore is its number of citations. The marker level CScore of a relation is the sum of the total citations of all the articles supporting the relation.
The QScore is a composite index considering three factors of an article-reported relation: 1) the number of citations; 2) the publication age, and, 3) the RScore. The range of the QScore of an article is (0, 1), and is inversely related to publication age and positively related to its citation number. If an article is recently published with a high citation number, its QScore will be close to 1, and if the article is older with a low number of citations, its QScore approaches 0. The marker level QScore is the sum of the QScores of all the articles supporting the marker.
Both article, and marker, level scores are designed at the relation level to evaluate article/s significance to the relation. If multiple marker-disease relations have been reported by one article, the article will have scores for each of the relations.
2.3 Gene Set Enrichment AnalysisA gene set/pathway enrichment analysis (GSEA) and a sub-network enrichment analysis (SNEA) on five groups to better understand the underlying functional profile and validate the pathogenic significance of the reported genes. It included: 1) entire gene list (1,925 genes); and 2) 4-subgroups selected according to highest quality matrix scores (150 genes per group). Pathway Studio (www.pathwaystudio.com) performed a network connectivity analysis on subsets.
GSEA (also functional enrichment analysis) is a method for analyzing biological high-throughput experiments, which identifies classes of genes, or proteins, that are over-represented in a large set of genes, or proteins. These gene sets could be known-biochemical pathways, or otherwise functionally-related genes. The method uses statistical approaches to identify significantly enriched, or depleted, gene groups to retrieve a functional profile of the input gene set which should provide a better understanding of the underlying biological processes. With this method, one does not consider the perturbation of single genes but instead, entire (functionally-related) gene sets. This approach is more robust. Single gene falsely perturb more readily than entire pathways.
A sub-network enrichment analysis (SNEA) was performed which was implemented by Pathway Studio using master casual networks (database) containing more than 6.5 million relationships derived from more than 4 million full-text articles and 25 million PubMed abstracts. These networks are generated by a Natural Language Processing (NLP) text-mining system to extract relationship data from scientific literature. It is an alternative to the manual curation processes used by IPA (http://www.ingenuity.com/products/ipa). The ability to quickly update the terminologies and linguistics rules used by NLP systems purports to ensure that new terms are captured soon after entering regular use in the literature.
This extensive database of interaction data provides high levels of confidence when interpreting experimentally-derived genetic data against the background of previously published results. (http://help.pathwaystudio.com/fileadmin/standalone/pathway_studio/help_ps_10.0/index.html?analyze_experiment.htm)
In this study, an LDM was conducted on 17,884 articles that reported 1,925 genes associated with lung cancer. Using the reported category of gene-lung cancer relations, these 17,884 articles can generally be clustered into 6 different groups: 1) biomarker (0.62 %); 2) clinical trial (0.16 %); 3) genetic change (53.91 %); 4) quantitative change (22.51 %); 5) regulation (21.75 %); and, 6) state change (1.05 %).
The publication date distribution of these 17,884 articles appears in in Fig. 1, where it is shown that this study covers literature data from 1976 to 2016. The articles have an average publication age of only 6.2 years, indicating that most of the articles were published relatively recently. Publication age as defined as the current year - publication date + 1. Recently, especially after 2010, the number of publications has rapidly grown. The analysis shows that article publication date distributions underlying each of the 1,925 genes are similar to those in Fig. 1.
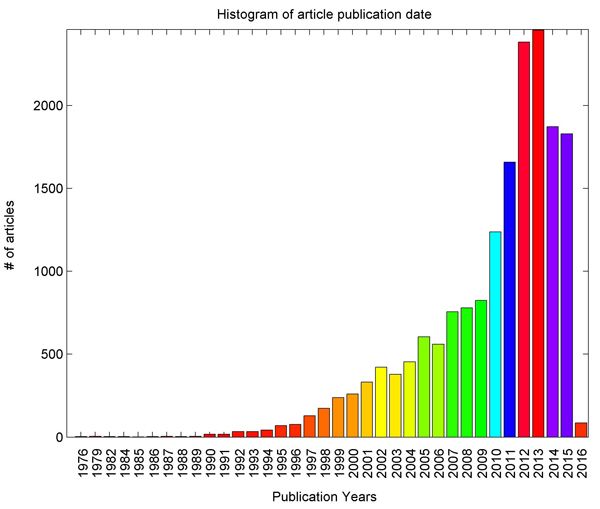 Fig. 1 Histogram of publications reporting marker-disease relationships between lung cancer and 1,925 genes
Fig. 2 shows the marker-wise score values for the 1,925 genes. The x-axis represents the index of markers ranked by QScore and the y-axis contains the CScore, QScores, NScore, and RScore normalized by their maximum values, respectively.
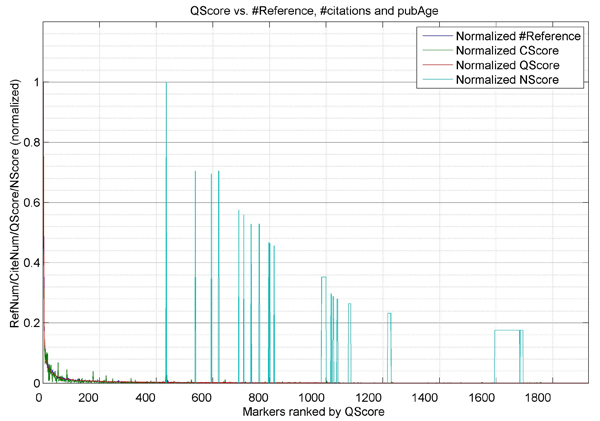 Fig. 2 Plot of CScore, QScore, NScore, and RScore.
Each measure was normalized using the corresponding maximum value. The NScore presented in this figure is NScore_2. NScore will be zero if the corresponding gene gets supports from published prior to 2014.
Using the 4 scores, some genes were identified as frequently reported with large numbers of articles to support them, such as EGFR (2,141 articles), KRAS (1,085 articles), and TP53 (1,003 articles). These genes have the highest RScore. Some genes recently reported since 2014 have a high NScore, such as MAPK8 (NScore_2: 5.7), MIR423 (NScore_2: 4.0), and SIRT2 (NScore_2: 4.0). These genes usually have fewer supporting articles which yields a low RScore (Supplementary Material 1). Genes with high report frequencies (RScore) do not necessarily have a higher number of citations (CScore). This may be caused by many factors such as the total number, and publication age, of underlying articles. The QScore was used to balance these factors.
Of these 1,925 genes, 150 were reported during 2015 and 2016, with an NScore_2 > 0 (Fig. 1). These 150 genes appear in Table 1. The full results are in Supplementary Material 1. For comparison purposes, in Table 1 the highest 150 RScore genes (most frequently reported) are shown. There are large overlap percentages among the top genes selected with the RScore, CSore, and QScore, (e.g., overlap > 75 % for the top 150 genes). Redundancy is reduced by presenting only the 150 highest CScore and QScore genes (Supplementary Material 1).
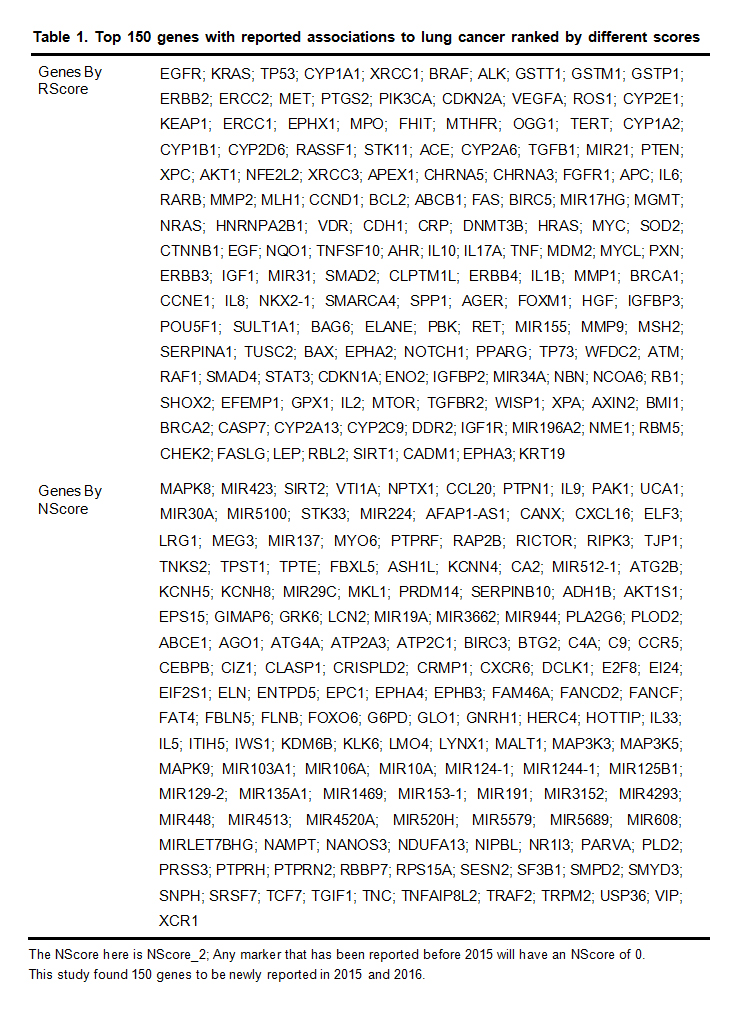 Table 1. Top 150 genes with reported associations to lung cancer ranked by different scores
The NScore here is NScore_2; Any marker that has been reported before 2015 will have an NScore of 0. This study found 150 genes to be newly reported in 2015 and 2016.
GSEA and SNEA results for 3 different groups are presented: all 1,925 genes, and the 2 gene groups listed in Table 1. The results for the top 150 genes with the highest CScores, and QScores, appear in Supplementary Material 2 and 3.
3.3.1 Enrichment Analysis on All 1,925 GenesThe entire list of 198 pathways/gene sets that were enriched with a p-value < 1.4E-015 appears in Supplementary Material 2. There were 114 pathways/gene sets enriched with p-values < 1E-20; 32 are enriched with p-values < 1E-40; and, 7 are enriched with p-values < 1E-70. In Table 2, the top 20 pathways/groups enriched by all the 1,925 genes, with p-values < 1e-047 appear.
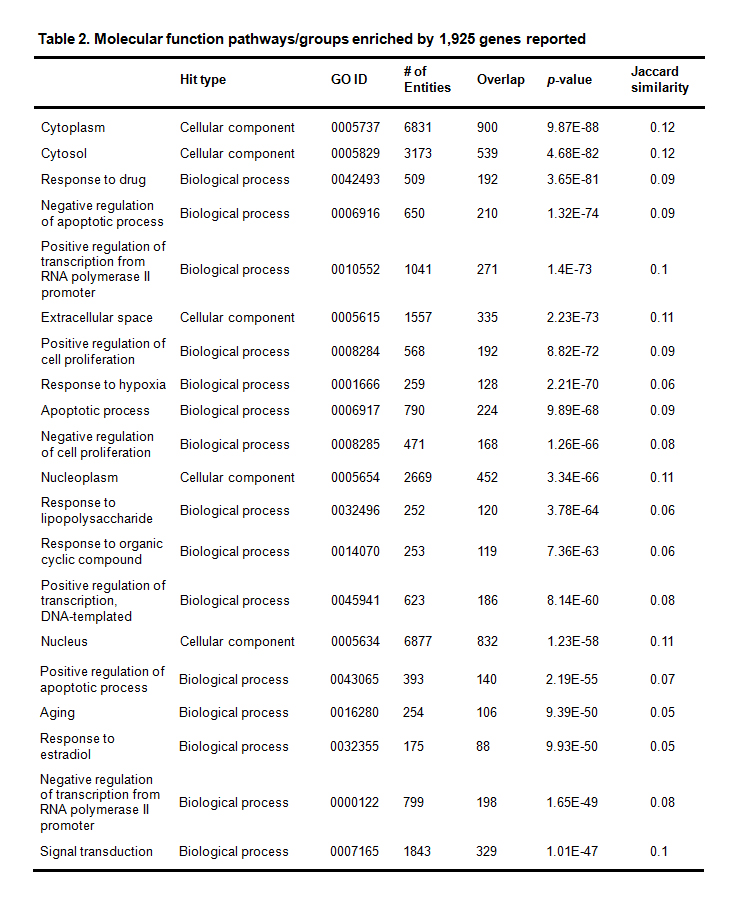 Table 2. Molecular function pathways/groups enriched by 1,925 genes reported
In these significantly enriched pathways, there were: 11 pathways/gene sets identified as relating to cell apoptosis; 15 identified as relating to cell growth and proliferation; 7 identified as relating to protein phosphorylation; 9 identified as relating to protein kinase; and one identified as relating to the immune system. All these pathways/gene sets are related to the cancer development. In addition: one pathway/gene set was identified as relating to aging; 5 pathways/gene sets were identified as relating to the neural system; and 5 pathways/gene sets were identified as relating to drug effects.
Cancer is a disease of cell/tissue growth regulation failure. A normal cell transforming into a cancer cell indicates that the genes regulating cell growth and differentiation have been altered [54]. The GSEA performed for this study showed that 26 pathways/gene sets related to cell apoptosis, cell growth, and cell proliferation, and were significantly enriched with by the 1,925 genes reported.
Specifically, there were 11 pathways/gene sets related to cell apoptosis (p-value: [1.3e-074, 1e-016]): negative regulation of apoptotic process (GO: 0006916; p-value= 1.3e-074, overlap: 210); apoptotic process (GO: 0006917; p-value = 9.9e-068, overlap: 224); positive regulation of apoptotic process (GO: 0043065; p-value = 2.2e-055, overlap: 140); negative regulation of neuron apoptotic process (GO: 0043524; p-value = 8.4e-025, overlap: 59); intrinsic apoptotic signaling pathway (GO: 0008629; p-value = 3.9e-022, overlap: 35); positive regulation of neuron apoptotic process (GO: 0043525; p-value = 2.7e-021, overlap: 34); negative regulation of cysteine-type endopeptidase activity involved in apoptotic process (GO: 0001719; p-value=4.9e-020, overlap: 37); regulation of apoptotic process (GO: 0042981; p-value = 2.4e-019, overlap: 72); activation of cysteine-type endopeptidase activity involved in apoptotic process (GO: 0006919; p-value = 1.4e-018, overlap: 39); intrinsic apoptotic signaling pathway in response to DNA damage (GO: 0008630; p-value = 5.4e-018, overlap: 31); apoptotic signaling pathway (GO: 0097190; p-value = 1e-016, overlap: 43).
There were 11 pathways/gene sets related to cell apoptosis (p-value: [1.3e-074,1e-016]): (1) negative regulation of apoptotic process (GO: 0006916; p-value = 1.3e-074, overlap: 210); (2) poptotic process (GO: 0006917; p-value = 9.9e-068, overlap: 224); (3) positive regulation of apoptotic process (GO: 0043065; p-value = 2.2e-055, overlap: 140); (4) negative regulation of neuron apoptotic process (GO: 0043524; p-value = 8.4e-025, overlap: 59); (5) intrinsic apoptotic signaling pathway (GO: 0008629; p-value = 3.9e-022, overlap: 35); (6) positive regulation of neuron apoptotic process (GO: 0043525; p-value = 2.7e-021, overlap: 34); (7) negative regulation of cysteine-type endopeptidase activity involved in apoptotic process (GO: 0001719; p-value = 4.9e-020, overlap: 37); (8) regulation of apoptotic process (GO: 0042981; p-value=2.4e-019, overlap: 72); (9) activation of cysteine-type endopeptidase activity involved in apoptotic process (GO: 0006919; p-value = 1.4e-018, overlap: 39); (10) intrinsic apoptotic signaling pathway in response to DNA damage (GO: 0008630; p-value=5.4e-018, overlap: 31); and, and (11) apoptotic signaling pathway (GO: 0097190; p-value = 1e-016, overlap: 43).
In addition, there were 15 pathways/gene sets related to cell growth and proliferation (p-value: [8.8e-072,1e-015]): positive regulation of cell proliferation (GO: 0008284; p-value = 8.8e-072, overlap: 192); negative regulation of cell proliferation (GO: 0008285; p-value = 1.3e-066, overlap: 168); cell proliferation (GO: 0008283; p-value = 3.8e-044, overlap: 131); regulation of cell proliferation (GO: 0042127; p-value = 2.1e-041, overlap: 94); epidermal growth factor receptor signaling pathway (GO: 0007173; p-value = 6.8e-030, overlap: 73); positive regulation of smooth muscle cell proliferation (GO: 0048661; p-value = 4.2e-026, overlap: 40); fibroblast growth factor receptor signaling pathway (GO: 0008543; p-value = 1.7e-025, overlap: 61); vascular endothelial growth factor receptor signaling pathway (GO: 0048010; p-value = 3.6e-025, overlap: 49); negative regulation of cell growth (GO: 0030308; p-value = 1.5e-023, overlap: 54); transforming growth factor beta receptor signaling pathway (GO: 0007179; p-value = 4.1e-019, overlap: 49); positive regulation of fibroblast proliferation (GO: 0048146; p-value = 5.6e-018, overlap: 30); positive regulation of epithelial cell proliferation (GO: 0050679; p-value = 3.3e-017, overlap: 33); growth factor activity (GO: 0008083; p-value = 2.3e-016, overlap: 52); negative regulation of epithelial cell proliferation (GO: 0050680; p-value = 6.4e-016, overlap: 31); positive regulation of endothelial cell proliferation (GO: 0001938; p-value = 1e-015, overlap: 31). The immune system is another cancer-related factor [55]. This study identified one related gene set: the innate immune response (GO: 0045087; p-value = 1.9e-046, overlap: 192).
At the protein level, we identified 7 pathways/gene sets that were related to protein phosphorylation and 9 pathways/gene sets related to protein kinase: protein phosphorylation (GO: 0006468; p-value = 3.9e-045, overlap: 173); positive regulation of protein phosphorylation (GO: 0001934; p-value = 3.3e-032, overlap: 69); phosphorylation (GO: 0016310; p-value = 3.3e-030, overlap: 147); peptidyl-tyrosine phosphorylation (GO: 0018108; p-value = 3.4e-028, overlap: 60); protein autophosphorylation (GO: 0046777; p-value = 3.5e-027, overlap: 68); positive regulation of peptidyl-serine phosphorylation (GO: 0033138; p-value=8.8e-017, overlap: 33); positive regulation of peptidyl-tyrosine phosphorylation (GO: 0050731; p-value = 1.2e-016, overlap: 37); protein kinase binding (GO: 0019901; p-value=2.9e-037, overlap: 125); protein kinase activity (GO: 0050222; p-value = 9e-037, overlap: 142); positive regulation of protein kinase B signaling (GO: 0051897; p-value = 2.4e-032, overlap: 51); kinase activity (GO: 0016301; p-value = 1.5e-030, overlap: 150); protein tyrosine kinase activity (GO: 0004718; p-value = 8.7e-030, overlap: 59); transmembrane receptor protein tyrosine kinase activity (GO: 0004714; p-value = 4.1e-025, overlap: 36); transmembrane receptor protein tyrosine kinase signaling pathway (GO: 0007169; p-value = 8.6e-021, overlap: 48); positive regulation of I-kappaB kinase-NF-kappaB signaling (GO: 0043123; p-value = 2.9e-018, overlap: 52); positive regulation of MAP kinase activity (GO: 0043406; p-value = 6.2e-016, overlap: 29).
A protein kinase is a kinase enzyme that modifies other proteins by chemically adding phosphate groups to them (phosphorylation). Phosphorylation usually results in a functional change of the target protein (substrate) by changing enzyme activity, cellular location, or the association with other proteins.
Deregulated kinase activity is a frequent cause of cancer, and medications to inhibit specific kinases are being developed for cancer treatment [56].
Five enriched pathways/gene sets are related to neural system (p-value: [1e-047, 5.1e-016]) and another 5 to drug response (p-value: [3.7e-081,2e-031]). A single gene set related to aging (GO: 0016280), which was also significantly enriched (p-value = 9.4e-050, overlap: 106). Although these pathways/gene sets may directly relate to lung cancer, enrichment helps to understand any underlying biological processes of the disease to the benefit of treatement and medication development. More significantly enriched pathways appear in Supplementary Material 2.
Pathway Studio was used to perform a SNEA to identify pathogenic significances of the reported genes to other disorders may relate to lung cancer. The complete list of results appear in Supplementary Material 3. Table 3 is the disease-related, sub-networks enriched with a p-value < 1E-323.
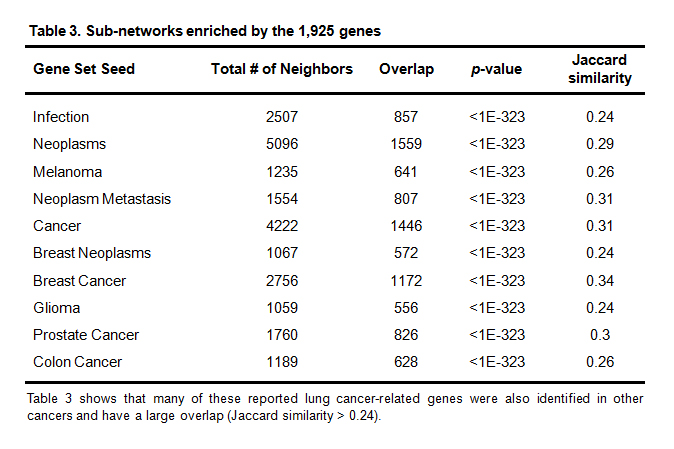 Table 3. Sub-networks enriched by the 1,925 genes
Table 3 shows that many of these reported lung cancer-related genes were also identified in other cancers and have a large overlap (Jaccard similarity > 0.24).
QScore, CScore, and RScore are strongly related, while the NScore is not so strongly related. Here their differences, in terms of GSEA and SNEA results, are compared. Considering the similarity of the groups selected by QScore, CScore, RScore, only the results for the NScore group and the RScore group are provided (Table 4 and Table 5), and only the full results for QScore and CScore groups appear in Supplementary Material 2 and 3.
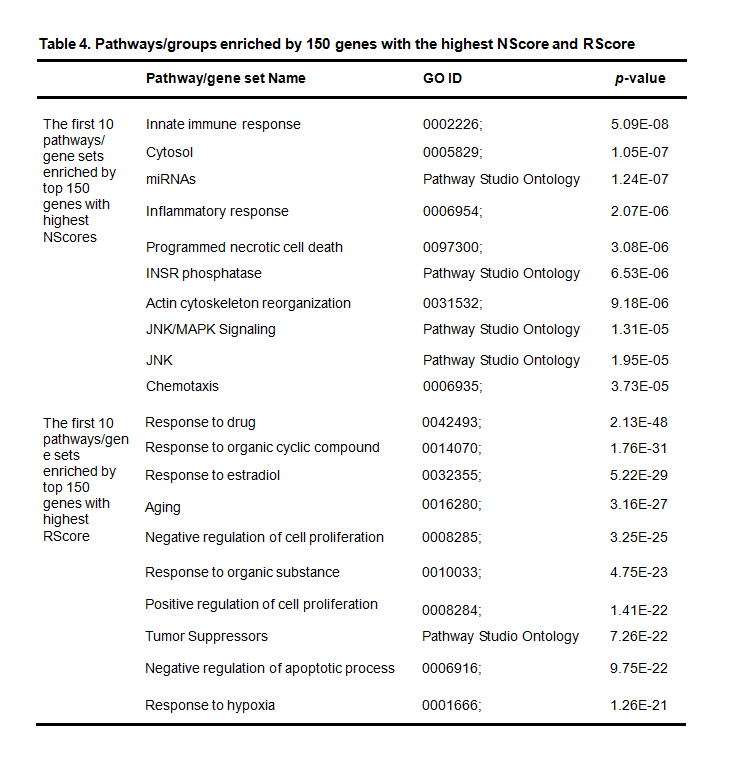 Table 4. Pathways/groups enriched by 150 genes with the highest NScore and RScore
NScore is used as NScore_2, a non-zero-value of which represents that the gene is reported in 2015 or 2016. One hundred and fifty genes are reported to have non-zero NScore_2 values. The genes with the top NScores and those with the top RScores enrich different groups of pathways, with different p-values (NScore group: 5.09E-08~3.73E-05; RScore group: 2.13E-48 ~ 1.26E-21), indicating that the recently-reported genes are functionally different from the frequently-reported ones (Table 4).
Eight out of the 10 pathways/gene sets enriched by the RScore group (Table 4) were also enriched by the overall 1,925 genes that rank in the top 20 (Table 2). Similarly, the cytosol group (GO: 0005829) was enriched by both overall genes and the NScore group, although with much weaker significance (4.68E-82 vs. 1.05E-07), indicating that many more genes with similar functions have already been discovered.
The SNEA analysis tested disease sub-networks that had been enriched by the two groups of genes. Complete results appear in Supplementary Material 3. Table 5 shows the top 10 disease related sub-networks enriched by the two groups of genes.
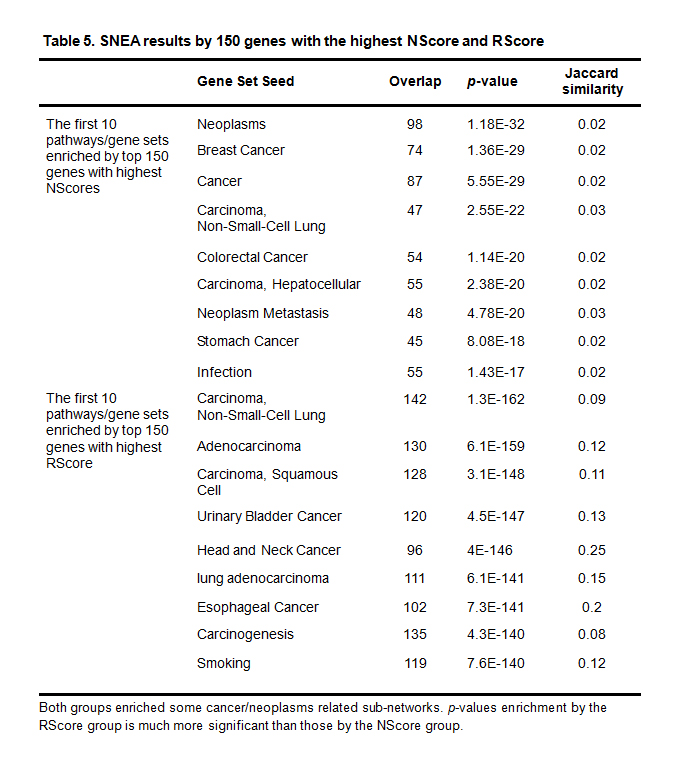 Table 5. SNEA results by 150 genes with the highest NScore and RScore
Both groups enriched some cancer/neoplasms related sub-networks. p-values enrichment by the RScore group is much more significant than those by the NScore group.
A network connectivity analysis (NCA) on the top 150 genes with the highest RScores and NScores (from Table 1) was performed to generate functional networks. Results show that for the RScore group, there are more than 5,000 relationships among those 150 genes, all having many literature supports. Fig. 3 (a) presents a network built using 20 genes, randomly selected from these 150 genes, where it can be seen that the genes are functionally connected to each other and form a complex network. In contrast, the 20 genes randomly selected from the 150-NScore group demonstrate only a few connections (Fig. 3 (b)). An NCA analysis shows only 290 relationships among the 98 genes for the whole 150-NScore group. This observation is consistent with GSEA and SNEA, suggesting that genes with a high NScore are not as functionally close to each other as those within the RScore group.
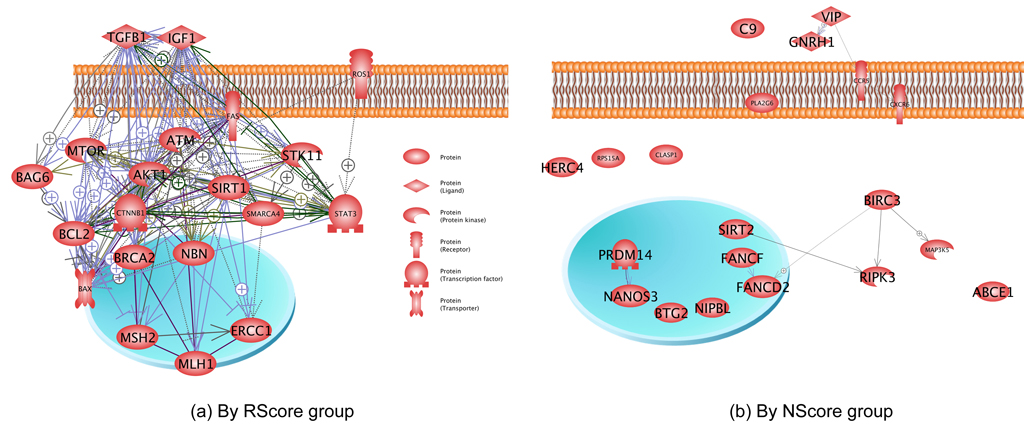 Fig. 3 Connectivity networks built using 20 genes from the different groups. Pathway Studio generates the networks.
The 20 genes were randomly selected from the 150 genes with highest RScores for (a) and NScores for (b), respectively.
In this study, an LDM was performed on 17,884 articles (1976 through February 2016) which reported 1,925 genes associated with lung cancer. Supplementary Materials 1 provides the entire gene list and related parameters. A GSEA and an SNEA was performed to study the functional profile and pathogenic significance of the genes to lung cancer. An NCA was done to study functional associations between the top genes ranked by different scores. This approach is different from genetic studies that use raw data to report novel discoveries. It is a literature-based summarization and validation of already reported marker-diseases relations. This study has several limitations. The literature data from the 17,884 articles studied were extracted from the Pathway Studio database. The Pathway Studio database is composed of over 40 million articles, it is still possible that some articles studying gene-lung cancer associations were not included.
Additionally, the 4 quality scores, RScore, NScore, CScore and QScore were proposed as quality measures of LDR identified marker-disease relations, feasible to rank the markers/relations according to different needs/significance.
However, although related to, they are not biological significance measures of the markers to the disease. Therefore, these measures cannot replace genetic statistical studies like GWAS, meta-analysis, and enrichment analysis.
As an automatic data mining approach, the Natural Language Processing (NLP) technique used for LDM is necessary and effective, when dealing with millions of articles. Any automatic LDM methods may produce false positives. This study is intended to lay groundwork for further studies. Towards this purpose, we provide, in Supplementary material 1, the detailed information for all 17,884 articles studied. This includes the sentences where a specific relation has been located.
The results from this up-to-date LDM reveal that these 1,925 genes have multiple types of associations with lung cancer. Enrichment analysis suggests that they play significant roles in lung cancer pathogenesis, as well as many other lung cancer-related disorder pathogeneses. NCA results demonstrate that these genes, especially high RScore genes, present strong functional associations with each other. The results suggest that these genes may operate as a functional biomarker network influencing lung cancer development.
Lung cancers are a complex diseases whose genetic causes are linked to a network composed of a large number of genes. LDM together with GSEA, SNEA, and NCA could serve as an effective approach for identifying these potential target genes.
The authors declare no conflict of interests.
1.
2.
3.
4.
5.
6.
7.
8.
9.
10.
11.
12.
13.
14.
15.
16.
17.
18.
19.
20.
21.
22.
23.
24.
25.
26.
27.
28.
29.
30.
31.
32.
33.
34.
35.
36.
37.
38.
39.
40.
41.
42.
43.
44.
45.
46.
47.
48.
49.
50.
51.
52.
53.
54.
55.
56.
Dong X, Ritter M, Cao H, Yang D. Literature Data Mining Based Enrichment Analysis on 1,925 Genes for Lung Cancer. Med One. 2016; 1(2): 1; https://doi.org/10.20900/mo.20160006

Copyright © 2020 Hapres Co., Ltd. Privacy Policy | Terms and Conditions


