Location:Home >> Detail
Med One. 2016; 1(3): 1; https://doi.org/10.20900/mo.20160010

1 Department of BME, Tianjin University, Tianjin 300072, P.R. China
2 Department of Biomedical Engineering, Tulane University, New Orleans, LA 70118, USA
3 Elsevier Inc., 5635 Fishers Ln, Rockville, MD 20852, USA
4 American Informatics Consultant LLC, Rockville, MD 20852, USA
*Corresponding Author: Lydia C Manor, Senior Bioinformatics Scientist, American Informatics Consultant LLC, Rockville, MD 20852, USA.
Background: Renal cancer (RC) originates in the cells of the kidneys. Worldwide, approximately 208,500 new cases of renal cancer are diagnosed annually. This accounts for just under 2 % of all cancers. Those with a family history of RC have an increased risk of developing the disease. Recent research has identified hundreds of genes which may relate to its development. No study has systematically summarized these findings or provided an objective view of the genes reportedly associated with RC.
Methods: Literature data mining (LDM) was performed on more than 1,100 articles for publications between 1988 and April 2016 in which 423 genes were reported to be RC-associated. A gene set enrichment analysis (GSEA) and a sub-network enrichment analysis (SNEA) were performed to study the functional profile and pathogenic significance of these genes. A network connectivity analysis (NCA) to study the associations between the reported genes was done. Literature, and enrichment metrics, analyses were used to identify genes with specific RC significance.
Results: Multiple RC associations for 329 of the 423 genes enriched 100 pathways (p < 1.2e-10) were demonstrated. Ten genes (IL6, VEGFA, HIF1A, EGFR, PTEN, TP53, FGF2, CTNNB1, HMOX1, and BRCA1) were identified as having the most significant association with RC in terms of both functional diversity and replication frequency. Three novel genes, CD274, NOTCH1, and CREB1, were found to play roles within many significant RC-related pathways, warranting their further study. SNEA, and, NCA results indicated that many of these genes work as a functional network that plays roles in the RC-related disorder pathogeneses.
Conclusion: The results suggest that the genetic causes of RC are linked to a genetic network composed of a large number of genes. The gene lists, together with the literature, and enrichment, metrics provided by this study, may serve a basis for further biological and genetic studies in the field.
Renal cancer (RC), also called kidney cancer, is a type of cancer that originates in kidney cells. Renal cell carcinoma (RCC) and transitional cell carcinoma (TCC) are the two most common types of RC. Their names identify the types of cells from which they develop. The lifetime risk of RC is approximately 1.6 % for both men and women [1]. The rate of new cases of kidney, and renal pelvis, cancer is 0.016 %, and about 3.9 out of 100,000 men and women die of RC annually [1]. Cancers confined to the kidney have a five-year survival rate of 92 %. However, if the cancer has spread to surrounding lymph nodes, survival rate is 65 %. If it has metastasized, the survival rate is 12 % [1]. The highest rates were recorded in North America and the lowest rates in Asia and Africa [2].
Known risk factors include cigarette smoking, obesity, the regular use of NSAIDs, and hypertension [3]. Genetic variations, and their interactions with environmental exposures, are believed to influence RC risk, but studies of candidate gene approaches have produced no conclusive results [4]. Recently an increased number of articles have reported hundreds of genes and proteins which are related to RC. Many were suggested as potential disease biomarkers, such as VEGFA, IL6, and MIR34A [5-7]. Some genes, such as, IL2, have been studied in clinical trials [8].
Some studies report genetic, and quantitative, changes of genes for RC [9, 10]. Increased, and decreased, gene expression levels and activities have been observed [10, 11]. Many genes were reported to influence RC pathogenic development via unknown mechanisms [12]. Some studies suggest that functional mechanism linked to RC. Datta et al. found, by exploring the effects of calcineurin inhibitors (CNI) on the expression, and function, of CXCR3 splice variants, that CNI may mediate human RC progression by downregulating CXCR3-B and by promoting proliferative signals, probably via CXCR3-A [13].
No systematic analysis has evaluated the quality, and strength, of these reported genes as a functional network, or group in a study of RC’s underlying biological processes. This study attempts to provide a more encompassing view of the genetic-map through comprehensive literature data mining (LDM), accompanied by gene set enrichment analysis (GSEA) and a sub-network enrichment analysis (SNEA) which examines the underlying functional profiles of the genes identified [14]. We hypothesize that a majority, if not all, of the previously reported genes play roles in RC development, and that the major pathways, or gene sets enriched by these genes, are candidate pathways through which these genes influence RC pathogenesis.
The study structure is as follows: 1) LDM to discover gene-MDD relations; 2) Enrichment analysis of the identified genes to study their pathogenic significance for RC. 3) Literature and enrichment metrics analysis to identify genes with specific significance. 4) NCA to test functional associations between the reported genes.
2.1 Literature data mining and article selection criterionAn LDM was performed on all articles available in the Pathway Studio database (www. pathwaystudio.com) up to April 2016, covering more than 40 million scientific articles. It sought those reporting a gene-RC relationship. The LDM was conducted using a finely-tuned Natural Language Processing (NLP) system of Pathway Studio software, which has the capability of identifying, and extracting, relationship data from scientific literature. Only publications containing a biological gene-RC interaction as defined by the ResNet Exchange (RNEF) data format were included (http://www.gousinfo.com/).
2.2 Literature metrics analysisTwo scores for each gene-disease relationship are proposed for the literature metrics analysis.
A reference number underlying a gene-disease relationship as the gene's reference score(RScore) is defined in Eq. (1).
RScore = n (1)
where n is the total number of references supporting a gene-disease relation.
The gene’s age score is defined as the earliest publication date of a gene-disease relationship (AScore) in Eq. (2).
AScore = max(1≤i≤n) Article Pub Agei (2)
where n is the total number of references supporting a gene-disease relation, and
Article Pub Age = Current date - Publication date + 1 (3)
2.3 Enrichment metric analysisAssuming that a disease is associated with genetic pathways, the gene-wise enrichment score (EScore) for the gene within a gene set is defined in Eq. (4).
EScorek = ∑m (i=1) (-log10 pValuei) / max(1< i< n) (-log10 pValuei) (4)
where pValuei is the enrichment score of the ith pathway with the gene set; m ∈ R is the number of pathways including the kth gene; we define m as the PScore for the gene:
PScorek = The number of pathways from R including the kth gene (5)
The PScore presents how many of the disease-related pathways are associated with the genes. The EScore shows pathway significance.
2.4 Enrichment analysisA GSEA and a sub-network enrichment analysis (SNEA) was performed on 3 groups in order to better understand the underlying functional profiles and the pathogenic significance of the reported genes: 1) The entire gene list (423 genes); 2) 2-subgroups selected using the highest quality matrix scores. A network connectivity analysis (NCA), using a Pathway Studio network building module, was conducted.
An LDM of 1,100 articles reporting 423 genes associated with RC was conducted. Using the reported category of gene-RC relations, 7 different classes are observed: 1) biomarkers (4.91 %); 2) cell expression (1.64 %); 3) clinical trials (1.82 %); 4) genetic changes (42.64 %); 5) quantitative changes (18.36 %); 6) regulation (29.55 %); and, 7) state changes (1.09 %).
Of the 423 genes, 9.93 % presented biomarker relationships to the disease, 3.55 % with cell expression, 2.60 % with clinical trials; 33.10 % with genetic changes; 35.70 % with quantitative changes; 39.24 % with regulation; and 2.60 % with state changes. It should be noted that, for a candidate gene, there may be more than one article reporting a relationship with RC. One gene may have multiple relations. A single relationship to the disease is reported for (79.20 %) of the genes, whilst 20.80 % of the genes are reported to have multiple relationships: 16.08 % have 2 types of relationships; 3.55 % have 3; and, 1.18 % have 4 (Fig. 1).
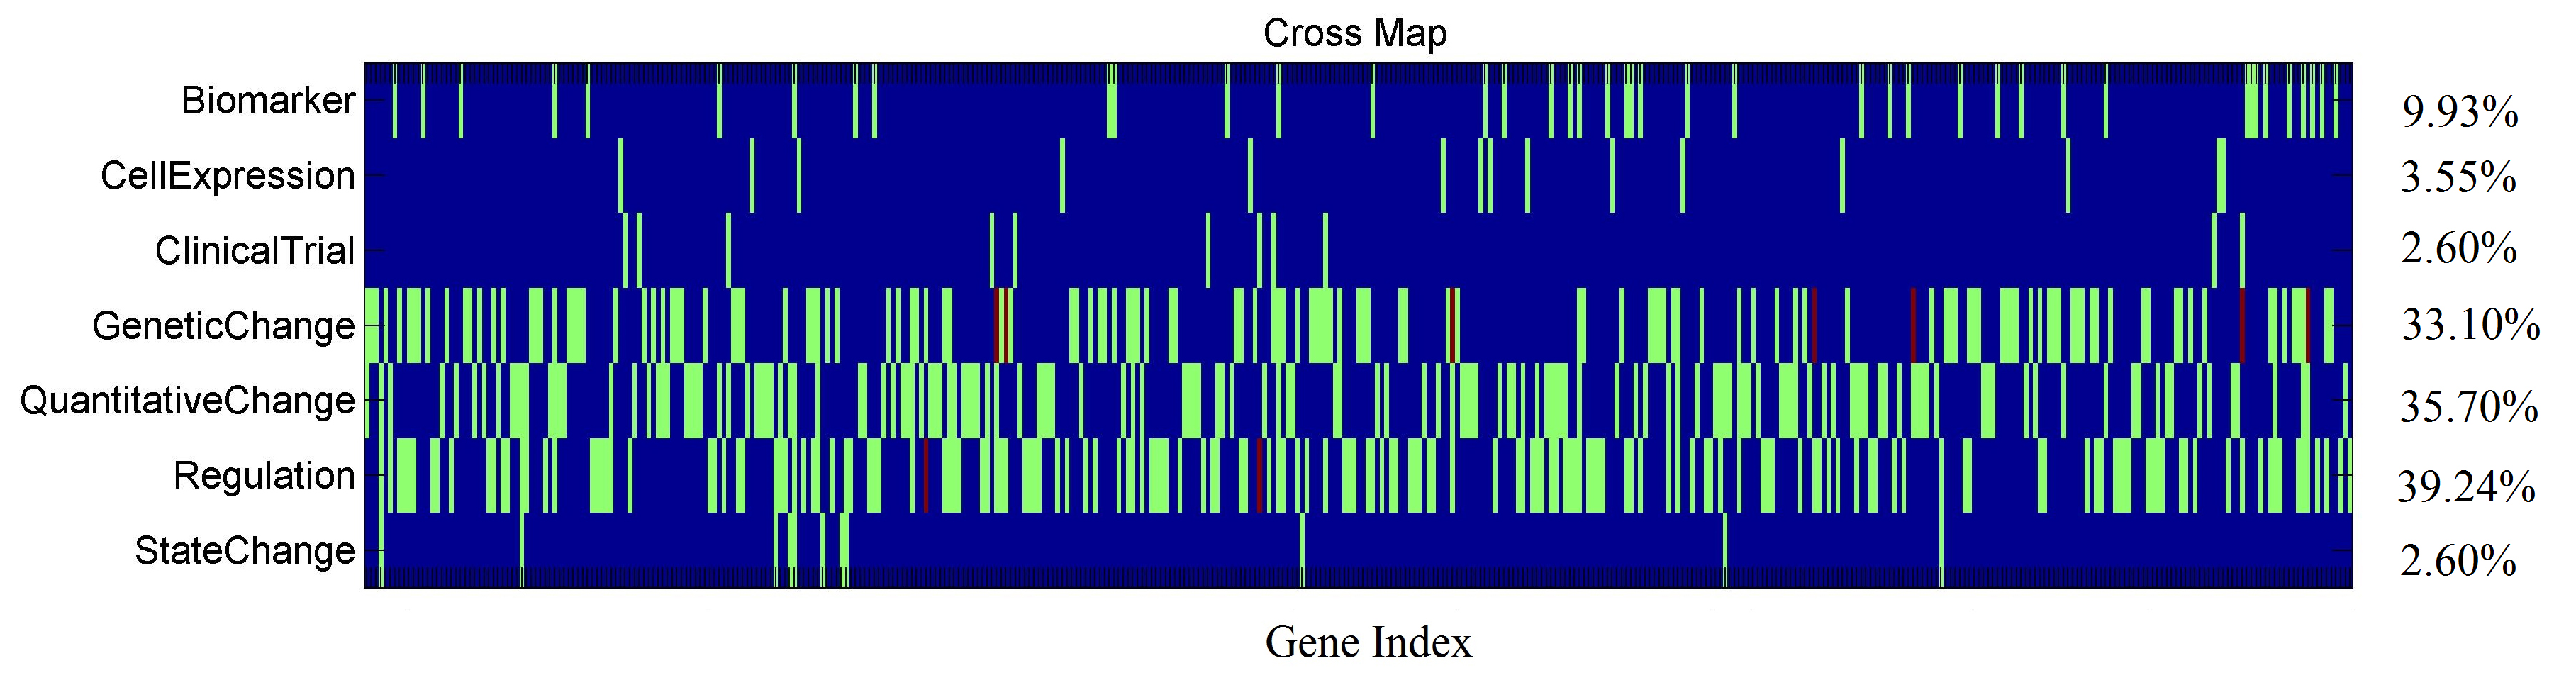 Fig. 1 Gene-wise relation type distribution of 423 genes
The publication date distribution of the 1,100 articles appears in Fig. 2 (a). This study covers literature data for the years 1988-2016 for novel genes reported in each year (Fig. 2 (b)). The articles have an average publication age of 5.8 years, indicating recent publication. Especially since 2010, more publications have been available showing discoveries of more novel genes (Fig.2 (b)). The analysis showed that publication date distributions of the articles underlying each of the 423 genes are similar to those in Fig. 2
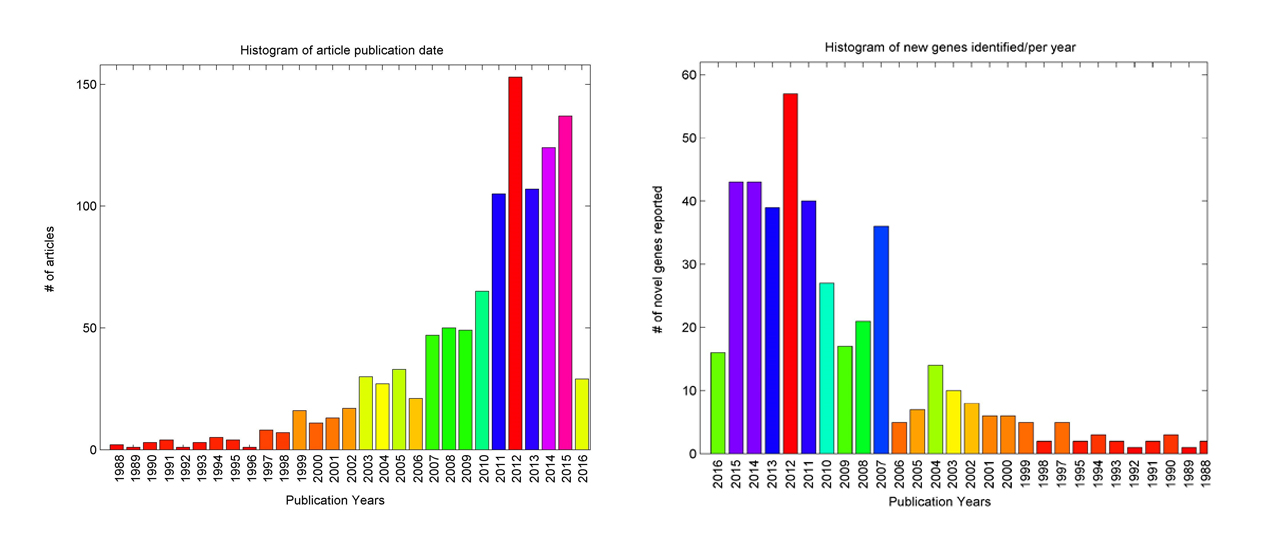 Fig. 2 Histogram of publications reporting gene-disease relationships between RC and 423 genes.
(a) article publication date; (b) number of novel genes identified each year.
Using two literature metric scores, genes were identified which were reported to have support from large numbers of articles, such as FH (72 articles), VHL (42 articles), and IL2 (39 articles). In approximately the last year, some genes have been reported such as FOXO4, HIST1H2APS4, and INPP5K.
Of the 423 genes, 16 were reported in 2016 and appear in Table 1. Full results appear in Supplementary Material 1. Table 1 lists, in descending order, the top 16 genes as ranked by highest RScore.
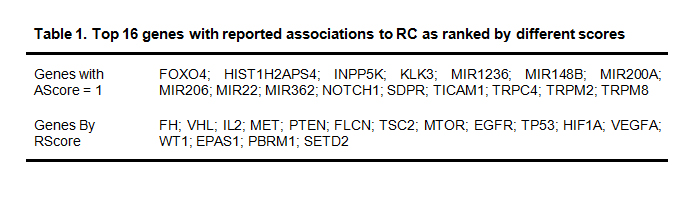 Table 1. Top 16 genes with reported associations to RC as ranked by different scores
This section presents the GSEA and SNEA results for 3 different groups: All 423 genes, and both gene groups in Table 1.
3.3.1 Enrichment Analysis on all 423 genesThe entire list of 100 pathways, or gene sets enriched with p-value < 1.2e-10 (329/423 genes), appears in Supplementary Material 2. The 20 pathways enriched with p-values < 1e-20 (with 272/423 genes) are in Table 2.
Of the 100 enriched pathways or gene sets: 17 were related to cell growth and proliferation (183/423); 7 to cell apoptosis (148/423); 4 to transcription factors (110/423); 2 to protein phosphorylation (44/423); and 1 to protein kinase (31/423). The Jaccard similarity scores presented in Table 2 compare the similarity, and diversity, of sample sets, as defined by Eq. (6).
 (6)
(6)
Where, A and B are two sample sets.
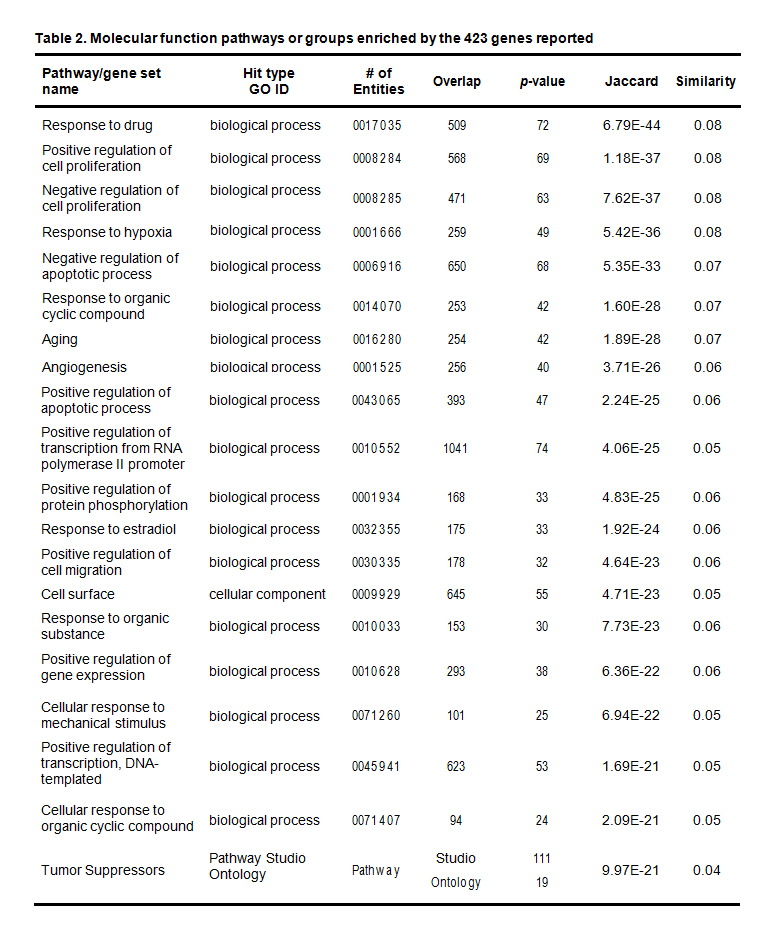 Table 2. Molecular function pathways or groups enriched by the 423 genes reported
There were 5 additional pathways/gene sets related to cell apoptosis (p-value: [1.1e-019,1.2e-010] and 2 additional pathways/gene sets related to transcription factors: regulation of apoptotic process (GO: 0042981, p-value = 1.1e-019, overlap: 35); apoptotic process (GO: 0008632, p-value = 1.2e-019, overlap: 57); activation of cysteine-type endopeptidase activity involved in apoptotic process (GO: 0006919, p-value = 1e-012, overlap: 17); negative regulation of neuron apoptotic process (GO: 0043524, p-value = 7e-011, overlap: 19); apoptotic signaling pathway (GO: 0097190, p-value = 1.2e-010, overlap: 17); negative regulation of transcription from the RNA polymerase II promoters (GO: 0000122, p-value = 2e-012, overlap: 46); regulation of transcription from the RNA polymerase II promoters in response to hypoxia (GO: 0061418, p-value = 1.8e-011, overlap: 10).
In addition to GSEA, a SNEA (http://pathwaystudio.gousinfo.com/SNEA.pdf) was performed using Pathway Studio for purposes of identifying any pathogenic significance of the reported genes to other disorders that are potentially related to RC. The results appear in Supplementary Material 3. In Table 3, disease-related sub-networks enriched with a p-value < 4.24E-167 are presented.
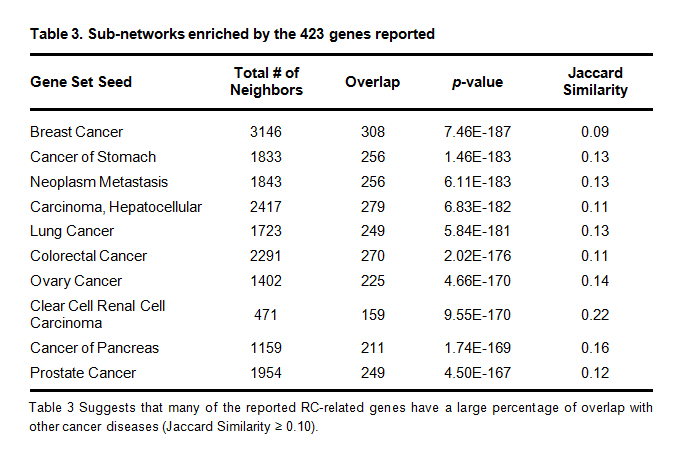 Table 3. Sub-networks enriched by the 423 genes reported
Table 3 Suggests that many of the reported RC-related genes have a large percentage of overlap with other cancer diseases (Jaccard Similarity ≥ 0.10).
The top 16 genes listed in Table 1 in terms of GSEA and SNEA results are compared. The top 10 pathways/sub-networks for the AScore group and the RScore group (Table 1) are presented in Tables 4 and 5. The entire report appears in Supplementary Materials 2 and 3.
Using the same enrichment p-value threshold (p < 6E-004), 23 pathways/gene sets were identified as enriched with the 16 genes with top AScores, while the number for the RScore group is 119. The entire list of these pathways/gene sets appears in Supplementary Material 2. Table 4 presents the top 10 pathways enriched with the 16 genes from AScore and RScore groups.
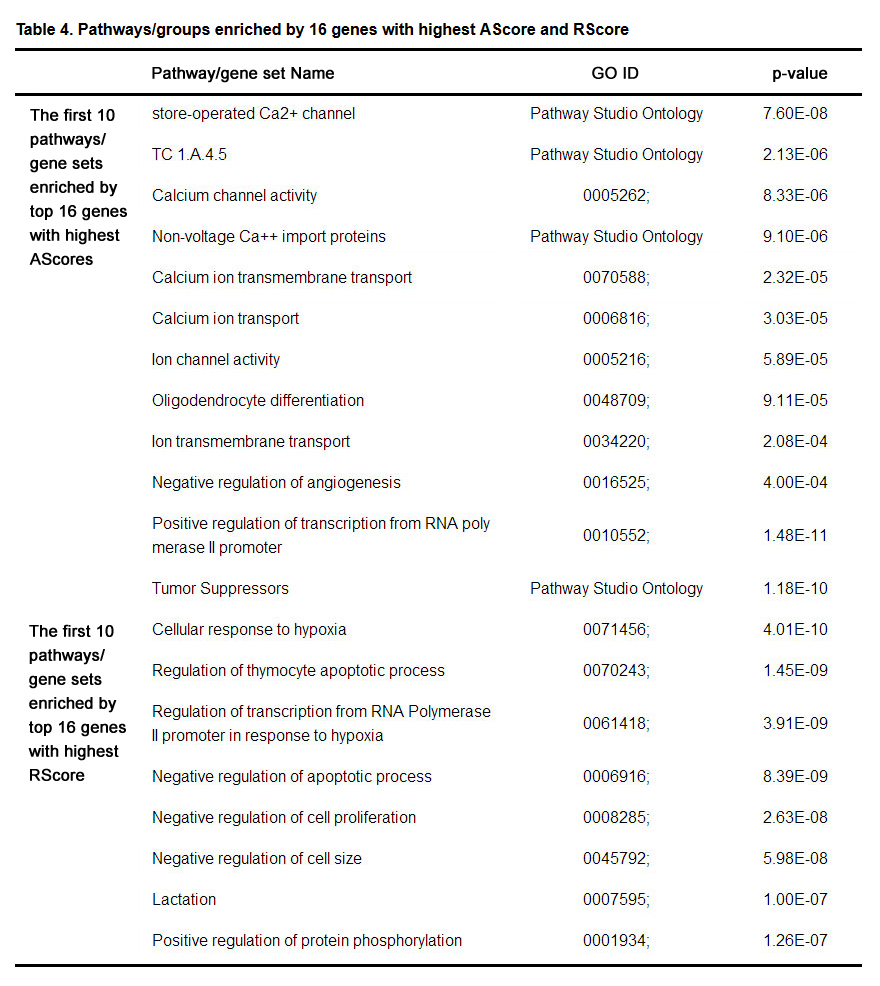 Table 4. Pathways/groups enriched by 16 genes with highest AScore and RScore
Table 4 suggests that genes with the top AScores, and those with the top RScores, enrich different groups of pathways with different p-values (AScore group: 7.60E-08~4.00E-04; RScore group:1.48E-11~1.26E-07), suggesting that these newly-reported genes are functionally different than from those that have been the most frequently reported.
An enrichment analysis against disease sub-networks was done for the SNEA analysis. The complete list of results appears in Supplementary Material 3. Table 5 presents the top 10 most significantly enriched disease related sub-networks as enriched by the top 16 genes from both the AScore, and RScore, groups.
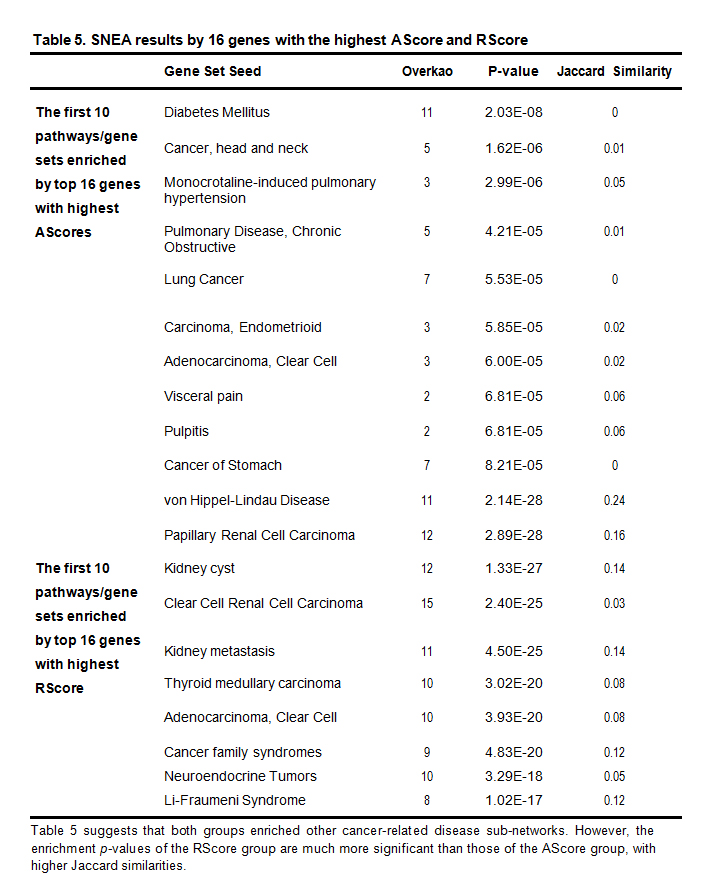 Table 5. SNEA results by 16 genes with the highest AScore and RScore
Table 5 suggests that both groups enriched other cancer-related disease sub-networks. However, the enrichment p-values of the RScore group are much more significant than those of the AScore group, with higher Jaccard similarities.
An NCA was performed on the top 16 genes with the highest RScores and AScores (Table 1) to generate gene-gene interaction networks. The RScore group results showed 104 connections among all 16 genes, with more than 300 instances of literature support. Genes within the AScore group showed only 6 relations among 7/16 genes, (Fig. 3 (b)). There were 9 genes that showed no direct relation with other genes in the group (Fig. 3 (b); highlighted in green). This is consistent with both the GSEA and the SNEA, suggesting that genes with the lowest AScores are not as functionally close to each other as those from the RScore group.
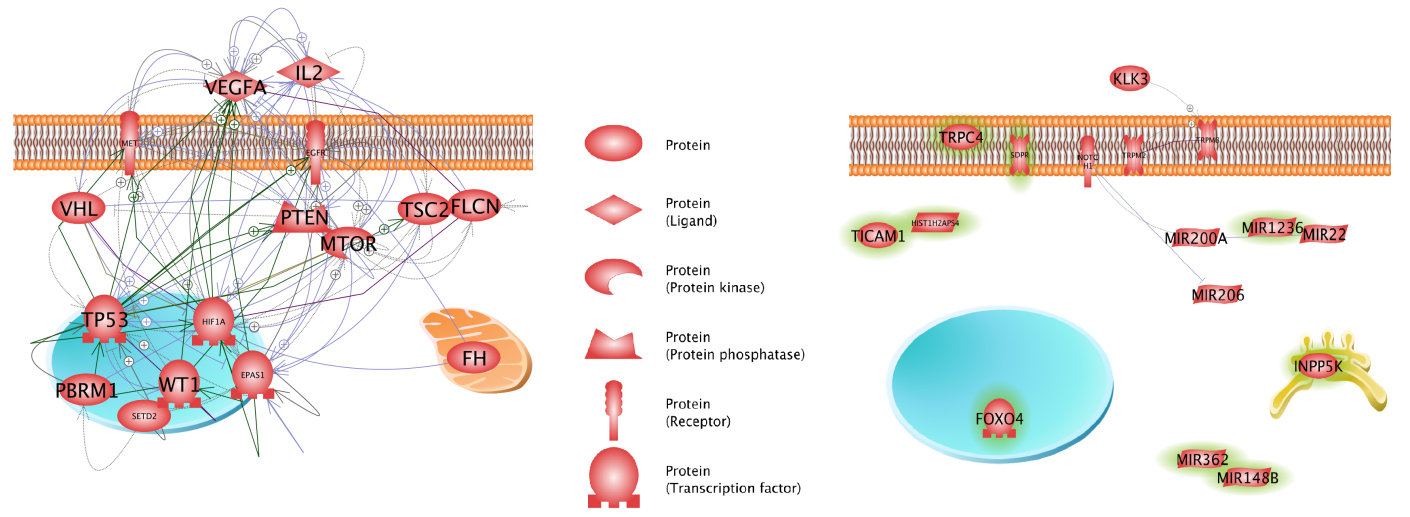 Fig. 3 Connectivity networks of 16 genes from different groups.
These networks were generated using Pathway Studio. Unrelated genes are in blue.
Using GSEA, two biological metrics, EScore and PScore, were generated for each gene. The PScore value represents how many RC-associated pathways involved the gene. The EScore shows the significance of those pathways (Eq. (4)).
A correlation analysis was conducted using the averaged metric values for the 423 genes at a group level, to compare the EScore and the PScore with the two literature metrics (Fig. 4 (a)). The 423 genes were sorted by RScore and metric value was averaged using a moving window of length 14. Results showed that the average scores strongly correlate, especially for the top ones ranked by different scores (Fig. 4 (a) and Table 6). The group-wise PScore and EScore were extremely correlated (p ≈ 1).
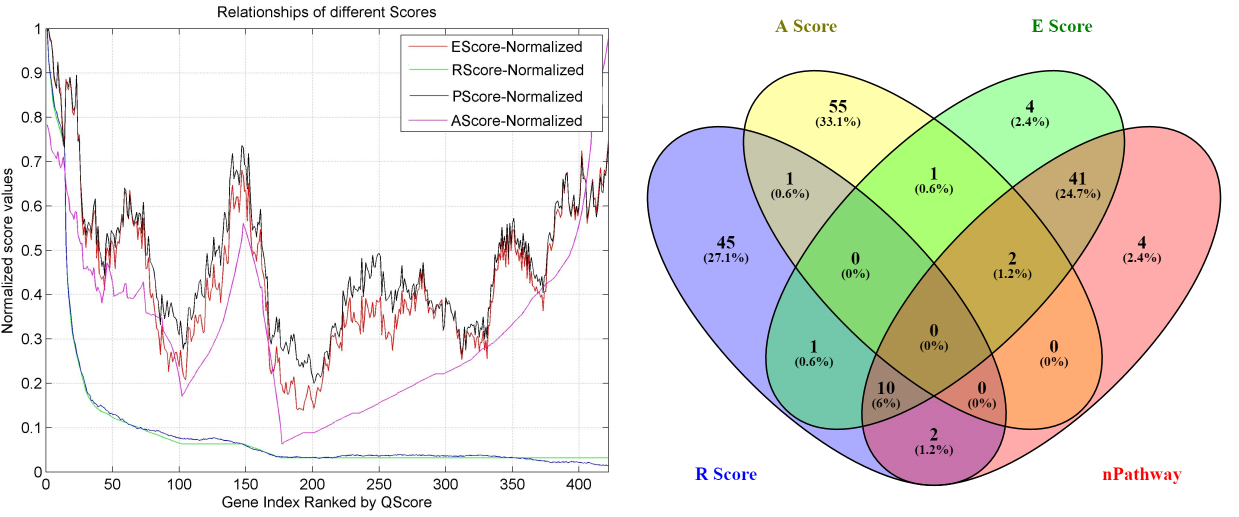 Fig. 4 Comparison of different metrics.
(a) A Venn diagram of the top 59 genes selected by different metrics; (b) Comparison of average metrics values with a gene set size of 14.
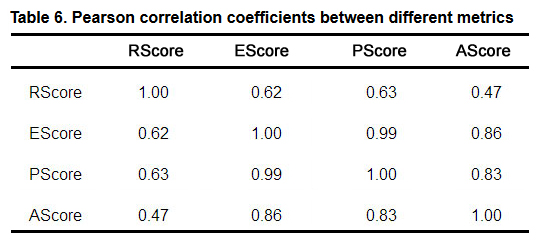 Table 6. Pearson correlation coefficients between different metrics
A cross-analysis of the top 59 genes selected using different scores (corresponding to the number of genes reported within the past two years (2015-Apr. 2016)) was performed, and are presented in the Venn diagram in Fig.4 (a) (Oliveros, 2007-2015).
There was a strong overlap between PScore and EScore group (53/59). These 53 genes are related to most pathways that were significantly enriched (Supplementary Material 2). The AScore group had an overlap of one gene with the RScore group (CD274: 5 references), and an overlap of 2 genes with both the EScore and PScore groups (NOTCH1: 1 reference, CREB1: 1 reference). These novel genes were reported within the last 2 years and demonstrated a relatively high frequency of replication or multiple functional associations with the disease (PScore:15.00 ±1.41 pathways), suggesting that they merit further study.
There were 10 genes identified with overlap of the EScore, PScore, and RScore groups, including IL6, VEGFA, HIF1A, EGFR, PTEN, TP53, FGF2, CTNNB1, HMOX1, and BRCA1, with RScore = 11.20 ± 6.88 references, PScore: 27.70 ± 8.39 pathways. There were 41 genes observed in both the PScore group and the EScore group, which were not in the RScore group. This included: TGFB1, TNF, PDGFB, BCL2, PRRCA, FAS, AKT1, PTK2, TGFBR2, CAV1, BMP2, IGF1, CDKN1B, KDR, MYC, HRAS, SERPINE1, MMP9, CCL2, CDKN1A, AGT, STAT1, IGF2, SFRP1, EPO, CDKN2A, IL4, FGF1, MDM2, HSPD1, GSK3B, NOD2, IFNG, MMP2, COL1A1, CASP1, AGER, TIMP1, IL18, CXCL12, and RPS27A. Each of these genes play roles within many significant disease pathways (21.80 ± 7.09 pathways). RC-gene relationships involving these genes are old (ASocre: 10.59 ± 6.78 years) and not frequently replicated (1.49 ± 0.75 references).
We performed an LDM on 1,100 articles (published between 1988 and April 2016) which reported 423 genes associated with RC. Supplementary Material 1 provides the full gene list together with the literature and enrichment metrics scores. Results from GSEA and SNEA support the literature in that most of these genes may play roles in RC pathogenesis. NCA showed that many of these genes are functionally linked to one another.
As an automatic data mining approach, the NLP technique is effective, and efficient, in processing large amounts of literature data for LDM. However, an automatic LDM method may produce false positives. Therefore, the results of this study are intended to provide a map for the current field of RC genetic study and provide a basis for further biological and genetic studies in the area. Supplementary Material 1 is intended to provide detailed information about the articles studied, including the specific sentences where a relationship is located.
This analysis did not specifically focus on any individual gene, however, it was observed that the genes identified did not have equal publication frequencies (RScore), or novelty (AScore), or functional diversity (EScore). Using a proposed quality metric score, the genes could be ranked according to different needs, or significance, and the top ones selected for further analysis (Table 1). For example, the top 5 genes by AScore: FOXO4, HIST1H2APS4, INPP5K, KLK3, and MIR1236, have recently been reported on. FH, VHL, IL2, MET, and PTEN are the top 5 most-often-replicated-in-studies genes (with highest RScores), suggesting that they are common RC variables.
In the top 100 pathways enriched with 329 of the 423 genes (Supplementary Material 2), some genes appear in multiple significantly-enriched pathways and present a high EScore. Examples include TGFB1 (46/100 pathways), IL6 (38/100 pathways), TNF (37/100 pathways), VEGFA (39/100 pathways), and PDGFB (36/100 pathways). These genes play multiple roles within different genetic pathways associated with RC indicating their biological significance with the disease.
There were 10 genes that overlapped in the EScore, PScore, and RScore groups. These genes were frequently replicated (11.20 ± 6.88 references) in previous studies showing an association with RC, and play roles within multiple (27.70 ± 8.39) significant pathways associated with RC. These results indicate that these genes are highly likely to possess pathogenic significance for RC.
There were 3 novel genes (NOTCH1, CD274, and CREB1) that were also identified that were in both the EScore and the PScore groups. These were reported in last 2 years in a few references. They play roles within multiple significant pathways implicated with RC, warranting further study. For instance, NOTCH1 was recently reported (2016) by one reference. This gene is involved in many previously-implicated RC pathways or with other cancers, such as positive regulation of cell proliferation (0008284), negative regulation of cell proliferation (0008285), angiogenesis (0001525), positive regulation of apoptotic process (0043065), positive regulation of cell migration (0030335), regulation of cell proliferation (0042127), positive regulation of epithelial cell proliferation (0050679), negative regulation of canonical Wnt signaling pathway (0090090), and organ regeneration (0031100) [15-17].
There were 41 genes found in both the PScore group and the EScore group, but which were not in the RScore group. The RC-gene relationships involving these genes were older (ASocre: 10.59 ± 6.78 years) and less frequently replicated (1.49 ± 0.75 references). Our results suggest that they may be worthy of further study.
Most genes identified by this LDM were included in previously implicated RC pathways. This includes 17 cell growth and proliferation-related pathways, 2 protein phosphorylation-related pathways, 4 pathways/gene sets related to transcription factors, 7 cell apoptosis-related pathways, and 1 protein kinase related pathway [18-22]. It is hypothesized that the majority of these reported genes, especially those identified with significantly enriched pathways, should be functionally linked to RC. There may be false positives from separate studies in the publications but it seems less likely that a large group of genes have been falsely perturbed [14].
When members of a gene set strongly cross-correlate, GSEA can boost the signal-to-noise ratio making it possible to detect modest changes in individual genes [14]. The NCA analysis showed that many of the frequently reported genes relating to RC were functionally associated with one another (Fig. 3). This conclusion is supported by hundreds of scientific reports. There were 329 of the 423 included in the top 100 enriched pathways (p-value < 1.2e-10), and 272 that were in the top 20 pathways listed in Table 2 (p-value < 1e-20). If “functionally related” is defined as “co-existence within the same genetic pathway” then 77.8 % of the 423 genes are functionally related. These results indicate that these functionally-linked genes are relationships that constitute true discoveries rather than noise (false positives).
An SNEA, implemented via Pathway Studio using master casual networks generated from more than 6.5 million relationships derived from more than 4 million full text articles and 25 million PubMed abstracts, was performed. Pathway Studio automated NLP technology is able to quickly update terminologies and linguistic rules used by NLP systems to ensure that any new term can be captured soon after it enters regular use in the literature. Updating is done weekly. This extensive database of interaction data provides high levels of confidence when interpreting experimentally-derived genetic data against the background of previously published results (Pathway Studio Web Help). The SNEA results demonstrated that many of the 423 genes (>90 %) identified as causal genes for other health disorders such as breast, stomach, lung, and other cancers strongly associate with RC [23-25].
This studyhas several limitations which should to be taken into account in any future work. The literature data of the 1,100 articles studied were extracted from the Pathway Studio database. Although it covers over 40 million articles, the possibility remains that some articles studying gene-RC associations were beyond the scope of coverage. Additionally, even though the metrics scores, RScore, AScore, EScore, and PScore proposed as significance measures of the literature reported gene-disease relations are related, they are not direct biological significance measures of the genes for the disease. Experimental work is needed to test the networks and these metrics.
Results from this up-to-date LDM reveal that the 423 genes identified showed multiple types of associations with RC, and mapped an overview for the current genetic study of RC. The literature and enrichment metrics discovered the top genes with specific significance. NCA, and enrichment analysis, results suggested that these genes play significant roles as a network in RC pathogenesis as well as the pathogenesis of many other RC-related disorders. These results suggest that these genes may operate as a functional genetic network which influences disease development.
We conclude that RC is a complex disease with complex genetic causes linked to a network composed of a large group of genes. LDM, together with GSEA, SNEA, and NCA, can serve as an effective approach in finding these potential target genes. This study provides a map with metrics for the current field of genetic research into RC, and can be used as the basis for further biological/genetic studies in the area.
The authors declare that they have no conflict of interests.
1.
2.
3.
4.
5.
6.
7.
8.
9.
10.
11.
12.
13.
14.
15.
16.
17.
18.
19.
20.
21.
22.
23.
24.
25.
Supplementary File 1: Zip File
Zhou P, Wang Y, Cao H, Manor L C. Literature Data Mining and Enrichment Analysis Reveal a Genetic Network of 423 Genes for Renal Cancer. Med One. 2016; 1(3): 1; https://doi.org/10.20900/mo.20160010

Copyright © 2020 Hapres Co., Ltd. Privacy Policy | Terms and Conditions


