Location:Home >> Detail
Med One. 2016; 1(4): 3; https://doi.org/10.20900/mo.20160016

1 Department of Biomedical Engineering, Tianjin University, Tianjin 300072, China
2 Rush Medical College, 600 S Paulina St, Chicago, IL 60612, USA
3 Laboratory of Human Carcinogenesis, NCI, NIH, 9000 Rockville Pike, Bethesda, MD 20892, USA
*Corresponding Author: Hongping Zheng, Ph.D, Laboratory of Human Carcinogenesis, NCI, NIH, 9000 Rockville Pike, Bethesda, MD 20892, USA. Tel: 301-496-7279.
Background: Congenital heart defects (CHD) are the most common type of birth defect, affecting approximately 8 in 1,000 newborns. Hundreds of genes have been reported as CHD candidate genes. Nevertheless, each patient/patient group may demonstrate unique etiologic characteristics requiring personalized treatment.
Methods: We proposed a sparse representation-based variable selection (SRVS) approach to select disease-related genetic markers from a huge disease candidate gene pool acquired from ResNet relation database. The proposed approach was used to evaluate 167 CHD candidate genes and was followed by validation on a microarray expression data set. Pathway enrichment analysis (PEA), sub-network enrichment analysis (SNEA), and network connectivity analysis (NCA) were conducted to study the functional profile of the variables selected by SRVS and compare them with previous reported genetic markers.
Results: A significantly high disease prediction accuracy of 81.40 % was obtained (permutation p-value < 0.0002) using the top 24 SRVS-selected genes, which had been enriched within multiple pathways and sub-networks that had been previously implicated with CHD. Using the most frequently reported genes out of the 167 CHD candidate genes, the highest accuracy of 69.77 % was obtained with a permutation p-value = 0.017. Enrichment analysis and NCA showed that the top genes selected by the proposed SRVS approach were strongly related to the frequently reported CHD genes, although functional differences were present.
Conclusion: Our study suggests that SRVS is an effective method in data driven variable selection for CHD and that frequently reported CHD candidate genes may not be the best biomarkers for a specific CHD patient/ patient group.
Congenital heart defects (CHD) are heart and large blood vessel anatomical abnormalities occurring during embryonic development [1]. CHD can result from genetic factors, or environmental factors; however, a combination of both is typical [2, 3]. Recently, there have been an increased number of articles reporting hundreds of genes/proteins related to CHD, many of which were suggested as candidate genes for the disease However, every patient/patient group has unique human genome variations that requires treatment based on their predicted response or risk of disease [4].
Sparse representation has recently received significant attention in applications such as signal recovery and significant components identification [5, 6]. However, in the cases of large variable and small sample number applications, specific modulation is required to fulfil the variable selected task. In many biomedical problems (e.g., genomic data, image data) samples are far outnumbered by variables.
This study proposes a sparse representation-based variable selection (SRVS) algorithm for selecting significant biomarkers at different detection resolutions, which has previously been effective in selecting variables from SNP data and fMARI data [7]. Instead of selecting a specific of number of variables, this data-driven method ranks all variables by generating a sparse regression weight for each of them [7].
In this section, the proposed SRVS algorithm (Section 2.1) is described and then applied to a CHD candidate genetic biomarker selection problem (Section 2.2). Finally SRVS-selected variables are studied in terms of pathway enrichment analysis (PEA), sub-network enrichment analysis (SNEA), and network connectivity analysis (NCA) (Section 2.3).
2.1 SRVS algorithmIn general, a sparse representation model can be presented as Eq. (1).
y = x δ + ε (1)
where y ∈ R n × 1 is the observation vector; x ∈ R n × p are the data measurements and p ≥ n . ε ∈ R n × 1 is the noise-caused measurement error. The goal is to reconstruct the unknown vector δ ∈ R p × 1 based on y and x.
To best approximate y by choosing a small number of non-zeros entries of δ for the model given by Eq. (1), we consider the following Lp minimization problem (P0):
(P0) min|| δ ||p subject to || y - xδ ||2 ≤ ε (2)
where ||*||p is the Lp norm, and p ∈ [0, 1]. The following algorithm is designed to solve the minimization problem (P0) given by Eq. (2) and detect the columns of x relevant to y.
SRVS Algorithm:
1. Initial δ (0) = 0;
2. For the Step ι, randomly choose k columns from
x = {x1, ..., xp} to construct a n ⅹ k sub-matrix denoted as xι ∈ R n × k ; and mark the selected columns' indexes as Iι ∈ R 1 × k ;
3. Solve the following Lp minimization problem to find the optimal sparse solution δι ∈ R k × 1 :
min|| δι ||p s.t. ||y - xιδι||2 ≤ ε (3)
4. Update δ (ι) with δι : δ (ι) (Iι) = δ (ι-1) (Iι) + δι ; where δ (ι) (Iι) and δ (ι-1) (Iι) denote the Iι th entries in δ (ι) and δ (ι-1) respectively;
5. If ||δ (ι) / ι - δ (ι-1) / (ι-1)||2 > a, where is a predefined constant, update ι = ι+1, and go to Step 2. Otherwise, set δ = δ(ι) / ι . The non-zero entries in δ correspond to the column vectors selected.
In Step 3, there are many proposed methods for solving the Lp minimization problem, such as the Homotopy method [8] for p = 1, and the orthogonal matching pursuit (OMP) algorithm [9] for p = 0.
2.2 CHD Candidate Genes for EvaluationA 167-CHD-candidate gene pool was acquired from the CHD-Gene relation data, which was also included in a gene expression data set (GEO: GSE34457). CHD-Gene relation data was acquired from Pathway Studio (PS) ResNet 11 Mammalian database updated July 2016. The ResNet® Mammalian database is one part of PS ResNet Databases, which are a group of real-time update network databases, including curated signaling, cellular process, and metabolic pathways, ontologies, and annotations, as well as molecular interactions and functional relationships extracted from 35M+ references covering the entire PubMed abstract and Elsevier full text journals. More information about the PS ResNet Mammalian databases is available at http:// pathwaystudio.gousinfo.com/ResNetDatabase.html.
The gene expression profile was acquired from the cell lines of 43 Down syndrome patients, among whom 21 were with CHD (case) and 22 without (controls). The original data includes 48,701 probes. All probes with null data entries were removed, resulting in an overlap of 167 genes with the CHD candidate gene pool.
2.3 Validation of the SRVS methodTo test the validity of the proposed method, we studied the SRVS selected genes through four approaches: CHD predication, PEA, SNEA and NCA. For comparison purposes, we also compared the performance of the top frequently referenced CHD candidate genes.
2.3.1 Definition of two scoresThe reference number underlying a gene-disease relationship is defined as the gene’s reference score (Rscore). The SRVS approach generated weights for each gene is defined as the SRVS score (Sscore).
2.3.2 Validation using disease predictionWe hypothesize that significant CHD candidate genes/gene set should contribute to distinguishing CHD patients from healthy controls. A Euclidean, distance-based, multivariate classification [7] of the gene expression data set (GEO: GSE34457), followed by a leave-one-out (LOO) cross-validation, using the overall gene set and the sub-sets selected by Sscore and Rscore as tentative markers, was performed to validate selected gene effectiveness and the proposed SRVS approach. Next a 5,000 run permutation was conducted to test the hypothesis that a randomly-selected gene set of the same size can reach an equal, or higher, classification accuracy (CR).
2.3.3 Enrichment and connectivity analysisTo better understand the underlying functional profile of the genes selected by Sscore and Rscore, we also conducted a PEA and an SNEA on the top genes selected by the two scores. An NCA was also conducted on the gene subsets using Pathway Studio, to identify connectivity between given genes/proteins. The weight of an edge is the number of scientific references underlying a reported gene-gene interaction.
An analysis of CHD-Gene relation data revealed a CHD gene pool of 684 genes, supported by 3,237 articles (Supplementary Table S1). Of these 684 CHD candidate genes, 167 were evaluated using the proposed SRVS algorithm with an independent gene expression data (GEO: GSE34457). Fig. 1 presents the CHD candidate genes. The complete 167 gene list and related information, including Sscore and Rscore, is in Supplementary Table S2.
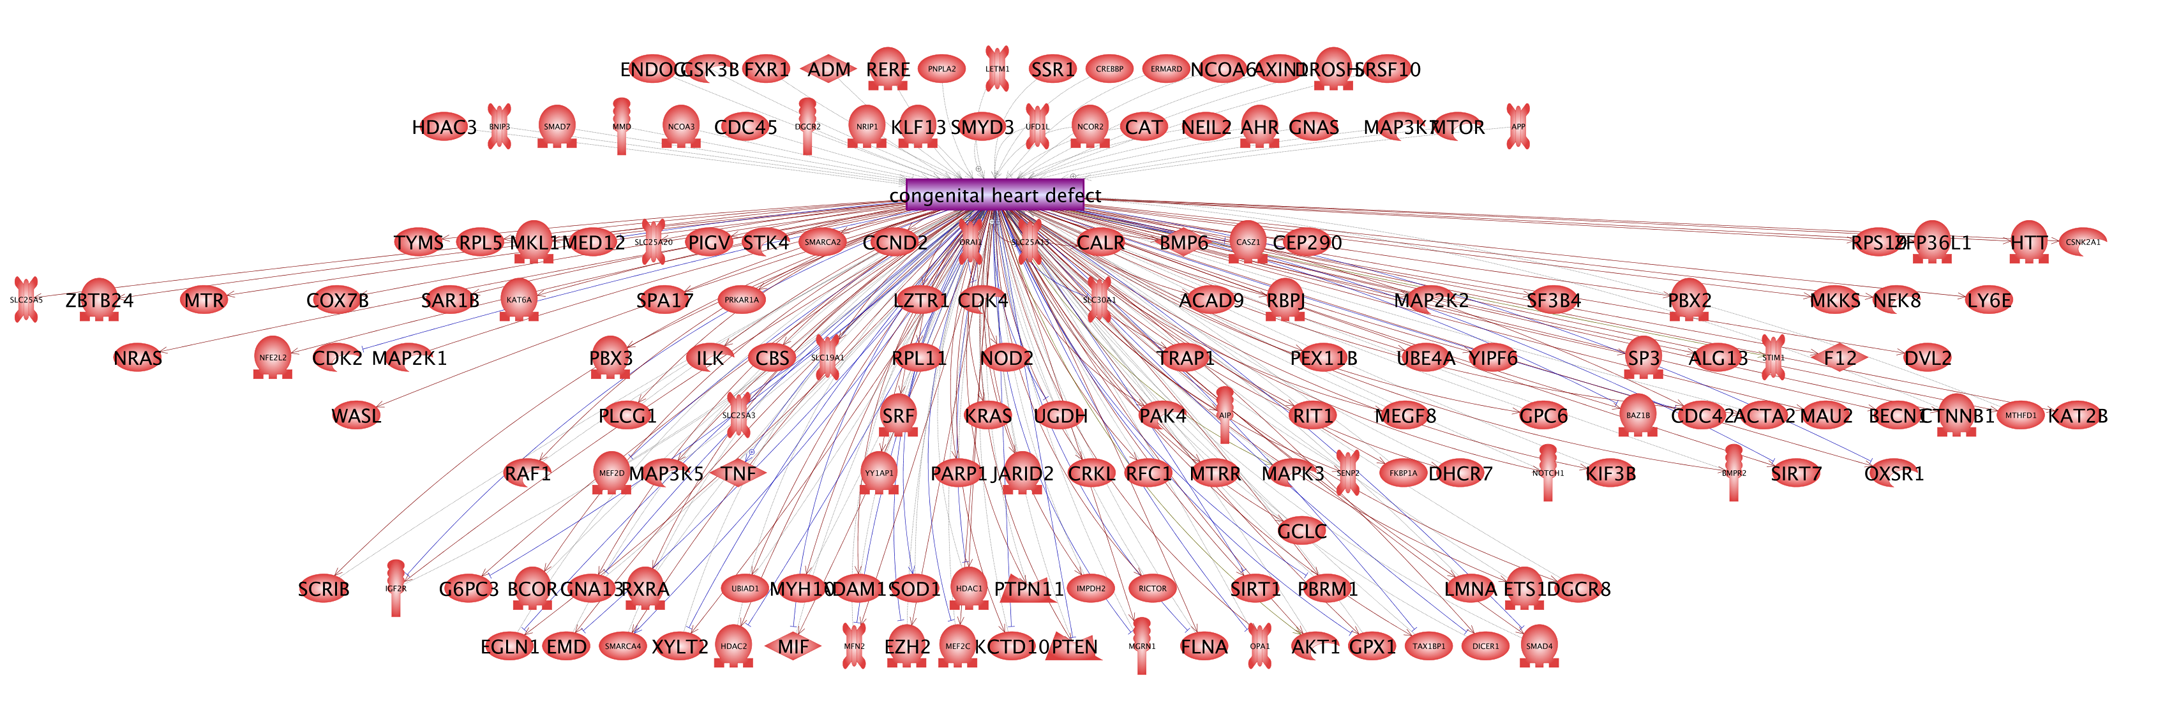 Fig. 1 The 167 CHD Candidate Genes Analyzed
The effectiveness of the SRVS-generated metrics, the Sscore, was evaluated using a case/control classification and a LOO cross-validation on an RNA microarray dataset (GEO: GSE34457). This was followed by a 5,000 run permutation test. The Rscore was tested for comparison purposes. In the LOO cross validation, the 167 genes were ranked by different metric scores, and then the top n (n = 1, 2, …) genes were used as input variables for classification and LOO cross-validation. Fig. 2 presents the results with maximum classification ratios (CRs) marked at the position of corresponding number of genes.
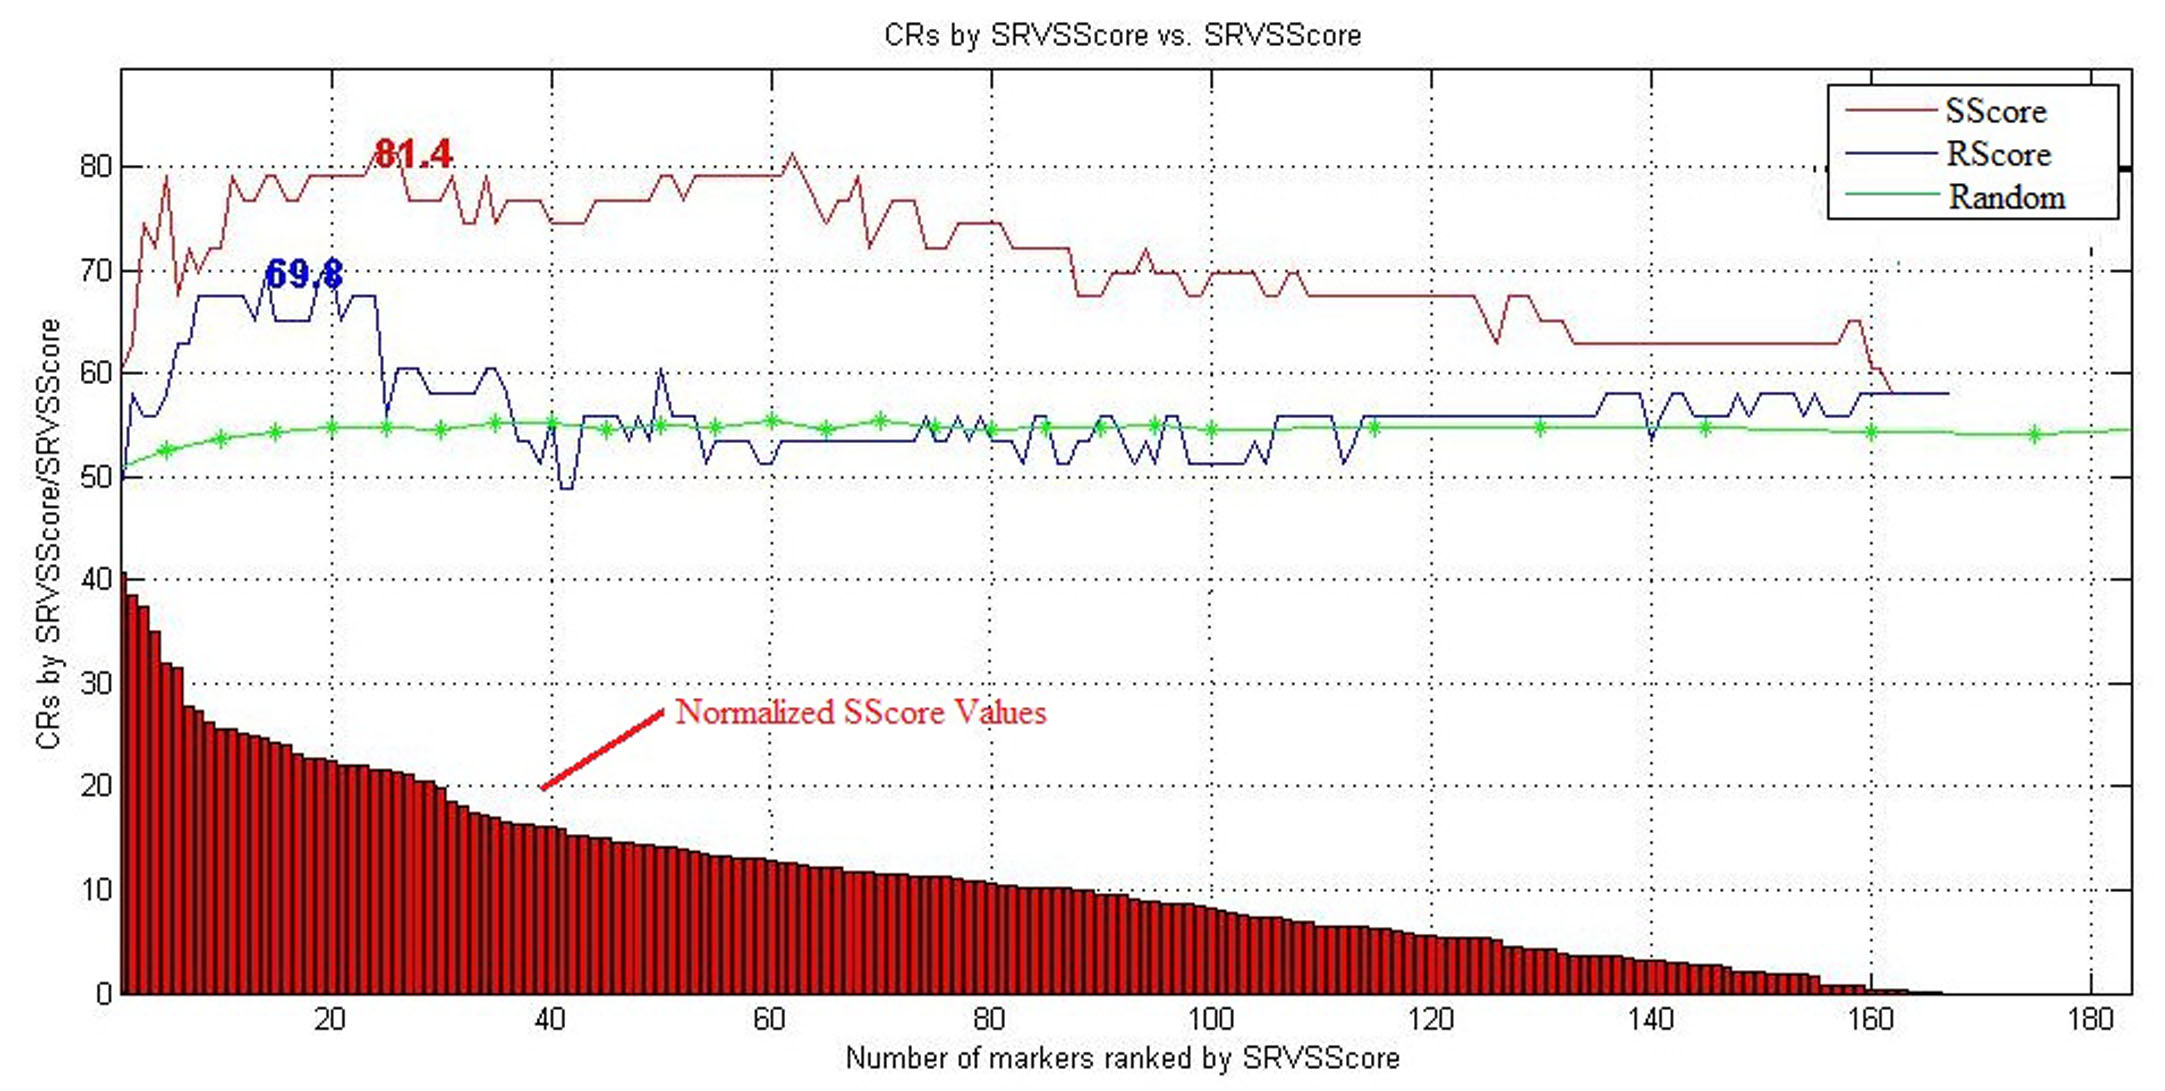 Fig. 2 Comparison of Different Metrics via LOO Cross Validation (genes ranked in ascending order)
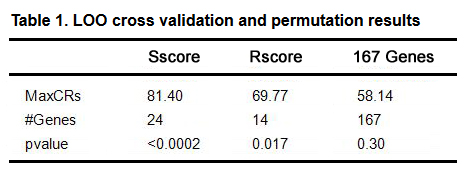 Table 1. LOO cross validation and permutation results
Fig. 2 suggests that the top genes using both the Sscore and the Rscore leads to significant better classification accuracies as compared to CRs generated by randomly selected gene sets of same size. Moreover, the highest CRs were acquired by using only the top genes selected by different scores, (See Fig. 2 and Table 1). Adding more genes with lower scores do not help to get a better CR, suggesting the validity of both Sscore and Rscore.
To note, the Sscore led to much higher CRs with lower permutation p-values, demonstrating the proposed method’s effectiveness. The top 24 Sscore are in Table 2. The top 24 Rscore genes are provided for comparison purposes. The full lists are in Supplementary Table S2.
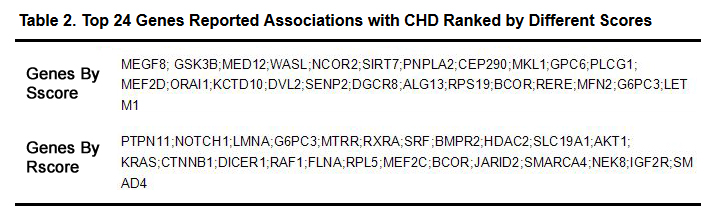 Table 2. Top 24 Genes Reported Associations with CHD Ranked by Different Scores
To better understand the profile of the genes selected by SRVS approach, the two groups of top genes selected by Sscore and Rscore (Table 2) were compared using PEA and NCA approaches. A two-gene overlap: BCOR and G6PC3 (Fig. 3 (a)) was identified.
Nevertheless, a strong relation between the two gene groups is suggested by an NCA analysis, which detected 94 relations between 18/24 Sscore genes and 18/24 Rscore genes (Fig. 3 (b)), supported by more than 3,000 references (Supplementary Table S3).
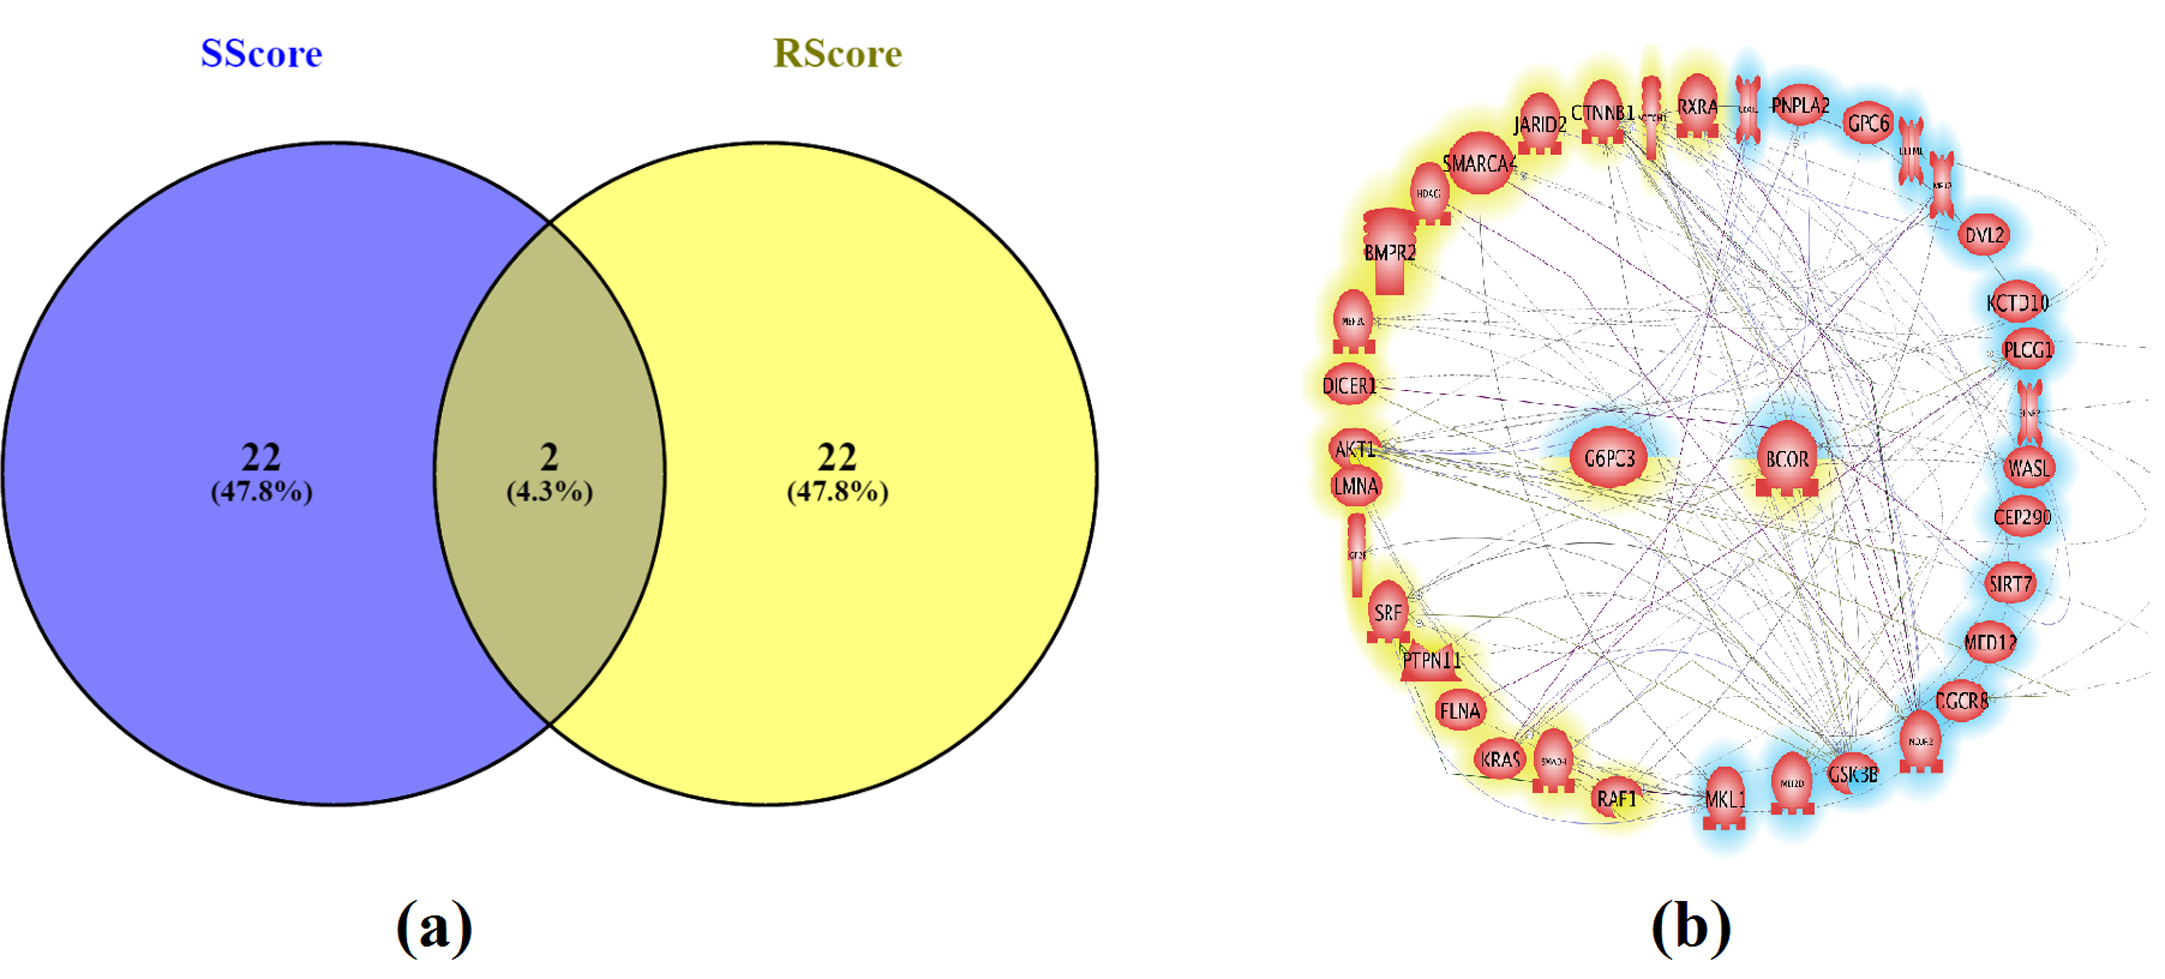 Fig. 3 Overlap and association between the sub gene sets with the highest Sscore and Rscore.
(a) Venn diagram of the top 24 genes by both scores; (b) Gene-Gene connection between top 24 genes by both scores; Rscore genes in yellow; Sscore genes in blue.
PEA and SNEA results for the different groups listed in Table 3 are presented in this section. At the same enrichment p-value threshold (< 0.001), 152 pathways are enriched by the top 24 Rscoree genes, while only 17 enriched pathways for the Sscore group were identified. The top 10 pathways/gene sets, by different scores, appear in Table 3. Complete results are in Supplementary Table S4a and S4b.
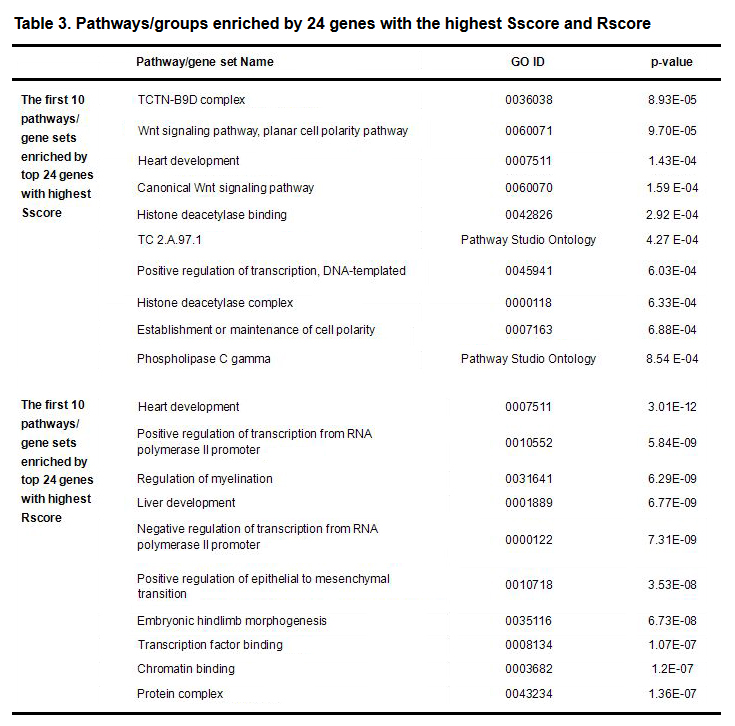 Table 3. Pathways/groups enriched by 24 genes with the highest Sscore and Rscore
Table 3 shows that top Sscores genes and those with the top Rscores genese were enriched in different groups of pathways (only one overlap: GOID 0007511), with different p-values (Sscore group: 8.54 E-04 - 8.93 E-05; Rscore group: 1.36E-07 - 3.01E-12), indicating that the top genes selected by SRVS were functionally different from the most frequently reported ones.
The 17 pathways/gene sets enriched with the 24 Sscore genes (p-value < 0.00091, with 16/24 unique genes; Supplementary Table 4a), held 1 gene set related to heart development (GO: 0007511; p-value = 0.00014, overlap: 4). These sets also held 2 gene sets related to transcription factors for positive DNA-templated transcription regulation (GO: 0045941; p-value = 0.0006, overlap: 5) and positive regulation of transcription on the RNA polymerase II promoter (GO: 0010552; p-value = 0.00091, overlap: 6). Both have been previously implicated with CHD (Clark et al. 2016).
In addition to PEA, a SNEA using Pathway Studio for identifying a selected gene’s pathogenic significance to other disorders, possibly related to CHD, was performed. Full results appear in Supplementary Table S5a and S5b. Table4 shows the top 10 disease-related sub-networks enriched by the two gene groups.
Table 4 indicates that both groups enriched some other heart defect related sub-networks, as well as other congenital and genetic mutation related sub-networks. Two sub-networks were observed for both groups: congenital malformation and leukemia.
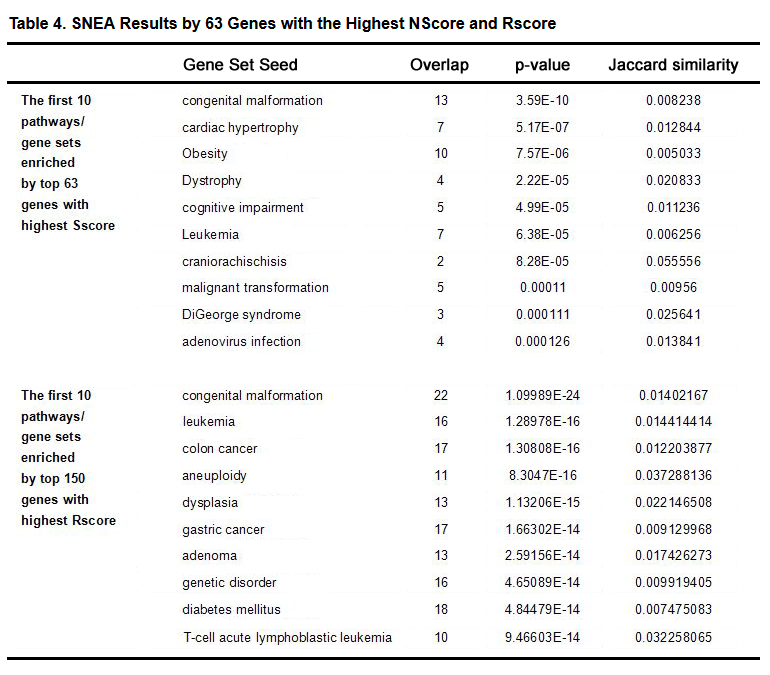 Table 4. SNEA Results by 63 Genes with the Highest NScore and Rscore
In addition to PEA and SNEA, an NCA was performed on the top 24 genes having the highest Rscores and Sscores (Table 2) to generate functional networks. In the Sscore group, 11 of the 24 genes presented 14 direct connections supported with 53 references. The Rscore group had more than 113 relations among 19/24 genes, with 1,283 literature supports (Fig. 4 (b)). This observation is consistent with the PEA and SNEA. It suggests that the highest Sscores genes were less functionally related to each other than the Rscore group genes were.
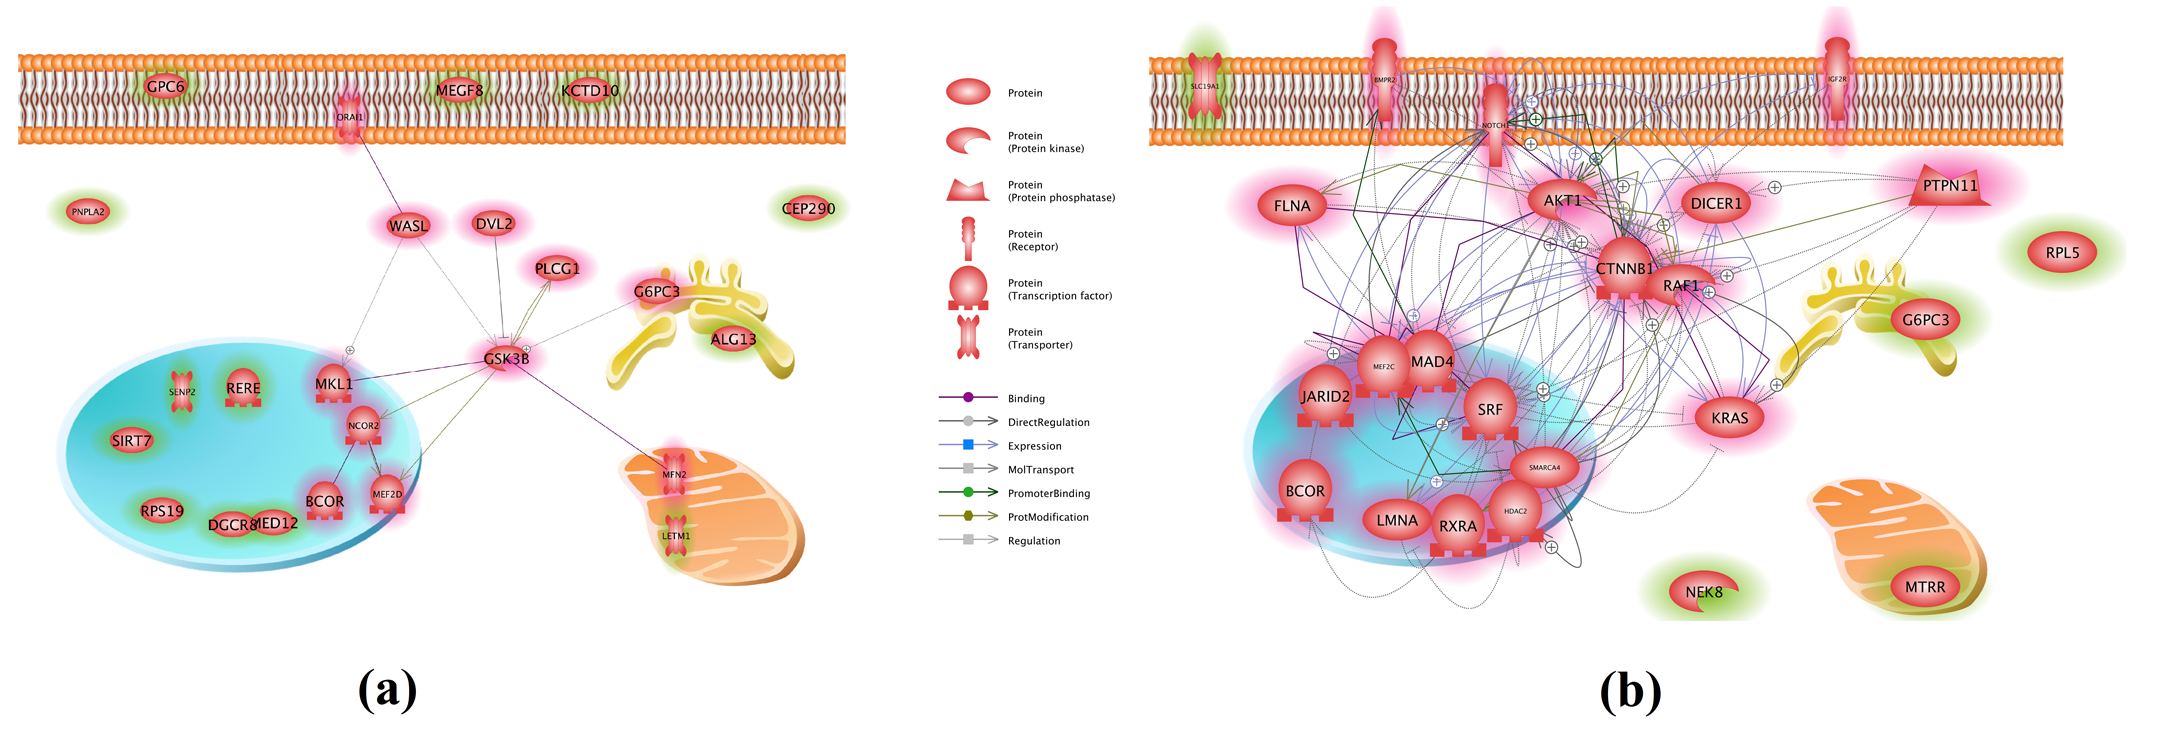 Fig. 4 Connectivity networks built by 24 genes from different groups. Networks were generated using Pathway Studio.
(a) Sscore group; (b) Rscore group.
Identification of significant biomarkers based on a small number of observations is a fundamental problem in signal processing. This study proposed a sparse representation based genetic marker selection approach, and applied it to evaluate 167 CHD candidate genes. The genes were identified from a CHD-Gene network relation data set acquired from the ResNet database. This set overlapped with a RNA gene expression data set (GEO: GSE34457). Two metric scores were generated and compared: the Sscore from SRVS analysis, and the Rscore from the CHD-Gene relation data set analysis.
LOO cross validation demonstrated that if whole 167 CHD candidate genes were used, a classification ratio of only 58.14 % was obtained with a permutation p-value of 0.30 (Table 1). Using both Sscore, and Rscore, top genes resulted in greater CRs (81.40 % and 69.77 %) with a more significant permutation p-value (< 0.017). This suggests a need for variable selection for the candidate CHD genes tested, as well as the efficacy of both Sscore and Rscore.
The top 24 Sscore genes led to the greatest CR with the lowest permutation p-value, demonstrating the effectiveness of the proposed SRVS method in CHD variable selection. The top 24 Rscore-selected genes and the 24 genes selected by SRVS were compared to provide a clearer understanding. Analysis showed that these two groups share only two genes: BCOR and G6PC3 (Fig. 3 (a)). Enriched pathways (Table 4), associated sub -networks (Table 5), and gene-gene interactions (Fig. 4) revealed other differences. The results highlight that even though well-studied CHD candidate genes were significant to the disease and were also effective in disease prediction (LOO permutation p-value = 0.017), they were not the best genetic markers for the subjects involved with the expression data tested (GEO: GSE34457).
Despite differences between the top genes selected by Sscore and Rscore, many of Sscore enrichment pathways previously reported to associate with CHD were identified. For example, heart development, positive regulation of transcription from the RNA polymerase II promoter, the DNA-templated positive regulation of transcription, the canonical Wnt signaling pathway, and histone deacetylase binding [11-13]. Furthermore, these genes were also identified to be the genetic basis of other CHD related diseases, such as congenital malformation, cardiac hypertrophy, dystrophy, and cancer [14, 15]. These results support the biological validity of the top genes selected by the SRVS approach.
There is direct literature support for associating CHD and the top 24 genes selected by Sscore (Supplementary Table S1). A strong functional association between the top genes selected by the Sscore and Rscore groups (Fig. 3 (b)) is supported by over 3,000 references (Supplementary Table S3). Genes with a high Rscore suggests strong support in the literature for linking it to CHD. Our observations provide indirect support for the proposition that the majority of the top genes selected by the SRVS method are functionally significant in CHD.
This study does have several limitations calling for future work. Although the algorithm was tested on 167 CHD candidate genes, there are other genes linked to CHD that were not included in the data set and were, therefore, not analyzed. More inclusive data sets including all CHD genes should be used to test this method’s accuracy. The method should also be tested on other diseases to determine its validity.
We conclude that CHD is a complex disease with genetic causes linked to a network composed of a large gene group. Each patient/patient group may present with unique genomic variations requiring treatment based on their particular disease risk prediction, where the proposed SRVS method can be employed effectively.
The authors declare no conflict of interests.
1.
2.
3.
4.
5.
6.
7.
8.
9.
10.
11.
12.
13.
14.
15.
Zhou P, Lehrman B H, Zheng H. Sparse Representation Based Genetic Biomarker Evaluation for Congenital Heart Defects. Med One. 2016; 1(4): 3; https://doi.org/10.20900/mo.20160016

Copyright © 2020 Hapres Co., Ltd. Privacy Policy | Terms and Conditions


