Location: Home >> Detail
Adv Geriatr Med Res. 2020;2(4):e200022. https://doi.org/10.20900/agmr20200022

1 Geriatric Education and Research Institute (GERI), 768024, Singapore
2 Geriatric Medicine, Khoo Teck Puat Hospital, 768828, Singapore
3 Department of Psychological Medicine, National University of Singapore, 119228, Singapore
4 Health and Social Sciences Cluster, Singapore Institute of Technology, 138683, Singapore
* Correspondence: Shiou-Liang Wee.
There is no consensus on a composite gait variability (GV) score as an overall GV for the various spatial and temporal gait parameters. This had dampened the reporting and acceptance of GV, with little work on this topic in Asian population. This cross-sectional study derived an Enhanced Gait Variability Index (EGVI) and reference values in an Asian population and evaluated its validity as an indicator of physiological fall risk. It was conducted in a large residential town of Yishun in Singapore with community-dwelling adults aged 21–90 years of age categorized into 3 groups—reference group, low fall-risk and high fall-risk. Physiological Profile Assessment (PPA) score of ≥ 2.0 was used to differentiate high fall-risk and low fall-risk groups. EGVI were derived from five spatiotemporal parameters: step length (cm), step time (s), stance time (s), single support time (s) and stride velocity (cm/s), with those participants aged less than 65 years old as reference group. Our Asian population showed greater overall gait variability compared to an European cohort. This Asian EGVI displayed a non-linear relationship with both ageing and gait speed—significant changes in the EGVI were observed for those older than 60 years of age and in those whose habitual gait speed was lesser than 120 cm/s. The EGVI discriminated between older adults with and without high fall risk and showed weak to moderate correlation with a number of the functional mobility and balance tests in both high and low fall risk groups. We derived an Asian EGVI with reference values and validated its ability to discriminate fall risk among older adults.
5XSS, Five Times Sit to Stand Test; EGVI, Enhanced Gait Variability Index; GV, Gait Variability; GVI, Gait Variability Index; HC, Healthy Control; HR, High Fall Risk group; KES, Knee Extension Strength; LR, Low Fall Risk group; PCA, Principal Component Analysis; PPA, Physiological Profile Assessment; TUG, Timed-up and Go Test
A decrease in the preferred walking speed is an indication of fall risk [1–5]. However, slower gait could be due to ageing [6], gender [7], fear of falling [8,9], and physiological (e.g., lower extremity muscle weakness [10]) or even psychological factors (e.g., depression [11]). Thus, changes in gait speed might not be the best indicator of fall risk in older adults. The challenge has been to identify an assessment metric that is independent of gait changes that are affected by covariates such as age and gender, yet sensitive in predicting future falls, especially among the community dwelling older adults. Gait variability may offer a viable solution.
Gait variability (GV) refers to the change in spatiotemporal characteristics between steps. Sensitive to age-related mobility deficits and pathological processes, GV changes have been used to predict falls [12–14], cognitive decline [15] and dementia [16]. With the advancement in technology, it is now possible to quantify both macro and micro levels of gait changes without the use of expensive equipment. The use of wearable technologies such as smartwatches and accelerometers to monitor gait within the community-dwelling population have opened up opportunities to identify individuals at risk of falls [17] and cognitive impairment [18]. However, the use and reporting of GV have not gained wide acceptance due partly to the lack of consensus regarding the best approach to quantify them [19] as well as the lack of a composite score as a single representation of the various spatiotemporal parameters of gait [20]. A composite measure for GV could enable comparison between populations, or allow clinicians to track GV changes in association with different pathological processes.
As such, investigators have developed summary measures of kinematics variables for GV, e.g., Gillette Gait Index (GGI) [21] and the Gait Deviation Index (GDI) [22]. Gouelle et al. (2013) [20] developed and validated the Gait Variability Index (GVI) as an alternative to the GDI and the GGI. The GVI is a conglomerate variability measure of nine spatiotemporal parameters [20]. More recently, Gouelle and colleagues further introduced the enhanced GVI (EGVI) with improved magnitude and directional specificity of the GVI by refining the calculation methods and removing four of the nine redundant/ overlapping spatiotemporal parameters [23].
The work on GVI and EGVI have thus far been limited to diseased populations [24,25], but there is potential for the use of this composite index as an indicator for mobility deficits, fall-risk and cognitive impairment in community-dwelling older adults. Furthermore, GVI/EGVI has not been studied in Asians, and is without Asian reference values.
The main objective of this study was to derive EGVI reference values in an Asian population and to evaluate its ability to discriminate between different physiological fall risk.
Community-dwelling adults (≥21 years) were recruited from a large north-eastern residential town of Yishun in Singapore, with a residential population of 220,320 (50.6% females), with 12.2% older adults (≥65 years). This is similar to the overall Singapore residential population [26] of 4,026,210 (51.1% females), with 14.4% older adults (≥65 years).
ParticipantsRandom sampling was employed to obtain a representative sample of approximately 300 male and 300 female participants, filling quotas of 20–40 participants in each sex- and age-group (10-year age-groups between 21–60; 5-year age-groups after 60). Older adults (above 75 years old) were also additionally recruited through community and senior activity centres. Participants were excluded if they had physical disabilities that limited their activities of daily living; diagnosed with either cognitive impairment or any neuromuscular disorders; or suffering from more than five poorly controlled co-morbidities or chronic illness. Ethics approval was obtained from the National Healthcare Group Domain Specific Review Board (DSRB-2017/00212) and written consent was obtained from all participants.
MethodsA 6m instrumented walkway system, GAITRite® (CIR systems, USA, 120 Hz sampling rate) was used for the gait analysis. Participants were instructed to initiate their gait 1m before and end 1m after the walkway system, to account for any gait related accelerations or decelerations, respectively. Participants were instructed to walk barefoot at their self-selected (habitual) gait speed. After a practice trial, three valid trials were recorded. A trial was considered valid if at least 6 alternate footfalls were captured within the sensor platform. Spatiotemporal parameters (Figure 1) were automatically calculated by the walkway software (Version 4.8.5). Gait speed was estimated from the mean stride velocity of the participants.
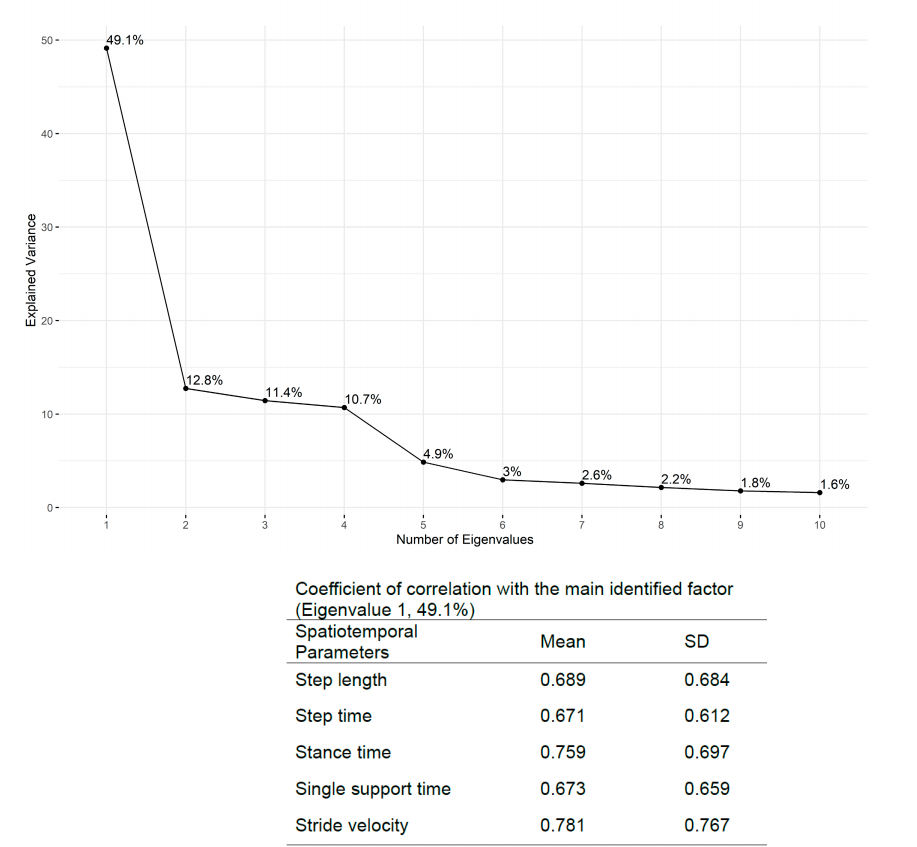 Figure 1. Results for Principal Component Analysis: Eigenvalues and their respective explained variance.
Prior to the gait assessments, participants performed two common functional mobility tests: the Timed-up and Go (TUG) [27] and the Five Times Sit to Stand Test (5XSS). Participants performed the TUG twice and the mean value was used for analysis. As for the 5XSS, participants were provided a single practice trial, after which the actual test was performed. Additionally, they also performed the short-Physiological Profile Assessment (PPA) [28]. The short-PPA has been validated as an indicator of fall risk in older adults [28–30]. It consists of five sub-tests: (a) Melbourne Edge Test (b) hand reaction test (c) proprioception (d) knee extension strength (e) postural sway. However, only the last 3 sub-tests, which are related to the lower limb, are discussed in this study.
Participants aged 65 and above and with a fall risk score of 2.0 and above were categorized as the “High Risk” (HR) group and the rest as “Low Risk” (LR) group [28]. Those below the age of 65 were classified as the “Healthy Control” (HC) group for the computation of the reference EGVI values.
Alternative parameters [20], pn, which describes the intra-trial variability of step time (s), step length(cm), stance time(s), single support time (s), stride velocity (cm/s) from data of all subjects (n = 531) were included in the Principal Component Analysis (PCA) to compute the correlation coefficient, cn, that describes the contribution of each variable to the overall variability of the data. For the computation of alternative parameters, a macro (an Excel version was provided as a supplementary material by Gouelle et al. (2013) [20]) was implemented in R Studio (Version 3.6.1). The results of the PCA analysis suggested that close to 50% of the variance was explained by the first principle factor alone (Figure 1). However, this was lower than those reported by Gouelle et al. (2013) [20]. Stride velocity and stance time contributed most to the overall gait variability, with all of the variables achieving correlation of at least 0.6 with the principle component (Figure 1). These coefficients were used as weights in the EGVI calculation as explained below.
The EGVI was calculated using a modified macro (an Excel version was also provided as a supplementary material by Gouelle et al. (2013) [20]) that was again implemented in R Studio (Version 3.6.1). Modifications were based on Gouelle et al. (2018) [23], and they primarily pertained to addressing issues related to (a) magnitude (b) direction (c) and redundancy. The details of the calculation and modifications are presented elsewhere [20,23]. We only highlight the main steps involved in the derivation of the EGVI here.
First, the mean sum of product, sHP, was calculated based on the five spatiotemporal parameters (step time, step length, stance time, single support time and stride velocity) of 215 healthy participants (aged 21 to 65 and gait speed ≥ 100.0 cm/s) by matrix multiplication (see Gouelle et al., 2013 [20] for more details) of the weighted coefficient, cn, and the alternative parameters, pn. The sHP for this group was 18.05, which was close to Gouelle et al. 2013 [20]. Then, the sum of product of each participant, sα, was computed (again by matrix multiplication) and the absolute distance, dα,HP, between this participant (sα) and the healthy control group (sHP) was calculated. An addition of 1 was added to dα,HP prior converting this value to the raw EGVI ( ). If the sum of product of this participant, sα, was lower than the control group (sHP = 18.05), the was negated. If it was in the range of the mean raw EGVI of the healthy control group [−
 , + ], then a value of EGVIα = 100 was assigned to this participant, otherwise the z-score was computed, thereafter multiplied by 10 and add to a 100. This would be the participant’s EGVI. An EGVI score of 100 indicated that the participant’s gait variability was the same as the healthy/control population and any deviations from the 100, more indicating greater and less indicating lower gait variability than the reference group [20,23].
Mann–Whitney U non-parametric test was used to compare the differences in raw EGVI, EGVI between populations. Student’s t-test was used to compare differences in all other continuous variables, including participant characteristics. Stepwise linear regression models for fall risk were used to examine the independent and combined effects of EGVI and gait speed. Linear modelling investigated the relationship between (a) EGVI and Age; (b) EGVI and gait speed. Whenever the scatterplots suggested possible quadratic relationship, the models were tested for significant improvement in adding a quadratic term to the model. Discriminatory power of EGVI was explored using ROC analysis. Pearson correlation was used to assess the relationship between EGVI and functional mobility and balance tests. Significance level (α) was set to 0.05 for all statistical tests. Statistical analysis was performed using R Studio (Version 3.6.1).
Table 1 shows the profile of the participants grouped according to age and PPA fall risk. Twenty participants who did not complete all three of the PPA subtasks were excluded from data analysis. Complete gait data was available in 511 subjects and has been presented in detail elsewhere [31]. The HR group was significantly older than the LR group. They were also significantly shorter, although there were no differences in their weight and BMI. There was a significant difference in fall risk score (PPA) between the two groups—the mean PPA score of the HR was in the ‘Marked’ range whereas it was in the “Normal” range for the LR. Gait speed of HR group was also significantly slower than the LR group. EGVI of the HR group was significantly greater than the LR group. The LR group had better performance in all functional mobility and balance assessments than the HR group.
The Asian EGVIThe raw EGVI of our reference group (1.28 ± 0.64) was significantly lower (p < 0.001) than that reported by Gouelle et al. (2013) [20] (1.39 ± 0.62) (recomputed after implementing the modification recommended in Gouelle et al. (2018) [23]).
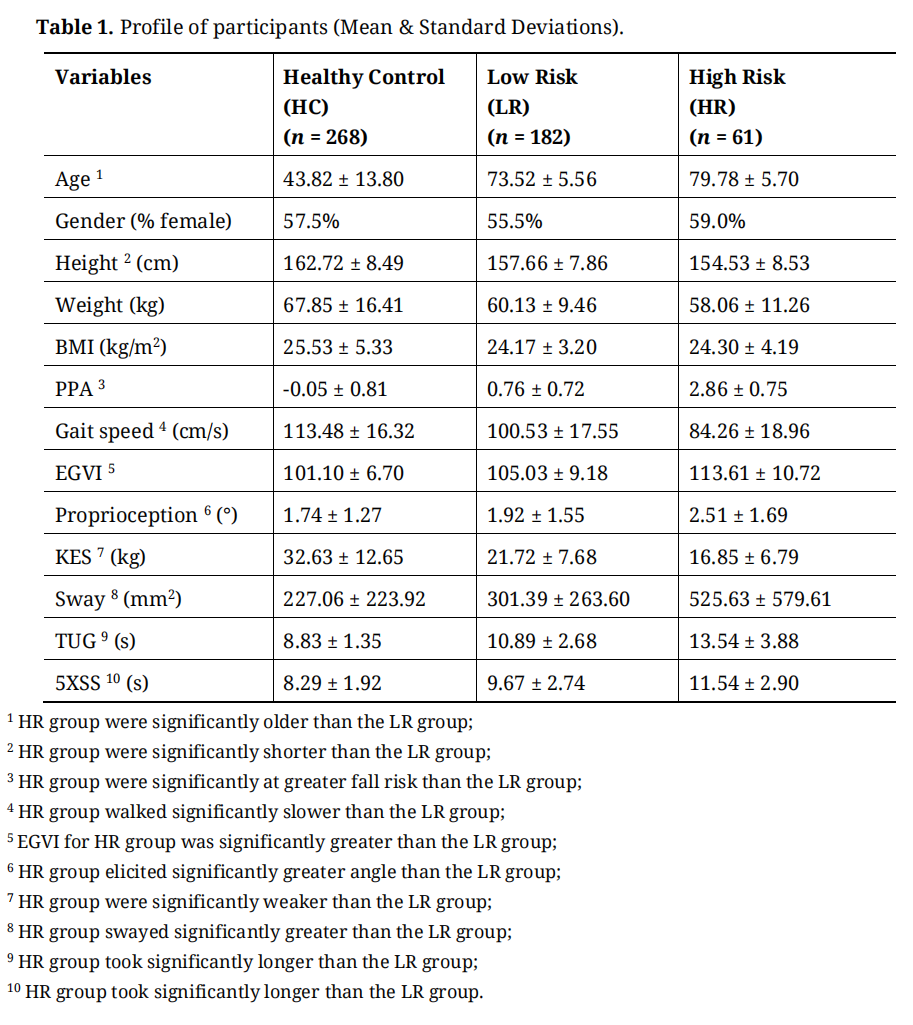 Table 1. Profile of participants (Mean & Standard Deviations).
Figure 2(A) showed the change in EGVI with age. There was no gradient till around the 60s, after which a steady increase in EGVI is observed. The EGVI for those aged 65 years and above (107.18 ± 10.27) was higher (p < 0.001) than those aged below 65 years (101.10 ± 6.70). Figure 2(B) showed the relationship between gait speed and EGVI: those with a slower self-selected gait had increased gait variability than the control group, with EGVI appeared to be constant at gait speeds >120 cm/s.
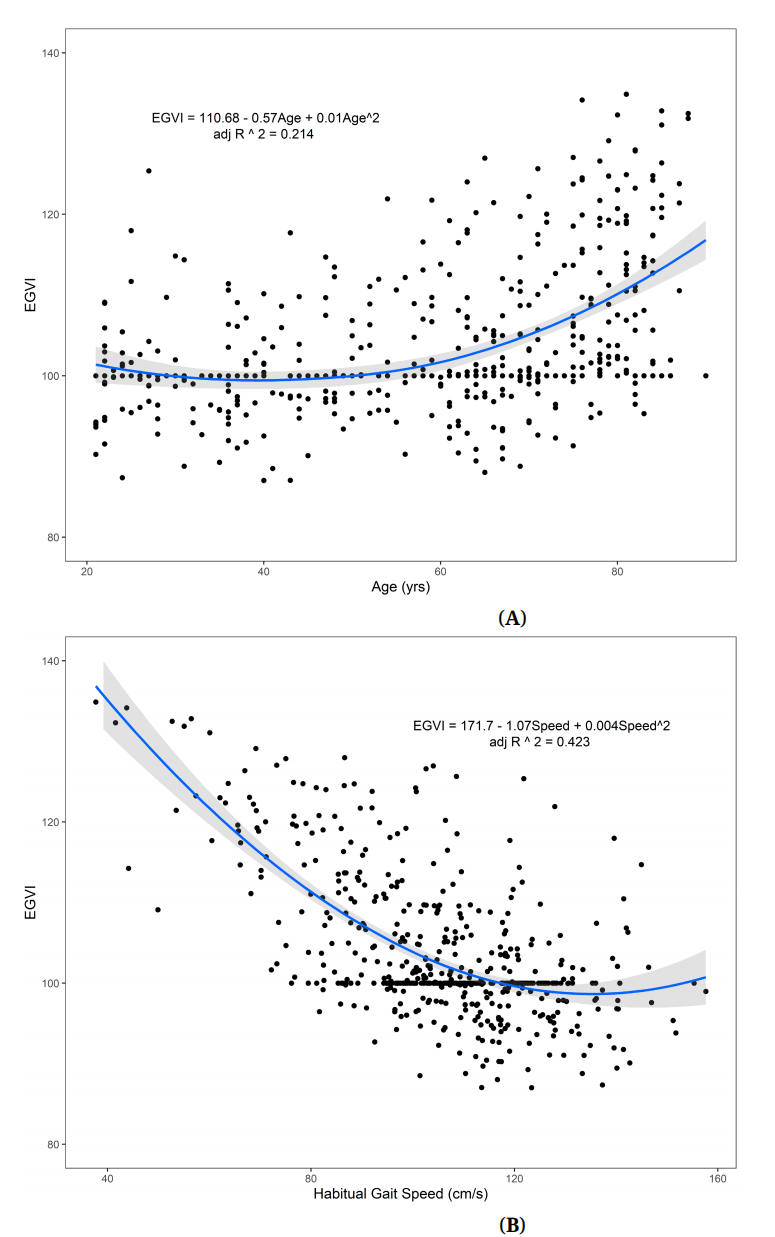 Figure 2. (A) Relationship between Enhanced Gait Variability Index and age (n = 511). There is no relationship between EGVI and age before approximately 60 years of age, after which we observe a steady increase in EGVI with advancing age. (B) Relationship between Enhanced Gait Variability Index and habitual gait speed (n = 511). EGVI decreased steadily with increasing habitual gait speed but not so after 120 cm/s.
The EGVI of the HR group (113.61 ± 10.72) was greater (p < 0.001) than the LR group (105.03 ± 9.18). Linear regression models for fall-risk (dependent variable, PPA score) for both EGVI and gait speed suggested that both variables were independent factors to fall risk, but the addition of EGVI significantly improved (p = 0.0143) the model with gait speed alone (Table 2). When we further investigated the alternative parameters, only pstep_length_mean , remained significant after controlling for age, gender, height and gait speed. The discriminatory power of the EGVI (AUC = 0.807 (95% CI: 0.741, 0.873)) was similar to that of gait speed (AUC = 0.805 (95% CI: 0.739, 0.871)) and both within acceptable range. Adding EGVI to gait speed did not significantly improve (p = 0.621) the discriminatory power for fall risk.
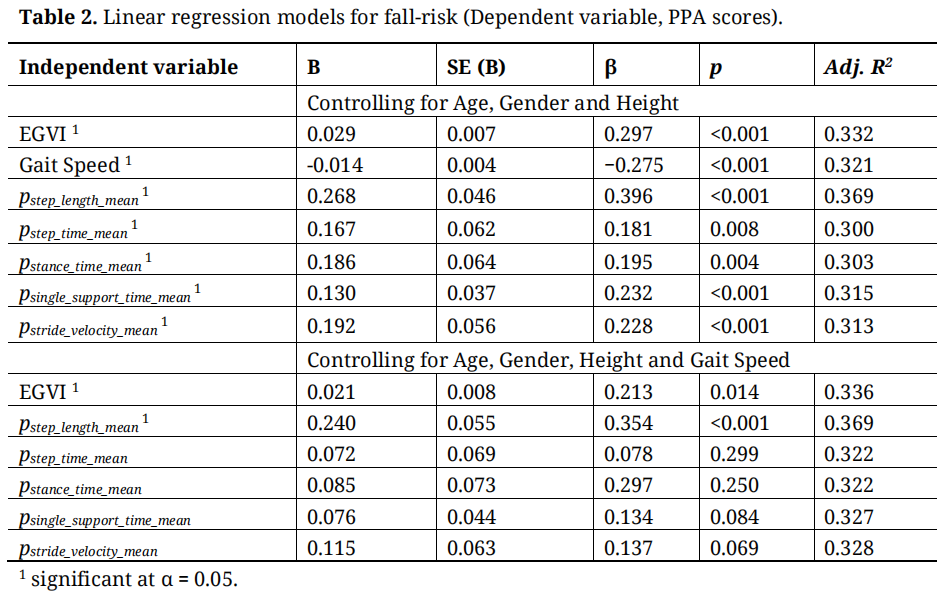 Table 2. Linear regression models for fall-risk (Dependent variable, PPA scores).
The EGVI for both the HR and LR groups were moderately and positively correlated with the results of functional mobility—TUG and 5XSS tests. The overall PPA fall risk score was also weakly correlated with EGVI, although more strongly for the HR group. The KES was negatively correlated with EGVI for both groups (Table 3).
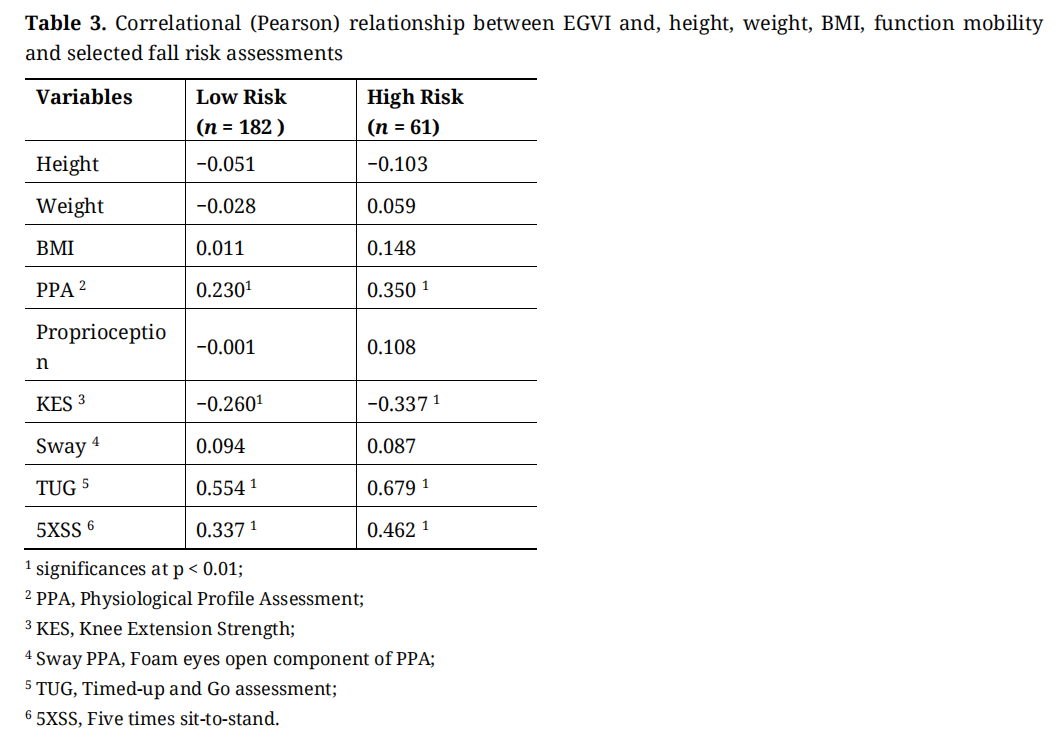 Table 3. Correlational (Pearson) relationship between EGVI and, height, weight, BMI, function mobility and selected fall risk assessments
This study derived and described Asian EGVI reference values and investigated its validity as an indicator of physiological fall risk among older adults. Our results showed that this Asian community dwelling population had greater overall gait variability compared with a European cohort. The EGVI of our cohort did not have a linear relationship with age and habitual gait speed. The EGVI was almost constant till the group in their 60s, after which it increased steadily. Furthermore, people with slower habitual gait had a greater EGVI or composite gait variability. The PPA is a valid and reliable measure for falls risk and outcome for interventions to reduce falls [28]. We demonstrated the validity of EGVI to discriminate between older adults with high and low PPA fall risk. Interestingly, only a single alternative parameter pstep_length_mean was significantly associated with fall risk score. The EGVI also had weak to moderate correlation with tests of functional mobility and balance performance (including TUG) [27] in both the high and low fall risk groups, further substantiating its validity as a GV composite index for GV in older Asian population.
Our control participants showed significantly greater values in six (mean step length, mean step time, mean single support time, mean stride velocity, SD step length and SD stride velocity) out of the 10 alternative gait parameters (see Figure 1), pn, used in the calculation of intra-trial gait variability. This showed a greater overall GV in ours compared to a Western population. Differences in gait parameters between Asian and the Western populations have been previously reported [32] but with no definitive conclusion on GV differences. Differences were reported mainly in stride length and walking speed and was attributed to the smaller stature of the Asian subjects [32]. However, these physical differences were unlikely to have any effect on GV. It is plausible that the differences in our study could have been due to the different age range or the proportion of women included in the control populations since both age [6,33] and gender [34] have been associated with gait variability.
The EGVI of our population was affected by age as well as gait speed. Balasubramanian et al. (2015) [35] reported that the GVI decreased with advancing age but did not include those who were younger than 50 years old. This was not surprising since variability in most of the gait spatiotemporal parameters increases with age [6], especially among older adults [33–36]. Furthermore, the slower the self-selected gait speed of the older adults, the greater was the EGVI. This again was not surprising since gait variability increases with reduced gait speed [37]. However, the increase in the EGVI among those who were greater than 60 years old were likely due to age-related muscle weakness and loss of flexibility, rather than due singly to slower gait [38,39].
Balasubramanian et al. (2015) [35] validated the use of the GVI to discriminate between older adults with high- and low mobility function. Schmitt et al. (2020) [25], validated the use of EGVI against individual spatiotemporal parameters in persons with Parkinson’s Disease (PD) population for assessment of falls. Others, such as Kalsi‐Ryan et al. (2020) [24], has validated the EGVI to discriminate between patients of varying severities of Degenerative Cervical Myelopathy (DCM). Our study is the first to report the validity of EGVI to discriminate between older, community-dwelling adults with high and low physiological fall risk. An increase in fall risk has been closely linked to the increase in gait variability among older adults in community dwelling [12,13,40], although it remains unclear which spatiotemporal parameter best capture this fall risk. Our study found that increased pstep_length_mean was associated with physiological fall risk. Although the alternative parameters, pn, could not be directly compared with published values of gait variability (due to methodological differences in derivation), our results suggest that the increase in variability of step length, which has been associated with falls, specifically in populations with cognitive deficits [41] may indicate the strong association between cognitive demands and falls among older adults.
We showed that EGVI is a convenient and sensitive composite score to quantify various spatiotemporal changes in relation to fall in community dwelling older adults. Furthermore, EGVI was significantly correlated with common functional mobility and balance assessments. This was contrary to Balasubramanian et al. (2015) [35], who reported moderate to strong but non-significant correlations between the GVI and various clinical measures of mobility and balance. Our larger sample have likely allowed us to better quantified the relationships.
Study LimitationsThe strengths of this study are its population-based nature and thoroughness of data collection. This study also has limitations. Firstly, while we used a well validated physiological fall risk assessment and other functional mobility tests, we did not investigate actual falls. We were also not able to validate the local EGVI with a more varied or diseased population as this was part of a normative study of a generally healthy population.
Future RecommendationsThe use of EGVI as a GV composite should not be only applied to fall-risk indicator as gait speed alone could be just as useful. In addition to physiological changes, EGVI may also be associated with cognitive changes. Thus, we recommend that future studies should investigate not only the validity of our Asian EGVI reference with a population which has more serious functional mobility issues but also those with cognitive impairment. There has been active research in the areas of cognition and gait variability, and the EGVI might provide a meaningful composite score that could be easily applied in the populations experiencing cognitive decline and impairment. This study showed that the EGVI can be an easily referenced composite index for clinicians to longitudinally monitor the mobility deficits, fall-risk and cognitive impairment in community-dwelling older adults.
We presented and discussed EGVI reference values for an Asian population. We also validated this reference with an older population with a higher fall risk and established the validity of EGVI as a composite GV index in an older population. Our Asian EGVI reference values should be further validated in and applied to various clinical populations with gait limitations, cognitive impairment and higher risk of falls, including individuals with stroke, dementia and Parkinson disease etc.
The dataset of the study is available from the authors upon reasonable request.
KAJ: Conceptualization, Methodology, Formal Analysis, Investigation, Resources, Data Curation, Writing—Original Draft, Writing—Review & Editing, Project Administration. WTS: Conceptualization, Methodology, Writing—Review & Editing, Project Administration. LKL: Formal Analysis, Investigation, Resources, Data Curation, Project Administration BWP: Formal Analysis, Investigation, Resources, Data Curation. DHMN: Formal Analysis, Investigation, Resources, Data Curation. QLLT: Formal Analysis, Investigation, Resources, Data Curation. KKC: Formal Analysis, Investigation, Resources, Data Curation. MUJ: Conceptualization, Methodology, Supervision. TPN: Conceptualization, Methodology, Supervision, Writing—Review & Editing. SLW: Conceptualization, Methodology, Supervision, Funding Acquisition, Writing—Review & Editing.
The authors declare that they have no conflicts of interest.
This research was supported as part of a core funding from the Ministry of Health of Singapore to GERI.
The authors gratefully acknowledge the strong support of Prof. Pang Weng Sun in making this Yishun Study possible, and the support of Dr. Lilian Chye, Sylvia Ngu Siew Ching, Aizuriah Mohamed Ali, Tan Lay Hong, Yeo Pei Shi, Ying Thit Thit Htat in this study. We would also like to gratefully acknowledge the assistance of Dr Arnaud Gouelle with the derivation of the EGVI.
1.
2.
3.
4.
5.
6.
7.
8.
9.
10.
11.
12.
13.
14.
15.
16.
17.
18.
19.
20.
21.
22.
23.
24.
25.
26.
27.
28.
29.
30.
31.
32.
33.
34.
35.
36.
37.
38.
39.
40.
41.
Abdul Jabbar K, Seah W-T, Lau LK, Pang BWJ, Ng DH-M, Tan QL-L. Enhanced Gait Variability Index in older Asian Adults and Increased Physiological Fall Risk: Results from the Yishun Study. Adv Geriatr Med Res. 2020;2(4):e200022. https://doi.org/10.20900/agmr20200022

Copyright © 2020 Hapres Co., Ltd. Privacy Policy | Terms and Conditions


