Location: Home >> Detail
Adv Geriatr Med Res. 2020;2(4):e200023. https://doi.org/10.20900/agmr20200023
 ,
Robert M. West 3,
Neil Pendleton 4,
Andrew Clegg 5
,
Robert M. West 3,
Neil Pendleton 4,
Andrew Clegg 5
1 Clinical and Population Sciences Department, Leeds Institute of Cardiovascular and Metabolic Medicine (LICAMM), University of Leeds, Leeds LS2 9NL, UK
2 Leeds Institute for Data Analytics (LIDA), University of Leeds, Leeds LS2 9NL, UK
3 Leeds Institute of Health Sciences, University of Leeds, Leeds LS2 9NL, UK
4 Manchester Institute for Collaborative Research on Ageing School of Social Sciences University of Manchester, Manchester M13 9PL, UK
5 Academic Unit for Ageing and Stroke Research, University of Leeds, Bradford, West Yorkshire BD9 6RJ, UK
* Correspondence: Theresa Munyombwe, Tel.:+44-0-113-343-0241.
Background: The electronic Frailty Index (eFI) was developed and validated using routinely available primary care electronic health record data. This study aims to develop mapping function for mapping between the eFI and a research standard frailty index validated as part of the English Longitudinal Study of Ageing (ELSA). Mapping eFI and ELSA frailty index (ELSAFI) measures could help facilitate the translation of research findings into clinical practice.
Method: Data from the Community Ageing Research 75+ (CARE75+) UK prospective cohort was used in this research. Regression analysis was used to develop mapping functions that can be used for translating the eFI into ELSAFI and vice versa. The predictive performance of the mapping function was evaluated using the Root Mean Square Error (RMSE), Mean Average Error (MAE), adjusted R square, and parsimony.
Results: A total of 896 individual cases was included in the analysis. The mean age of participants was 82.9 years (SD = 5.1) and 54.9% were females. There was positive correlation between the eFI and ELSAFI, r = 0.60. The mapping function of ELSAFI to eFI explained 38% of the variance in the derivation sample whilst the mapping algorithm of eFI to ELSAFI explained 40%. Both mapping functions had RMSE of 0.09.
Conclusion: The eFI can accurately be mapped on to a research standard ELSAFI and vice versa at the group level but not at individual level. Further testing is required to validate the mapping functions developed in this study in independent samples.
CARE, Community Aging Research; ELSA, English Longitudinal Study of Ageing; eFI, electronic Frailty Index; EHR, Electronic health records; Root Mean Square Error (RMSE); Mean Average Error (MAE); NICE, National Institute for Health and Care Excellence; MAPS, MApping onto Preference-based measures reporting Standards; OLS, Ordinary Least Squares; MCID, Minimum Clinical Important Difference; SD, Standard deviation
Improved identification and management of frailty has been recognised as an international priority [1]. To facilitate this goal, the electronic Frailty Index (eFI) has been developed and validated using routine UK primary care electronic health record (EHR) data from around 900,000 patients [2]. The eFI is based on the internationally established cumulative deficit model, which identifies frailty on the basis of a range of “deficits” (clinical signs, symptoms, diseases, disabilities/impairments). It incorporates 36 deficits, constructed using around 2000 primary care clinical codes. An eFI score is calculated by the presence or absence of each individual deficit as a proportion of the total possible, and enables identification of older people who are fit, and those with mild, moderate, and severe frailty. Increasing eFI score identifies older people at increased risk of nursing home admission, hospitalization, and mortality, with good to moderate discrimination.
The eFI has been made freely available to every general practice in England, and around 95% of all UK general practices. It is supported in the 2016 National Institute for Health and Care Excellence (NICE) multi-morbidity guideline [3], 2014 British Geriatrics Society & Royal College of General Practitioners Fit for Frailty Guideline [4] and 2017/18 general medical services contract in England [5], which includes the identification and management of frailty as a key contractual requirement.
Although the eFI is based on the cumulative deficit model as an underpinning theoretical framework, the eFI uses routinely available EHR data, so the summary eFI scores are not necessarily equivalent to those derived from research standard FI measures. A mapping function, or crosswalk, that can be used to convert scores from one measure to the other would enable comparison of studies of frailty performed with different measures. The eFI was developed using routinely available electronic health record data and category cutpoints were defined using a pragmatic approach based on population quartiles. However, this approach means that the eFI frailty categories do not necessarily align with research standard frailty measures. This means that it is not possible to accurately apply findings based on research standard frailty measures, for example from clinical trials of frailty interventions, in routine clinical practice. Development of a mapping function between widely used research standard frailty measure and the eFI will facilitate translation of existing and future research knowledge into routine clinical practice. The utility of mapping outcome measures has been demonstrated in economic evaluation studies [6] and in a range of disease areas [7,8]. In mapping measurement scales, the relationship between two measures is estimated using statistical methods to generate a mapping function that can be used to predict scores of one measure from the other. The derived mapping function can be applied in clinical trials and observational data containing the source measure to predict the target measure even though it was not collected in the original source study. A mapping function to convert scores could therefore potentially enable comparative research of cohorts, pooling data from different cohorts and the rapid translation of research findings into clinical practice.
The aim of this study was to develop mapping functions that can be used to predict the eFI scores from research standard ELSAFI scores, and vice versa. The ELSAFI includes 60 items covering a range of domains (activities of daily living, cognitive function, falls and fractures, joint replacement, vision, hearing, chronic diseases, cardiovascular diseases and depression). The full list of 60 variables included in the ELSAFI is reported elsewhere [9].
The current study is a secondary analysis of data obtained from the Community Ageing Research 75+ (CARE75+) prospective cohort [10]. CARE75+ includes detailed health and socioeconomic data from community-dwelling older people aged 75 years and over at a range of sites in England. Participants are recruited through general practices and assessed face-to-face at baseline, six months, 12 months, 24 months, and 48 months. CARE75+ includes both the eFI and a research standard FI measure, based on the previously validated English Longitudinal Study of Ageing (ELSA) [11]. More details of the CARE75+ study are provided elsewhere [12].
MeasureseFI summary scores for CARE75+ cohort participants were obtained from general practice EHRs using standardised data extraction protocols. ELSAFI variables were collected as part of the CARE75+ assessments, and summary scores were derived by calculating the number of deficits present as a proportion of the total.
Statistical AnalysesThe mapping procedures and reporting format used in this study followed the MApping onto Preference-based measures reporting Standards (MAPS) guidelines [13].
Exploratory Data AnalysisParticipant characteristics were assessed using descriptive statistics. The performance of the mapping functions depend on the overlap between the two measures [6]. Content overlap between the eFI and ELSAFI was examined by comparing the dimensions included in the two measures. A statistical assessment of the overlap was conducted by calculating the Spearman correlation coefficient.
Missing DataEight out of 1233 (0.6%) cases had missing ELSAFI scores and 331 out of 1233 (26.8%) had missing eFI scores. Two cases had both ELSAFI and eFI scores missing. As missing eFI scores were due to delay in obtaining eFI estimates from the primary care EHR systems, these data were considered missing completely at random and a complete case analysis approach was taken.
Modelling ApproachesThe direct approach was used to estimate the target measure from the source measure. This approach makes use of regression equations to predict the target measure (e.g., eFI score) from the source measure (e.g., ELSAFI score). We estimated regression coefficients using Ordinary Least Squares (OLS) methods, quantile regression and Tobit model. The mapping algorithm and prediction based on RMSE were similar to OLS therefore in this manuscript we have reported the mapping functions from OLS. We did not have access to the items data hence the models were developed using totals. Several OLS regression models were explored. In model 1, we regressed ELSAFI scores on eFI scores. Accounting for nonlinearity using a square root transformation made no difference to the predictive ability of model 1. In model 2, age and gender were added to improve the prediction of the mapping function. In model 3, we regressed eFI scores on ELSAFI scores. In model 4 age and gender were added to improve the prediction of the mapping function. Data analysis was conducted in STATA software version 15 [14].
Estimation of Predicted ScoresScore predictions were estimated using the “predict function” in STATA. The predict function calculates predicted values and residuals after fitting a model in STATA.
Validation MethodsFive-fold cross validation was used to validate the mapping functions by randomly splitting the sample into five subsamples, using the “cross validation function” in STATA.
Measures of Model PerformanceModel performance was evaluated using the Root Mean Square Error (RMSE), Mean Absolute Error (MAE), and adjusted R squared. The RMSE and MAE show the average prediction errors at individual level. Low RMSE or MAE values are indicative of good individual level prediction. In this study average prediction errors (RMSE, MAE) less than a Minimum Clinical Important Difference (MCID) of 0.05 for the measures were indicative of good individual level predictions. No MCID values were found in literature for the ELSAFI and eFI measures therefore the MCID that was used in this study was obtained from other similar studies [15,16].
Model Diagnostic ChecksOrdinal Least Squares (OLS) was selected because model diagnostic checking did not show any violations of the linear regression assumptions (normality and homogeneity of variance) (see Appendix 2).
Participant characteristics are reported in Table 1. They were 896 complete cases. Of these complete cases 492 (54.9%) were female, and 752 (83.9%) were of white ethnicity. The mean age was 82.9 years (SD 5.01). The median (range) scores of ELSAFI and eFI were 0.19 (0–0.63) and 0.24 (0, 0.88) respectively.
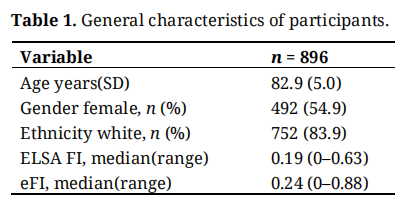 Table 1. General characteristics of participants.
The distributions of both eFI and ELSAFI are right skewed (Figure 1a,b), consistent with the usual distribution for a cumulative deficit frailty index. Figure 1c,d shows the scatter plots of eFI and ELSAFI scores, indicating a nonlinear relationship between ELSAFI and eFI measures. The correlation coefficient between the eFI and ELSAFI scores was estimated at 0.60, suggesting positive correlation between the two measures.
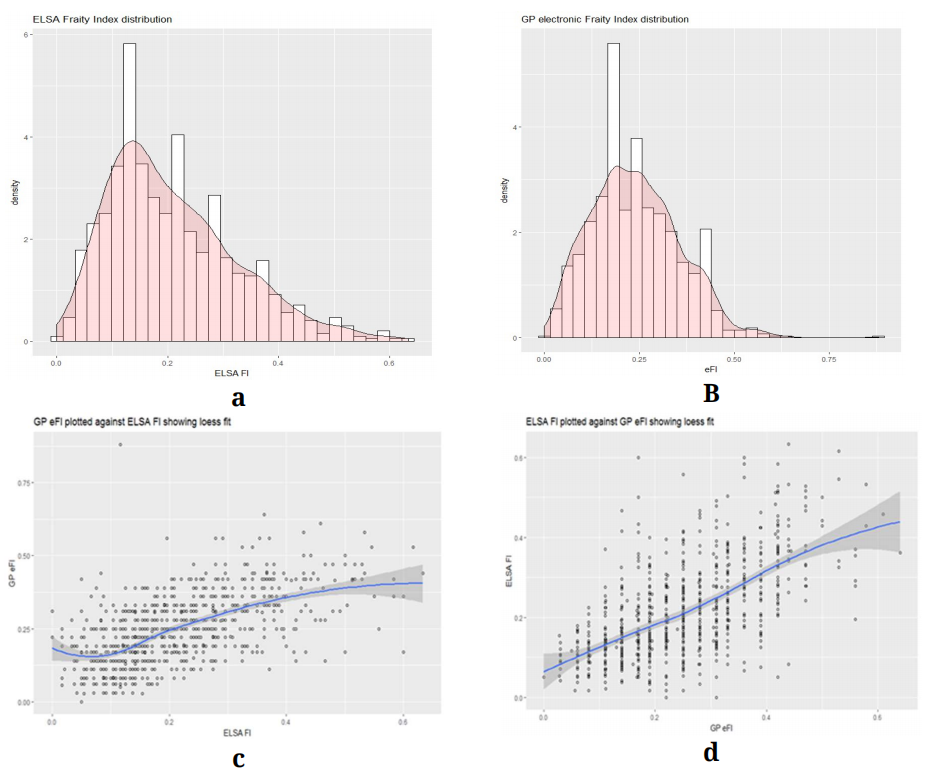 Figure 1. (a, b) distribution of eFI and ELSA FI; (c, d) scatter plot of eFI against ELSA FI and vice versa.
ELSAFI is a research FI with 60 items covering a range of domains: Activities of daily living, cognitive function, falls and fractures, joint replacements, vision, hearing, chronic diseases, cardiovascular diseases and depression. The eFI was developed using routinely available electronic health record data and the 36 items cover a range of domains including: Activity limitations, disease state, falls and fractures, disability, symptoms/signs, and anaemia and haematinic deficiency. Comparison of the domains covered by these two frailty indexes showed content overlap in some domains.
Mapping ELSA FI to eFI scores Model selectionTable 2 contains the results from the regression mapping of the ELSAFI to eFI and vice versa. Models 1 and 2 had an RMSE value of 0.09 but model 2 with age and gender had a slightly higher adjusted R squared of 0.38 compared to 0.36 for model 1.
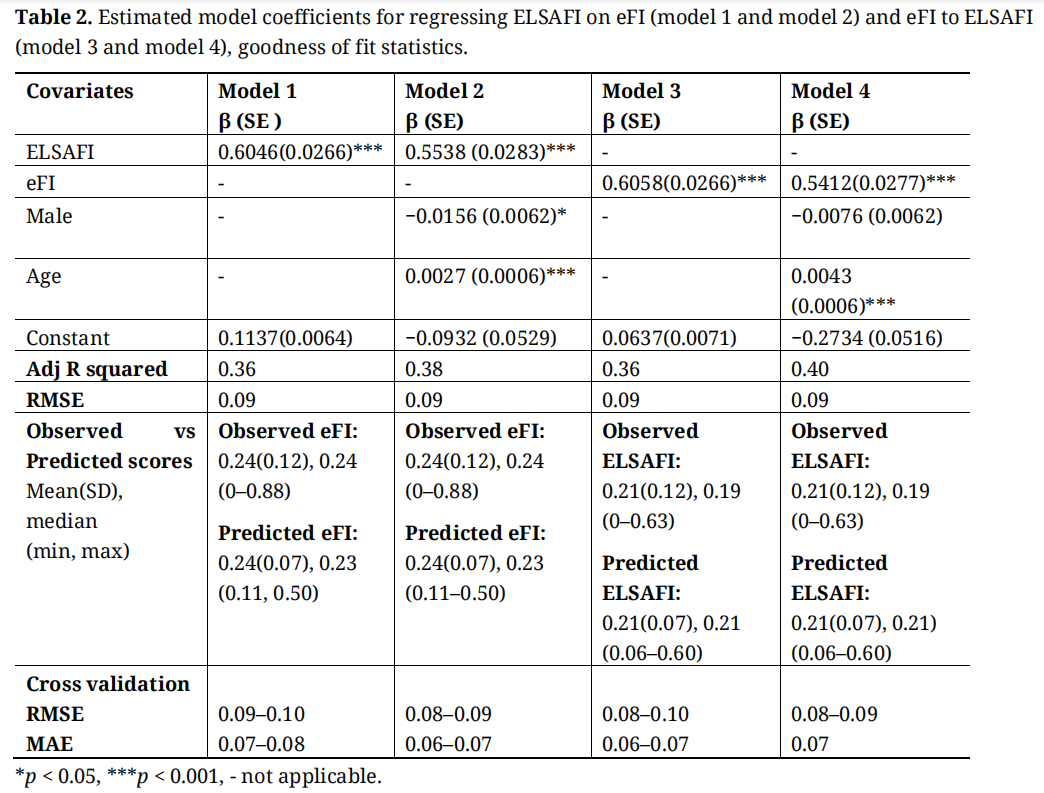 Table 2. Estimated model coefficients for regressing ELSAFI on eFI (model 1 and model 2) and eFI to ELSAFI (model 3 and model 4), goodness of fit statistics.
The coefficients for mapping ELSAFI onto eFI are shown in Table 2 (models 1 and 2). Both the coefficients for model 1 and 2 estimated the mean eFI scores accurately (0.24) compared to observed mean score (0.24) and both underestimated the variation in the scores (Table 2). Both models 1 and 2 over predicted the lower end of the eFI scale and underestimated the upper end (Table 2). The MAE for model 2 from cross validation was 0.07 (Table 2), which is more than the a priori minimum clinical important difference (MCID). Having average prediction error more than the MCID suggest that the mapping function for predicting eFI from ELSA predicts individual level eFI poorly.
Using coefficients from model 2, A male aged 83 years with ELSAFI score of 0.29 will have a predicted average eFI score of:
Predicted eFI scores = 0.5538 ELSA score + 0.0027Age – 0.0156 gender male −0.0932 = 0.28
Mapping eFI to ELSAFI Scores Model selectionThe results for mapping the eFI scores to ELSAFI scores are shown in table 2 (models 3 and 4). Model 3 shows the results for predicting ELSAFI from eFI. Age and gender were added to model 3 to produce results in model 4. Model 4 which included age and gender was preferred because it had a slightly higher adjusted R squared value of 0.40 compared to 0.36 for model 3.
Model coefficients and predictions: Mapping eFI onto ELSAThe mapping functions (model 3 and 4) for mapping eFI scores onto ELSAFI scores estimated the mean ELSAFI scores accurately (0.21) compared to observed mean score 0.21 and the variation was underestimated in both models (Table 2). The eFI to ELSAFI mapping functions over predicted the lower end of the ELSAFI scale and underestimated the upper end (Table 2). The RMSE value from the estimation sample was 0.09 in both models and the cross validation RMSE values were also similar (Table 2). The MAE from cross validation ranged from 0.06 to 0.07 for model 3 and 0.07 for model 4 (Table 2), indicative of poor individual level predictions of the mapping functions.
Using coefficients from model 4, a male aged 83 years with eFI score of 0.29 will have a predicted average ELSAFI score of:
Predicted ELSA scores = 0.5412 eFI + 0.0043 Age – 0.0076 gender male −0.2734 = 0.23
Figure 2 shows predicted and observed frailty scores for models 2 and model 4.
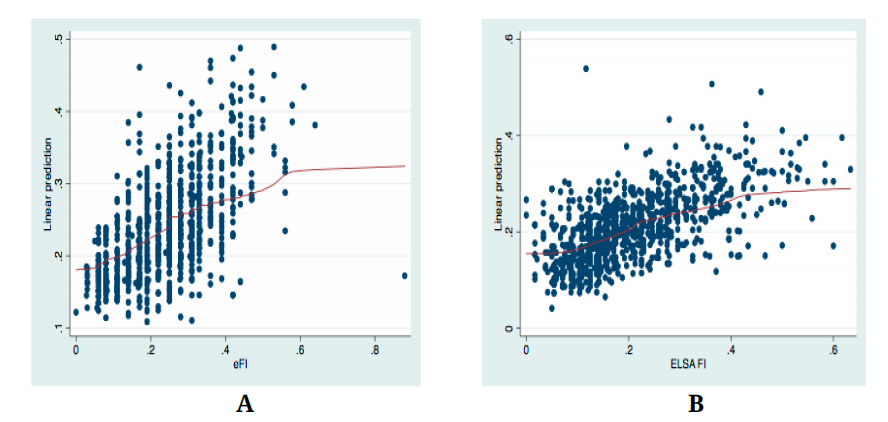 Figure 2. (a, b) Fitted and observed frailty scores for models 2 and model 4.
We have developed ELSAFI to eFI and eFI to ELSAFI mapping functions that accurately predicted the mean group scores, but not the individual level predictions. The prediction errors of the mapping functions based on RMSE and MAE values were both greater than the MCID of 0.05 that was used in this study to determine the accuracy of individual predictions. The variation of the predicted values for both mapping functions was lower than that of the observed scores.
Our study is to the best of our knowledge the first to estimate the relationship between eFI and ELSAFI scores. We are therefore not able to compare the performance of our mapping functions with other comparable studies. Similar to other mapping studies, we found that mapping is more accurate at the group level than at the individual level [6].
The possible reasons for poor individual level predictions from regression based mapping has been explored previously Fayers PM and Hays RD [17]. Poor individual level predictions has been attributed to a statistical phenomenon known as “regression to the mean”. Fayers and Hays (2014) explained that at individual level, due to “regression to the mean” patients with lower observed scores will have higher predicted scores closer to the mean and individuals with higher scores will be have lower predicted scores. Individual predictions based on OLS estimators are biased towards the mean. Similarly less variability in predicted scores compared to observed scores is due to “regression to the mean” (Fayers and Hays, 2014 [17]). The issue of regression to the mean has also been reported by other mapping studies that use regression based methods [16,18].
Other sources of poor individual level predictions include poor conceptual overlap between the source and target measures [6] and differences in severity ranges of the measurement scales. A mapping function may be inaccurate if the measures cover different health aspects [6]. In this present study, the examination of the dimensions measured by eFI and ELSAFI showed that they were similar dimensions between the two measures but the ELSAFI covers more activities of daily living compared to eFI.
We aimed to develop a mapping function that can be used at both individual and group level but our results showed poor individual predictions but good group level predictions therefore the mapping functions developed in this study can be used by other researchers or in clinical practice to predict overall average score for a cohort similar to CARE 75+. Mapping functions developed in this study will enable conversion of ELSAFI scores to eFI scores and vice versa for group-level analyses facilitating comparisons or pooling data from different cohorts or trial populations that use different frailty measures.
We used the MAPS guidelines for developing the mapping functions. The mapping functions were developed using regression techniques that are widely used and accepted for mapping purposes in economic evaluation studies. For this study, eFI scores are extracted directly from the primary care electronic health record after the initial face to face assessment. This means that researchers are unaware of eFI scores when collecting variables used to derive eFI scores. The large sample (n = 896) and wide range of recruiting sites across the UK increases the confidence in the reliability and generalisability of our results.
There are limitations to our study. Well-established MCID estimates are not available for FI measures, so we used recognised estimates obtained from alternative measures of overall health reported using a summary index approach as our benchmark. The MCID estimate of 0.05 for this study equate to a 5% change in FI scores for either the eFI or ELSAFI, and further research to establish robust estimates for MCID for measures of frailty will help interpretation of future study findings.
Mapping functions were developed based on total scores and not items. More research is needed to develop cross walks based on items using more complex methods such as item response theory models. There was no external sample to validate the mapping algorithms that were developed in this study. Future work will be necessary to externally validate the algorithms that we have developed.
There is considerable international interest in developing frailty measures based on routinely available EHR data. Differences in the way that international health record data are collected and coded means that the algorithms we have developed are not necessarily translatable to a global context. Future development of bespoke mapping functions at national level using the methods we have described will be necessary.
Mapping functions enable comparisons or pooling data from different cohorts or trial populations that use different frailty measures. The mapping functions developed in this study enable conversion of ELSAFI scores to eFI scores and vice versa for group-level analyses. This is an important step because the widespread availability of the eFI in UK primary care EHR systems means that it is now possible to begin to translate findings from observational research into routine clinical practice using these mapping functions. Furthermore, because research standard FIs have been shown to have consistent properties across large international research studies, the mapping function could help facilitate the implementation of future clinical trial findings that use research standard FI measures to identify study populations into routine clinical practice.
There is growing global interest in the development and implementation of FIs based on routinely available EHR data, and these methods provide a framework for investigators to develop suitably validated mapping functions to facilitate the future implementation of frailty research evidence internationally.
Appendix 1. Exclusions of the CARE75+ Dataset
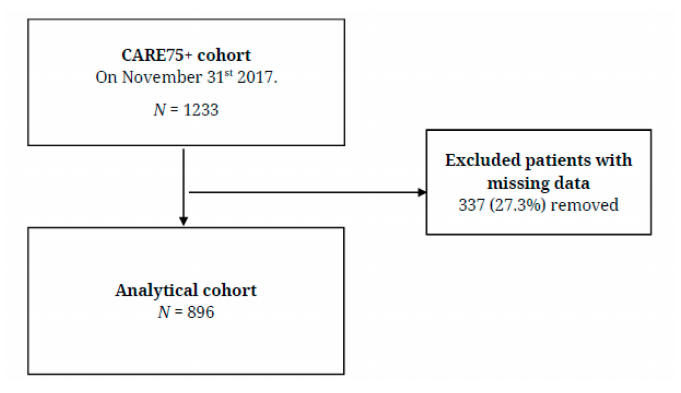 Figure A1. Diagram of Exclusions of the CARE75+ dataset.
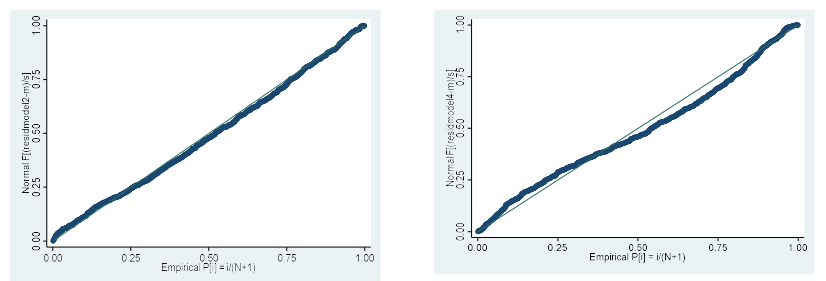 Figure A2. Normal probability plots of models 2 and 4.
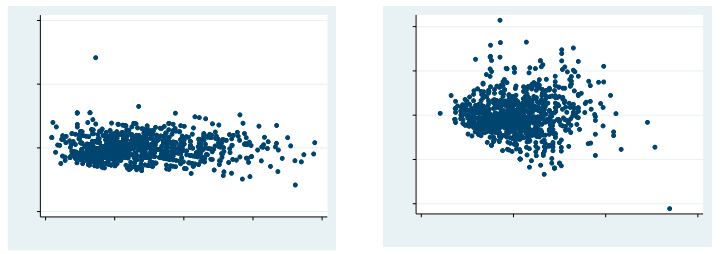 Figure A3. Residuals versus fitted values model 2 and model 4.
This is a secondary analysis. The original study, CARE 75+ was approved by the NRES Committee Yorkshire & the Humber-Bradford Leeds on the 10th October 2014 (14/YH/1120).
The datasets generated and analysed during the current study are not publicly available because ethical approvals were not obtained for sharing of datasets outside our research group, but are available from the corresponding author on reasonable request.
TM analysed the data and drafted the manuscript. AC, NP, and RW were involved in writing the manuscript. RW provided expert advice in interpretation of the results.
AC and NP provided expert clinical advice, and interpretation of results. All authors made critical revisions and provided intellectual content to the manuscript, approved the final version to be published and agreed to be accountable.
This paper presents independent research funded by the National Institute for Health Research (NIHR) under its Programme Grants for Applied Research Programme (Reference Number RP-PG-0216-20003). The CARE 75+ study is funded by the NIHR CLAHRC Yorkshire and Humber (www.clahrc-yh.nihr.ac.uk) and supported by the NIHR CLAHRC South West Peninsula and West Midlands CLAHRC. The views expressed are those of the author(s) and not necessarily those of the NHS, the NIHR or the Department of Health.
AC led the development, validation and national implementation of the electronic frailty index (eFI). Copyright and database rights for the eFI are held by the University of Leeds, with AC as named Principal Investigator (PI) lead. The eFI is licensed to providers of electronic health record systems under the terms of a license agreement stating that the named third party is free to implement the eFI on the basis that a premium charge is not then applied to the end user.
1.
2.
3.
4.
5.
6.
7.
8.
9.
10.
11.
12.
13.
14.
15.
16.
17.
18.
Munyombwe T, West RM, Pendleton N, Clegg A. Mapping between the Electronic Frailty Index and a Research Standard Frailty Index: Findings from the Community Ageing Research 75+ (CARE 75+) Cohort Study. Adv Geriatr Med Res. 2020;2(4):e200023. https://doi.org/10.20900/agmr20200023

Copyright © 2020 Hapres Co., Ltd. Privacy Policy | Terms and Conditions


