Location: Home >> Detail
Crop Breed Genet Genom. 2026;8(2):e260011. https://doi.org/10.20900/cbgg20260011
 ,
Kailan J. Kidder ,
James H. Weeks ,
Ashleigh Wall
,
Kailan J. Kidder ,
James H. Weeks ,
Ashleigh Wall
Plant Science Department, California State Polytechnic University, Pomona 91768, CA, USA
* Correspondence: Priti Saxena
Organic tomato production imposes distinct selection pressures because yield and fruit quality must be sustained with limited soluble nutrient inputs, higher biotic pressure, and greater environmental variability than in conventional systems. This review examines how these constraints reshape breeding priorities and identifies breeding and evaluation strategies that align with organic management. Evidence was synthesized from peer-reviewed studies and publicly available breeding reports on organic and low-input tomato improvement, with emphasis on trait targets, germplasm sources, and trial designs. Analytical approaches used to quantify genotype, environment, and management effects including multi-environment testing and mixed-model analyses of genotype × environment interactions are summarized alongside phenotyping methods relevant to organic systems. Across the literature, recurring priorities include durable resistance to major diseases and arthropod pests; improved performance under organically derived nitrogen; enhanced water-use efficiency; weed competitiveness; tolerance to heat and drought; and maintenance of sensory, nutritional, and postharvest quality. Reported strategies emphasize broadening genetic diversity through landraces, heirlooms, and wild relatives; pre-breeding and introgression; grafting and rootstock improvement; and decentralized, participatory selection to capture local adaptation. Overall, the evidence supports evaluating germplasm directly in organic environments and combining rigorous field designs with emerging phenotyping and molecular tools to accelerate delivery of resilient, high-quality cultivars for diverse organic production systems.
PPB, participatory plant breeding; TYLCV, Tomato Yellow Leaf Curl Virus; PGPMs, growth-promoting microbes; AMF, arbuscular mycorrhizal fungi; PGPR, plant growth-promoting rhizobacteria; SAR, systemic acquired resistance; ISR, induced systemic resistance; GDD, growing degree day; IPM, integrated pest-management; CSA, climate-smart agriculture; FAO, Food and Agriculture Organization; CSA, climate smart agriculture; GS, Genomic selection; MAS, marker-assisted selection; MAGIC, multiparent advanced generation intercross; QTLs, quantitative trait loci
Organic agriculture continues to expand globally and is driven by increasing consumer demand for sustainability, food safety, and transparency in production practices. In the United States, certified organic croplands increased by 79% between 2011 and 2021, reaching approximately 3.6 million acres, and the number of certified organic operations rose by over 90% during the same period [1]. Organic product sales also reflect this growth, totaling 11.2 billion dollars in 2021, a 13% from 2019 [2]. Organic tomato production presents challenges and opportunities that differ significantly from those in conventional systems. Organic production is governed by regulations that restrict most synthetic inputs and prohibit genetic engineering (“excluded methods”), increasing the need to breed cultivars with intrinsic stress tolerance, high nutrient-use efficiency, and other traits that support natural resilience and adaptability [3–5]. Key target traits include nutrient-use efficiency, broad-spectrum pest and disease resistance, and competitiveness against weeds [6,7].
Conventional centralized breeding approaches generally prioritize uniform performance in high-input environments, which often limits their relevance in organic systems. Organic farms frequently experience high variabilities in soil fertility, moisture availability, and biotic stress across locations and seasons [8–10]. In this context, decentralized breeding strategies such as participatory plant breeding and on-farm selection are more appropriate. These approaches empower farmers to select cultivars that are well-suited to local agroecological and market conditions, while also supporting the conservation of genetic diversity and seed sovereignty [11,12]. Therefore, breeding for organic systems must go beyond optimizing yield alone, with a holistic focus on sustainability, resilience, and adaptability to diverse and changing environments.
Comparisons of yield between organic and conventional systems remain a focal point in the debate on the viability and scalability of organic agriculture. Organic yields are often reported to be low, largely because of reduced nutrient availability and higher pest pressures. However, the yield gap is not fixed.
However, several comparisons have been based on short-term or plot-scale trials that fail to capture the full complexity of organic farming systems. These studies often overlook important factors such as spatial heterogeneity, long-term soil fertility dynamics, and adaptive management practices [13]. Meta-analyses estimate that organic yields are 19–25% lower on average than conventional yields, although this range varies widely by crop, region, and management strategy [14,15]. For tomatoes, yield penalties may be more significant under severe pest or nutrient stress. However, these disparities are not inherently due to the limitations of organic practices but infact reflect a systemic lack of breeding investment in organic conditions because most commercial varieties have been developed for high input conventional systems.
Growing evidence suggests that yield gaps can be narrowed when organic systems are supported by integrated fertility strategies, diversified cropping systems, or cultivars that are locally adapted or explicitly bred for organic management [6,16,17]. This highlights the critical role of targeted plant breeding in improving the productivity of organic systems while maintaining ecological integrity. Moreover, yield alone is not the only measure of success. Organic farms often offset lower yields through premium prices, reduced input costs, and access to differentiated markets, particularly for high-value crops like tomatoes [18]. When accounting for externalities such as soil degradation, pesticide runoff, and greenhouse gas emissions, organic systems frequently demonstrate profitability that rivals or exceeds that of conventional operations in the long term [18,19].
Without strong institutional support, farmer training, or policy incentives, the widespread adoption of these practices is constrained. Addressing these challenges requires a comprehensive strategy that combines organic-specific breeding programs, investments in infrastructure and knowledge systems, and market or policy mechanisms that reward the environmental and social benefits of organic systems [20,21].
Environmental assessments of organic systems offer a nuanced but generally favorable picture, particularly when impacts are measured per unit of land rather than per unit of output. Organic agriculture consistently performs well in terms of biodiversity conservation, soil health, and reduced energy inputs [22,23]. Broader system-level analyses have increasingly highlighted the potential role of organic farming in climate change mitigation and the transition to more sustainable food systems and security [23]. However, progress has been hindered by underinvestment in breeding programs specifically tailored to organic environments. Most varieties currently in use have been developed for conventional systems and lack critical traits such as efficient nutrient uptake, weed suppression, and tolerance to regionally important pests [6,24,25].
In addition to their agronomic and ecological benefits, organic tomatoes are also valued for their quality. Studies have shown that organic tomatoes often contain higher concentrations of soluble solids, lycopene, flavonoids, and vitamin C and lower levels of pesticide residues than their conventionally grown counterparts [26,27]. Together, these benefits provide a compelling case for increased investment in organic breeding research and the development of cultivars that meet the specific challenges and goals of organic tomato production.
Breeding strategies designed for organic agriculture are central to developing cultivars that thrive in low-input and stress-prone environments. Organic systems, which prohibit the use of synthetic fertilizers, pesticides, and genetically engineered organisms [3–5,28], require crops that exhibit strong natural resistance to pests and diseases, efficient nutrient uptake, and tolerance to environmental variability such as drought, heat, and poor soils [6]. These requirements shift breeding priorities toward complex and often underexplored traits such as root system architecture, early vigor, allelopathy, and resistance to multiple pathogens, which are rarely emphasized in conventional high-input breeding pipelines [6,24,29]. For instance, organically bred wheat varieties have demonstrated superior weed competitiveness and nutrient efficiency compared to conventionally bred varieties grown under organic conditions [6,10].
Organic plant breeding aligns with the ethical principles outlined by the International Federation of Organic Agriculture Movements, (https://www.ifoam.bio) which emphasize health, ecology, fairness, and care [6,30]. Unlike conventional breeding, which often optimizes performance for uniform, high-input systems, organic breeding must account for complex biotic interactions and heterogeneous environments [6,15,16,30]. Central to this framework is participatory plant breeding (PPB), a collaborative approach wherein farmers contribute to the selection process under real-world conditions. PPB enables a more dynamic understanding of G × E interactions and helps ensure that resulting cultivars are both agronomically relevant and socially appropriate [25,30,31]. This model also enhances farmer agencies, fosters co-development of locally adapted varieties, and integrates consumer preferences, fruit flavors and regional constraints into breeding decisions [32,33].
Despite growing interest, organic seed systems remain heavily dependent on conventionally bred varieties, many of which lack traits suitable for organic production. More than 90% of organic seeds originate from conventional breeding programs [24,25]. Strengthening regional seed networks and increasing public investment in organic breeding are essential for creating cultivars specifically adapted to organic farming systems.
To address complex traits, such as stress tolerance, nutrient efficiency, and fruit quality, organic breeding programs increasingly rely on advanced genomic tools [30,32,33]. The focus is on maintaining or enhancing fruit quality, nutritional value, flavor, shelf life, and consumer preference [34,35]. Under stress, metabolic pathways that affect antioxidants, flavor compounds, and nutritional metabolites may be altered. Breeding strategies and high-throughput phenotyping aim to preserve or improve these conditions under stress [18,36–38]. Recent advances in tomato breeding have prioritized enhancing both the nutritional quality and flavor by integrating molecular strategies, genomic tools, wild genetic resources, and metabolomic profiling [37]. Breeders target increased levels of lycopene, flavonoids, and vitamin C while selecting for improved taste through metabolite-based selection [38]. These efforts aim to produce cultivars that combine superior health benefits with consumer-preferred sensory attributes without compromising agronomic performance.
The intensifying effects of climate change, including rising temperatures, unpredictable rainfall, and declining water quality, pose serious challenges to organic tomato production, particularly in open-field systems). Abiotic stresses such as heat, drought, and salinity not only reduce yields but also compromise fruit quality and crop resilience. Breeding for these stressors within organic systems requires emphasis on trait stability, physiological tolerance mechanisms, and performance under on-farm conditions [36,38,39].
Heat tolerance in tomatoes involves both the reproductive and vegetative traits. The key traits included pollen viability, fruit set at high temperatures, canopy cooling, maintenance of membrane stability, and antioxidant activity. While cultivated tomatoes are generally heat-sensitive, wild relatives such as Solanum pimpinellifolium, S. pennellii, and S. peruvianum (Table 1) possess thermotolerant traits, including enhanced flowering under heat stress and cellular protection mechanisms [40]. Developing heat-tolerant cultivars for organic systems will require expanded screening of wild germplasms and QTL mapping under real-world heat stress conditions [36,40].
Drought tolerance is a multifaceted trait that involves water-use efficiency, root architecture, osmotic regulation, and phenological adaptation. Among its wild relatives, S. pennellii exhibited particularly strong drought resilience (Table 1), which is attributed to traits such as antioxidant activity, osmolyte accumulation, and improved water retention [41,42]. Participatory field trials continue to play a valuable role in identifying regionally adapted, drought-resilient tomato genotypes that reflect farmer priorities and agroecological conditions [18].
Salinity tolerance is becoming increasingly relevant because of declining irrigation water quality in tomato-growing regions. Wild species, including S. pimpinellifolium, S. cheesmaniae, and S. galapagense (Table 1) have demonstrated mechanisms such as ion exclusion, osmotic adjustment, and enhanced sodium-potassium homeostasis under saline conditions [43–45]. These traits offer promising genetic resources for breeding tomatoes capable of withstanding salinity stress in organic systems.
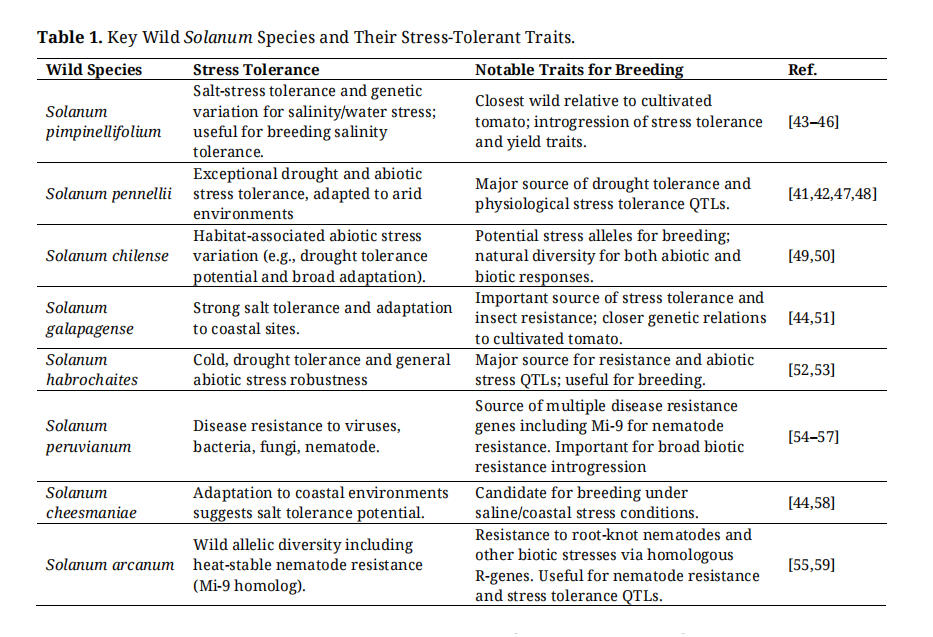 Table 1. Key Wild Solanum Species and Their Stress-Tolerant Traits.
Integrating these abiotic stress tolerance traits into cultivars optimized for organic production requires a synergistic approach that combines advanced genomics with phenotypic selection under field conditions. Continued collaboration with farmers is critical to ensure that the selected traits express their full potential in the diverse and often unpredictable environments that are characteristic of organic agriculture [6,11,24,60].
Tomato production is highly sensitive to climatic variability, and the open-field systems commonly used in organic agriculture are particularly vulnerable. Global average temperatures have already risen by approximately 1 °C above pre-industrial levels and are projected to exceed 1.5 °C by mid-century if current trends continue [61–63]. In California, a major tomato-producing region, inland areas are expected to face severe summer warming, which further exacerbates heat stress during critical growth stages [61,64,65].
Flowering is one of the most heat-sensitive phases of tomato development [62]. Elevated temperatures during this stage reduce pollen viability, disrupt fruit set, and increase flower abortion, leading to significant yield losses [61,64]. These heat effects can also shift fruit size and quality outcomes in both field and protected cultivation systems [66].
The co-occurrence of heat and drought further compounds the physiological stress. These conditions often induce conflicting plant responses, such as stomatal closure to preserve water, which simultaneously reduces transpiration and cooling capacity and intensifies stress effects [65,67].
Climate models predict that warming may enable the expansion of tomato production to new areas in the western United States. However, in established production zones, shorter growing seasons and faster crop cycles driven by rising temperatures may require the development of cultivars with modified phenological traits, including higher growing degree day (GDD) thresholds and altered flowering times, to maintain yield and harvest predictability [61,62].
Biotic StressesClimate change also alters the dynamics of pest and disease pressure in tomato systems, intensifying the biotic stresses that threaten crop health and yield. Rising temperatures can increase the reproductive rates and population densities of key insect pests, such as whiteflies (Bemisia tabaci) and spider mites (Tetranychus urticae), while simultaneously reducing the effectiveness of natural predators and parasitoids by disrupting life-cycle synchrony and heat-induced mortality [65,68].
One particularly concerning example is the spread and severity of Tomato Yellow Leaf Curl Virus (TYLCV, a whitefly transmitted begomovirus. Warmer and drier conditions accelerate whitefly reproduction and viral transmission rates while expanding the geographic range of both vectors and pathogens [69–71]. Heat and drought stress can suppress plant immune signaling pathways, including systemic acquired resistance (SAR) and induced systemic resistance (ISR), further increasing susceptibility to a broad array of pathogens [66,70]. Higher soil temperatures and poor drainage may promote the proliferation of soil-borne pathogens, such as Fusarium oxysporum and Ralstonia solanacearum, raising the risk of vascular and bacterial wilt in vulnerable fields [72,73].
These climate-driven shifts in pest and pathogen dynamics require adaptive and predictive integrated pest-management (IPM) strategies. Tools such as real-time forecasting, breeding for broad-spectrum resistance, and habitat conservation of beneficial arthropods are essential for building climate-resilient tomato systems [63,74,75].
Organic agriculture advances sustainability by protecting ecosystem integrity. It improves soil fertility and structure, reducing pollution and nitrate leaching, increasing carbon sequestration. It lowers lowering energy and greenhouse-gas footprints while also supporting social well-being and economic resilience through reduced pesticide harms, stronger rural employment, and smallholder livelihoods; governance is reinforced through certification, transparency, and traceability enabled by organic standards and labeling [17,22,23,76]. In parallel, FAO’s climate-smart agriculture (CSA) framework calls for integrated approaches that increase productivity, strengthen adaptation and resilience, and reduce emissions where feasible [77]. Together, these perspectives highlight why breeding and innovation priorities increasingly center on climate-resilient cultivars: tolerant to drought, heat, salinity, and erratic rainfall, since these traits are becoming essential for both organic and conventional systems under intensifying climate instability [16,63,76,78].
In organic agriculture, climate-smart breeding must also remain aligned with regulatory and ethical constraints that prohibit genetic engineering and gene-editing technologies such as CRISPR, as defined under the USDA National Organic Program and EU organic standards [3,4,79]. Organic-compliant breeding tools therefore include phenotypic selection under organic conditions, marker-assisted selection (MAS), genomic selection without transgenes, and participatory plant breeding [3,5,6,24,30,79]. These approaches support the development of cultivars with strong ecological fit and emphasize collaborative innovation among breeders, farmers, and seed stewards.
Accordingly, resilience-centered breeding frameworks are both technically and philosophically imperative in organic systems. Traits such as drought and heat tolerance, multi-pathogen resistance, nutrient-use efficiency, and microbial responsiveness must be prioritized alongside yield and quality. Critically, evaluation and selection must occur in organic environments, where soil biology, water stress, and pest dynamics differ from conventional conditions, making direct testing under organic management essential for reliable genetic gain [6,10,24,80]. Participatory breeding strengthens this alignment by embedding local knowledge and climate risk directly into selection decisions; when farmers co-evaluate and co-develop cultivars, varieties are more likely to be locally acceptable, resilient, and adaptable to climatic variability [11,31,60,81–83]. In this framing, climate stress is not a secondary constraint to manage after variety release, but a primary design criterion within organic breeding pipelines.
Although genetic improvements provide the backbone of long-term adaptation, their effectiveness increases substantially when breeding is integrated with climate-smart agronomy and agroecological practices that enhance ecosystem function and reduce vulnerability to extremes. This integration is especially important in organic and other low-input systems where synthetic inputs are restricted, and crops must perform under nutrient-limited, biologically complex conditions. Cultivars suited to organic systems often benefit from robust early biomass, deep and efficient root systems, and strong capacity to interact beneficially with soil microbial communities, traits that are particularly valuable under these constraints [6,23,24,80,84–87]. Complementary management practices such as mulching, cover cropping, compost amendments, diversified rotations, and efficient micro-irrigation improve soil structure, water retention, nutrient cycling, microbial activity, and water-use efficiency, buffering crops against drought and heat stress [38,64,88–94]. Cover crops, for example, can increase infiltration and soil organic matter, reduce nitrate leaching, suppress weeds, and enhance microbial activity; drip irrigation and organic or plastic mulches can conserve soil moisture in drought-prone systems [38,64,88–94]. When cover crops are used as green manure or live mulch alongside cultivars selected for nutrient-use efficiency, the combination can produce synergistic gains that sustain productivity under stress-prone conditions [80,89–93]. Research also shows that with improved management, compost and green manure use, diversified rotations, and ecological pest management, organic systems can achieve competitive yields [12,14,23,95]. Yet scaling remains challenging because several productivity-supporting organic practices, including compost-based fertility, participatory breeding, and multispecies rotations, require substantial time, labor, and expertise [11,21,60,96]. Even so, organic systems deliver key ecosystem services such as soil carbon sequestration, higher microbial diversity, and pollinator support [22,23,97,98], reinforcing the rationale for breeding targets that explicitly support these ecological functions.
A major emerging frontier within this integrated approach is microbiome-aware breeding. Soil microbial communities strongly influence plant stress responses, and plant growth-promoting microorganisms (PGPMs) including arbuscular mycorrhizal fungi (AMF) and beneficial rhizobacteria, which can enhance nutrient uptake, root function, drought resilience, and stress signaling [84–86]. Their effectiveness is often greatest when paired with soil-building practices like composting and cover cropping that support microbial abundance and diversity [77,84–87]. While many plant–microbe studies occur outside certified organic settings, their implications are highly relevant because organic production fundamentally depends on soil biology for fertility and pest management [6,86,99]. Evidence across tomato and other vegetables indicates cultivar-specific responses to microbial inoculants: some genotypes more consistently recruit beneficial microbes or translate those partnerships into improved growth, nutrition, and stress tolerance [65,87,100]. This creates a direct breeding opportunity for selecting genotypes with favorable root exudate profiles, stronger mycorrhizal responsiveness, or enhanced capacity for induced systemic resistance, particularly valuable in low-input systems where performance depends more on biological cycling than synthetic inputs [31,83,84,86,100]. Experimental findings further suggest that under low nutrient availability, tomato roots can shape rhizosphere communities to partially compensate for nutrient limitation, implying that “microbiome-assisted” performance is real and selectable [86]. The holobiont perspective, treating the plant and its associated microbiome as an integrated functional unit supports the conclusion that microbial recruitment and functionality are partly under genetic control and therefore accessible to breeding [94–96]. Because organic management often increases microbial diversity, soil organic matter, and aggregation compared with conventional systems [97], integrating microbiome-aware breeding with organic soil practices offers a practical pathway to productive, regenerative agroecosystems better buffered against climate variability [77,84–88,98,101].
Alongside microbiome-focused strategies, grafting is gaining renewed attention as a fast, non-transgenic method to increase stress tolerance and yield stability. Wild tomato relatives such as Solanum pimpinellifolium and S. cheesmaniae have shown potential as rootstocks that increase drought and salinity tolerance without compromising market traits [44,52,102–104]. Using rootstocks derived from wild relatives or stress-tolerant cultivars can improve abiotic stress tolerance (drought, salinity) and bolster resistance to vascular pathogens while maintaining fruit yield and quality [52,103–105]. In addition, grafting can enhance antioxidant activity, water-use efficiency, nutrient uptake, and stress signaling under extreme heat and drought; proteomic evidence suggests upregulation of antioxidant and defense pathways [103–107]. For organic systems, grafting with untreated, non-GMO materials offers a scalable resilience tool that can be deployed more rapidly than multi-year breeding cycles, while still aligning with organic standards.
Finally, organic farming is increasingly incorporating advanced but organic-compatible scientific approaches to accelerate resilience gains. Genomics-assisted breeding, MAS, and genomic selection can identify and propagate traits such as pest resistance, drought tolerance, and nutrient efficiency without transgenic modifications, enabling faster development of cultivars suited to organic constraints and stress patterns [24,30,78,80,108–111]. Emerging areas such as epigenetic strategies and stress priming offer additional promise: epigenetic modifications are heritable changes in gene expression that do not alter DNA sequence and may be induced by environmental stimuli, potentially improving adaptive responses without genetic engineering [112–114]. In parallel, “smart” organic agronomy, using sensors, drones, and AI-driven decision tools can support real-time monitoring of soil health, pest outbreaks, and crop development, enabling more precise interventions that maintain ecological balance while optimizing productivity [29,115–119]. Rather than displacing organic principles, these tools can enhance implementation by improving system responsiveness, reducing losses, and aligning management with field-level feedback [29,116–120].
Taken together, the emerging trend in climate-smart breeding for organic tomatoes is a shift from variety development as a standalone activity to an integrated, systems-oriented pipeline: organic-compliant breeding (MAS/genomic selection, on-farm and participatory selection), explicit targeting of stress-resilience and microbial responsiveness, rapid physiological gains through grafting, and tight coupling with agroecological practices that build soil function and water resilience[11,24,30,60,80,83,84,95,103,105,110]. This integrated approach aligns with CSA goals while remaining consistent with organic standards and values, positioning organic tomato systems to remain productive and regenerative under increasing climatic stress [17,23,24,60,76,78] (Figure 1).
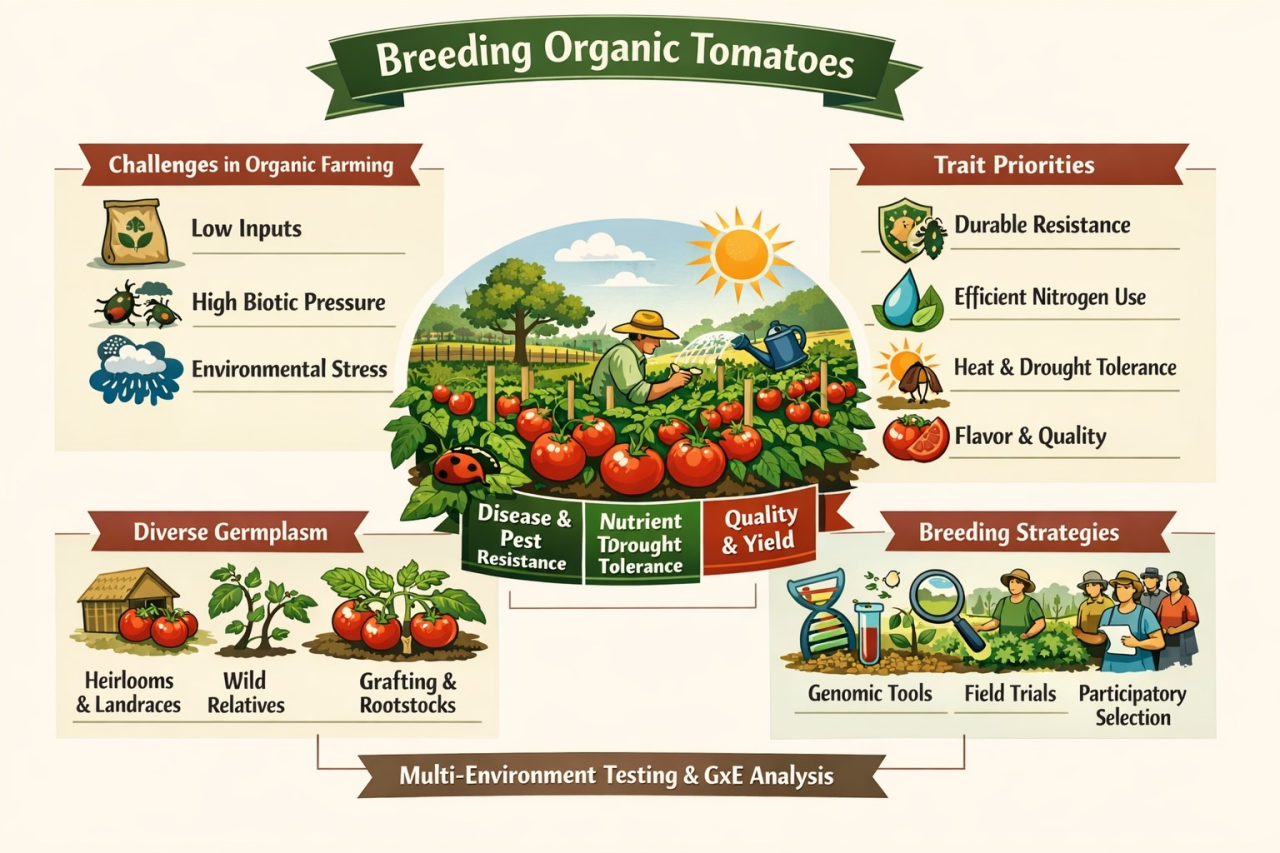 Figure 1. Integrative Framework for Climate Resilient Organic Tomato Systems.
With water scarcity becoming more acute, dry farming is gaining renewed interest, particularly among organic growers in arid and Mediterranean climates. Dry-farmed tomatoes, cultivated without irrigation, align well with organic principles of resource efficiency and soil health [120]. A recent project, Climate-Ready Crops: Coupling Dry-Farm Tomato Eco-Physiology with Farmer Adoption in California and Oregon (2025), is identifying key physiological traits for successful dry-farming, such as deep rooting, stomatal regulation, and water retention capacity [121]. Breeding organic tomatoes for dry-farmed and low-input systems means selecting plants that can maintain yield and quality when water, soluble fertilizers, and pesticides are limited, and when performance depends heavily on soil biology and site-specific management. Reviews of breeding for organic/low-input agriculture emphasize that key targets shift from “maximum yield under high inputs” toward yield stability, efficient capture of water and nutrients, and robustness to variable stresses, traits that are best identified by selection directly in organic, low-input environments, often with farmer participation [6,10,11,24,60,80,82,83].
For dry-farmed tomatoes specifically, research and extension work in coastal California and Oregon highlight that water stress can strongly increase physiological disorders (notably blossom-end rot) and lead to crop failure, so breeding priorities include stable fruit set and quality under limited irrigation, alongside traits that buffer plant water status (e.g., conservative canopy water use, effective rooting, and calcium-related fruit integrity) [36,41,64,66,120–122]. Current work coupling dry-farm tomato ecophysiology with farmer adoption in California and Oregon underscores the need to align physiological understanding (how plants use water and regulate stress) with on-farm practicality and adoption [120,121]. Organic dry-farm production guides also stress that variety choice is central to success under these conditions, reinforcing the breeding goal of cultivars that perform reliably under minimal supplemental water and organic management [122].
A useful framing for breeding is to treat “drought” as both soil drought (low soil water availability) and atmospheric drought (high evaporative demand, often described by vapor pressure deficit, VPD) [36,39,65]. Under organic, low-input field conditions, cultivars that regulate transpiration to avoid hydraulic damage and maintain carbon gain can be advantageous, and recent syntheses show that rising evaporative demand can substantially shape plant water loss and stress responses making it relevant to selection in warmer, drier seasons [18,36,39,65,123].
Breeding for dry-farmed and low-input organic tomatoes also benefits from targeting combined resource stresses, because water limitation often coincides with low nitrogen availability and restricted fertilizer options in organic systems. Recent work on tomato nitrogen use efficiency (NUE) shows that genotypes differ substantially in growth and physiological performance under low N, supporting NUE as a selectable breeding target for low-input conditions (e.g., maintaining biomass and function at reduced N supply) [6,24,80,124]. In parallel, drought-tolerance breeding can leverage wild-relative diversity and introgression materials: for example, studies using Solanum pennellii introgression lines show that drought tolerance expressed at early stages does not always translate across development, reinforcing the breeding need to evaluate drought response at vegetative and reproductive stages, the same stages that matter for dry-farm yield and fruit quality [52]. These initiatives reflect the broader paradigm of climate-smart agriculture (CSA), integrating breeding, agroecology, and farm-scale adaptation to ensure yield and quality stability under resource-constrained conditions.
Recent advances in genomics and precision breeding have redefined the potential of developing tomato cultivars tailored to organic and low-input systems. Technologies such as reference genome sequencing, pan-genomics, genome-wide association studies (GWAS), and metabolomics enable the dissection of complex traits, including fruit quality, flavor, nutrient use efficiency, and stress tolerance [32,38,125,126]. These tools help breeders reintroduce beneficial alleles from wild relatives into modern cultivars, thus improving their performance under both biotic and abiotic stress.
In a climate-smart context, these technologies are used to pyramid traits such as drought, heat, and salinity tolerance, with improved nitrogen use efficiency and yield stability across diverse environments [32,78,110,111,125]. Genomic selection (GS), marker-assisted selection (MAS), and pan-genome-based trait mapping are key innovations over conventional breeding methods, particularly under heterogeneous conditions typical of organic systems [30,32,108–111,125]. Multiparent advanced generation intercross (MAGIC) populations, which incorporate alleles from multiple diverse founders, provide an expanded genetic base and enable the high-resolution mapping of quantitative trait loci (QTLs). When combined with genotyping-by-sequencing and genomic selection, MAGIC populations support the identification and introgression of adaptive alleles into breeding lines tailored for organic and climate-resilient systems [37,108,111,127,128].
Additionally, high-throughput phenotyping (HTP) combined with machine learning and AI-based prediction models enables more rapid and precise selection of climate-resilient genotypes [37,115,116]. In salt-sensitive crops such as tomatoes, these genomic-assisted breeding platforms are paired with wild introgression strategies to develop cultivars with robust salinity tolerance [41,43–45,51,54,102,110]. Modern breeding programs increasingly employ genomic selection (GS), marker-assisted selection (MAS), and high-throughput phenotyping (HTP) to shorten breeding cycles and enhance accuracy [37,41,43,108,126]. These tools, especially when integrated with next-generation sequencing (NGS), high-throughput phenomics and AI-assisted analytics, allow for more efficient genotype-to-phenotype prediction and selection for multi-trait resilience [32,37,108,115,116,126,129].
Genome editing technologies, particularly CRISPR/Cas9, are rapidly gaining traction for the precise improvement of complex traits in tomatoes, such as heat and drought tolerance, disease resistance, and fruit quality [82,94,130]. Moreover, epigenetic mechanisms such as DNA methylation, histone modification, and chromatin remodeling emerge as critical but underutilized levers of stress adaptation. This may offer novel non-transgenic pathways for modulating resilience traits in organic systems [112–114,125,126].
Multi-environmental omics approaches combining genomics, transcriptomics, metabolomics, and proteomics with data (“envirotyping”) offer a holistic framework for climate-smart breeding (Table 2). These integrative pipelines enable breeders to anticipate future stress scenarios rather than react to historical patterns, thereby enabling the proactive development of robust cultivars tailored to organic and low-input systems [16,37,108,123,126].
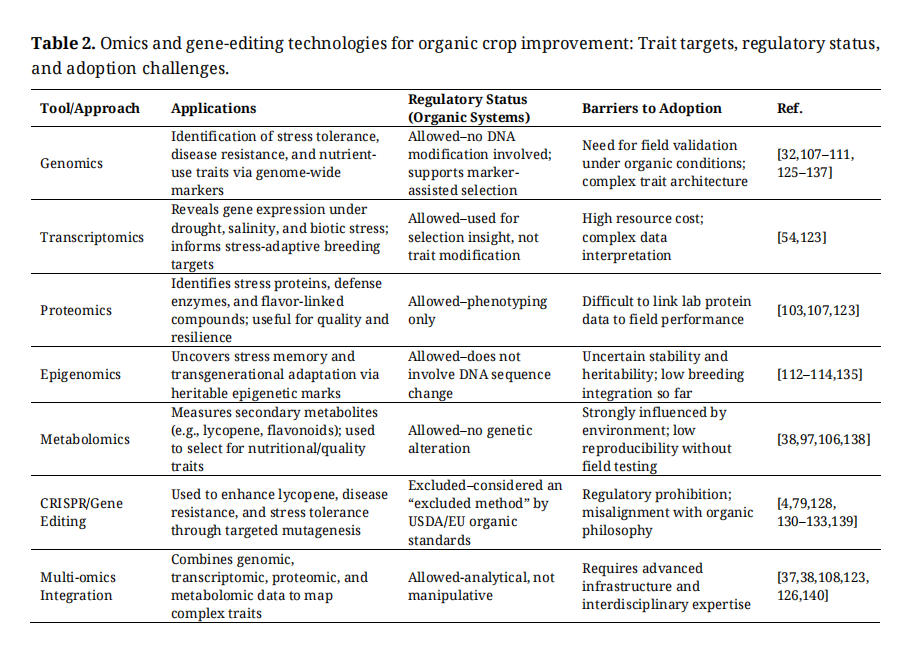 Table 2. Omics and gene-editing technologies for organic crop improvement: Trait targets, regulatory status, and adoption challenges.
In the United States, the current USDA National Organic Program (NOP) standards explicitly exclude CRISPR and other gene-editing technologies from organic certification. Organic products must be produced without the use of “excluded methods,” a regulatory category that broadly encompasses genetic engineering processes, including gene editing even when no foreign DNA is present in the final product [3,4,28]. These policies are rooted in the Organic Foods Production Act of 1990 and the subsequent NOP rule making [3–5]. Unless the definition of the excluded methods is formally revised through the National Organic Standards Board and USDA regulatory processes, crops developed using CRISPR cannot be labeled as organic in the U.S. [3–5,28].
In contrast, non-organic regulatory frameworks in the U.S. are evolving toward a more product-based model, where oversight focuses on the traits and risk profile of a plant rather than strictly on the process used to develop it. Under this system, some gene-edited crops that produce outcomes like those of conventional breeding face less stringent regulations, although debates on risk, transparency, and consumer trust continue [128,130,131]. Nevertheless, the exclusion of gene editing from organic certification remains a defining constraint for organic tomato breeding, shaping technologies that can be deployed directly in cultivar development, versus those that function primarily as discovery tools.
Governance structures, research investment priorities, and access pathways mediate the translation of scientific tools into farmer-accessible cultivars. Technologies such as CRISPR, metabolite profiling, and genomic selection can accelerate the discovery of key traits; however, their impact hinges on who controls these tools, who can access them, and how innovation systems are structured [16,128,130,131]. In organic systems, where ecological integrity, local adaptation, and farmer participation are core values, technical innovations must align with the principles of transparency, decentralization, and public-good orientation to be legitimate and adoptable [6,11,60,120,141–143].
Organic agriculture operates within a constructive dynamic between high-tech genomic innovation and a low-input, process-based philosophy that shapes what is considered “acceptable” breeding. Organic standards prioritize naturalness, precaution, and the integrity of biological processes, and they typically prohibit genetic engineering and gene editing (including CRISPR) as incompatible with organic principles and regulation [4,79]. This makes organic breeding more than a technical exercise; it is also an ethical commitment to transparency, traceability, and trust maintained through certification systems [17,23,76]. At the same time, climate volatility is increasing the need to develop cultivars with drought and heat tolerance and broader multi-stress resilience more quickly, goals that can benefit from data-intensive approaches that shorten selection cycles and improve prediction accuracy [6,16,76,78,108–111]. Seen this way, organic breeding is bridging between two poles as it is navigating how innovation can serve resilience while staying aligned with values-based standards.
This dynamic is most evident in the “middle ground” tools that many organic programs are increasingly using, including marker-assisted selection (MAS), genomic selection without transgenes, and advanced phenotyping. Because these approaches do not introduce foreign DNA, they can be aligned with organic principles while accelerating progress for complex traits in ways compatible with certified systems [6,24,30,108–111]. Even so, they can prompt important discussions within organic communities, particularly when high-tech breeding is linked to centralized seed control, proprietary data systems, or reduced farmer agency, concerns that sit uneasily with organic commitments to biodiversity, farmer participation, and local adaptation [6,76,141–143]. In response, many stakeholders emphasize participatory breeding and on-farm evaluation to keep innovation grounded in farmer priorities and organic field realities, ensuring that advanced tools strengthen low-input performance and system-level resilience rather than substituting for ecological management [6,11,60,81–83,143]. In this framing, genomic tools are welcomed when they clearly advance organic goals and when their use remains transparent and accountable within organic seed networks and certification cultures [6,30,60,81,141–143].
For example, metabolomics research can identify biochemical markers for flavor or nutrient quality valued in organic markets; however, its utility is limited if regional breeding programs and farmers lack access to germplasm and participatory networks that can translate this knowledge into cultivars available to growers [11,35,38,60,82,120,144,145].
Open-source breeding platforms, participatory seed systems, and sustained public investment are often prerequisites for innovation to support organic goals, particularly under climate stress and environmental heterogeneity [11,60,120,141–145].
Gene editing and metabolite studies are often cited as tools with the potential to accelerate trait development and improve quality. However, their direct application in organic breeding is constrained by certification standards. Genome editing provides strong causal inferences by linking specific loci to traits such as fruit metabolism and domestication. Multiplex CRISPR/Cas9 strategies have clarified how stacked edits can shift biochemical pathways, illustrating generalizable approaches for dissecting complex traits that rarely map to single genes [128,130,132,133]. For instance, the CRISPR-based redesign of tomato fruit metabolic phenotypes demonstrates the feasibility of modifying key quality components, and de novo domestication studies using CRISPR offer a rapid assembly of domestication and fruit quality traits from wild germplasm [132,133].
However, the primary utility of these discoveries in organic systems is indirect. Because gene editing is excluded under the USDA organic rules, CRISPR studies more often contribute to understanding gene function, validating pathway control points, and guiding marker development and allele mining in conventional or non-edited germplasms rather than producing organically certified cultivars [3,4,28,79]. This distinction matters: gene editing can accelerate biological understanding and prioritize targets for selection, but actual cultivar release for organic production must proceed through organic-compliant breeding routes such as marker-assisted selection, genomic selection without transgenes, and phenotypic selection under organic conditions [6,24,30,108–111].
Carotenoid pathway genetics and metabolite research offer a complementary evidence base that is directly relevant to organic breeding because it explains why traits, such as lycopene content, are environmentally contingent and linked to whole-plant performance [36,97,106,138]. Classical genetic dissection of carotenoid pigmentation, such as map-based cloning of Beta and old-gold color loci, shows that major-effect mutations can shift fruit carotenoid profiles, providing tractable entry points for quality improvement when usable allelic diversity is present in breeding germplasm [138,140]. At the same time, manipulating carotenoid pathways can result in pleiotropic effects, implying that targeting quality traits may carry trade-offs with growth or stress responses, particularly under variable fertility and pest pressure typical of organic systems [36,106,138].
Metabolomics and chemical-genetic mapping have highlighted the importance of genotype–environment interactions in fruit chemistry. A chemical genetic roadmap for tomato flavor demonstrates that metabolites associated with consumer-perceived quality reflect both the genetic architecture and production context, suggesting that stable improvement requires evaluation across environments relevant to target markets and management systems [35,38,106]. This perspective aligns with the broader crop literature emphasizing that complex traits central to climate resilience, such as drought tolerance, depend on integrated plant physiology and the environment, making multi-environment evaluation essential, especially in organic systems that experience more heterogeneous nutrient and stress profiles [6,10,18,24,36]. For organic tomato breeding, these studies support the practical conclusion that traits such as high lycopene content are not single endpoints, but part of interacting networks involving development, ripening biology, and environmental responsiveness that require selection and validation under organic conditions [35,36,138,140].
The compatibility of new breeding techniques (NBTs), including CRISPR/Cas9, cisgenesis, and epigenome editing, with organic principles remains a contested scientific and regulatory issue [29,81,112,128,130,135,146]. Proponents have argued that NBTs can accelerate the development of traits critical to organic systems, such as disease resistance, nutrient-use efficiency, and climate resilience, without the introduction of transgenes [11,128,135,146,147]. Because targeted mutagenesis can be functionally similar to natural mutation processes or conventional mutagenesis, the question of whether categorical exclusion is scientifically justified remains [30,78,130,128]. Critics argue that organic standards are fundamentally process-based and value-driven, emphasizing precaution, ecological integration, and avoidance of laboratory-based genetic manipulation. Consistent with this stance, both the U.S. NOP and EU interpretations continue to classify gene-edited organisms within prohibited genetic modification frameworks for organic certification [4,79]. Critics also raise concerns that the broader adoption of NBTs could reinforce corporate concentration of intellectual property, undermining seed sovereignty and decentralization goals central to organic agriculture [141–143,148]. Looking ahead, however, regulatory approaches may evolve particularly in Europe, where recent EU policy proposals have signaled possible movement toward more product-oriented treatment of certain gene-edited crops, which could reshape how breeders, seed systems, and organic standards negotiate NBTs over the next decade [79,149].
A consistent synthesis has emerged for organic tomato breeding. First, regulatory standards in the U.S. currently preclude CRISPR-derived cultivars from organic certification, making gene editing studies valuable as upstream discovery and prioritization tools rather than direct deployment pathways [3,4,28,79]. Second, lycopene and related quality traits must be treated as systems traits shaped by pleiotropy and genotype × environment interactions, reinforcing the importance of selection and validation under organic conditions and of managing trade-offs between nutritional quality and agronomic resilience [10,35,36,106,138]. Third, the translation of scientific insight into organic impact depends on seed-system capacity and governance, participatory and open models, public investment, and breeding freedoms that keep improved cultivars accessible and aligned with agroecological priorities [6,11,60,141–145]. In this view, the future of organic tomato breeding is defined not only by improved molecular and phenotypic tools but also by the institutions and rules that determine what organic farmers can use, what consumers will accept, and how innovation is governed [30,79,141–143].
The ongoing homogenization of commercial tomato seeds poses a major threat to the agrobiodiversity and adaptive capacity. As breeding and commercialization concentrate on increasingly similar pedigrees, the effective genetic base narrows, limiting breeders’ options for responding to rapidly evolving climate stresses [55,57,58,148]. In contrast, local landraces and heirloom varieties often retain traits, such as drought responsiveness, pest resistance, and sensory quality, which are uncommon or missing in elite hybrid pools. Participatory breeding that deliberately incorporates these materials can conserve threatened diversity, while generating cultivars tuned to regional stressors. For example, integrating an endangered Spanish tomato landrace into a participatory program in Catalonia helped strengthen local adaptation and protect the landrace from genetic erosion through expanded cultivation and farmer-led selection [31,58].
Beyond the immediate reduction in varietal diversity on the market, tomato breeding is constrained by genetic erosion within crops. Tomato diversity has been shaped by multiple “bottlenecks”: first through domestication, when only a subset of wild variation entered cultivation, and again through modern improvement, when selection strongly favored traits aligned with industrial handling and long-distance supply chains [125,148]. These repeated constrictions reduce the availability of alleles that buffer plants against stress, thereby increasing the likelihood of breeding programs recycling the same parental lines and resistance sources. Under accelerated climate volatility and pathogen evolution, repeated reliance can become brittle rather than resilient [125,148].
Erosion of genetic diversity in tomato breeding has significant implications for the development of resilient cultivars. When commercial breeding lines are derived from a narrow genetic base, the newly released cultivars often differ only marginally from their predecessors. This limits the breeders’ capacity to combine novel trait combinations or respond effectively when emerging stressors, such as new disease strains, altered temperature regimes affecting fruit set, or changing pest dynamics, challenge existing varieties. Reduced genetic diversity also contributes to a recurrent “boom-and-bust” pattern in resistance breeding. In such cases, a single major resistance (R) gene is widely deployed, exerting strong selective pressure on pathogen populations, which in turn adapt to and overcome resistance, leading to its eventual breakdown [73,75]. Marker-assisted selection (MAS) has traditionally been used to track these major R genes in breeding populations, offering a targeted approach for introgression resistance [108,109]. However, reliance on R-gene-mediated qualitative resistance often proves unsustainable over time because of the high evolutionary pressure it imposes on pathogens. In contrast, utilizing broader and more diverse germplasms, including lines with multiple resistance mechanisms and polygenic (quantitative) resistance, can support the development of cultivars with more durable, long-term protection [150,151].
Wild crop relatives are a key, but often an underutilized resource for broadening the tomato gene pool (Table 1). Wild Solanum species exhibit extensive genetic and phenotypic diversity [151], including alleles relevant to stress tolerance and pest and pathogen resistance, which are rare or absent in elite materials (Table 1) [55,56,58]. However, incorporating these resources into market-ready cultivars is not straightforward; wild accessions can introduce undesirable linked traits (e.g., small fruit, poor texture, and excessive vine growth), and crossing barriers or fertility issues can slow progress. This is where pre-breeding becomes essential creating bridging lines, introgression lines, or partially adapted populations that convert conserved diversity into breeder-ready material while reducing linkage drag [58,83,106,152]. Without sustained pre-breeding investment, GenBank accessions may be conserved, but remain functionally inaccessible to many applied breeding programs.
In this context, conserving genetic resources is not only about storage, but also about usability. Ex situ conservation can protect diversity from immediate loss; however, active evaluation, regeneration, and characterization are required to enable breeders to identify useful donors and efficiently deploy them [81,137,151]. On-farm (in situ) conservation complements this by keeping landraces and farmer-selected populations evolving under local conditions as assets for complex traits such as drought resilience or flavor stability across variable environments. Participatory and decentralized breeding approaches strengthen this link by directly selecting target environments and aligning breeding goals with local preferences, seed systems, and management practices, helping diverse varieties persist rather than replace them [11,31,82,83,145].
Modern breeding tools can help reconcile the tension between broadening diversity and maintaining agronomic performance. Marker-assisted selection and related genomic approaches can track donor segments during introgression, supporting the retention of beneficial alleles while minimizing unwanted donor DNA, and helping to stack resistance factors more strategically [125,108,109,150,152]. Similarly, designing breeding populations to maximize recombination, rather than repeatedly recycling closely related elites, can increase the odds of generating new combinations of stress tolerance and quality traits [126,127]. Importantly, these technical gains translate into real biodiversity outcomes only if breeding objectives and seed markets reward diversity by valuing regionally adapted cultivars, supporting shorter supply chains where flavor and specialty types matter, and maintaining public- or community-oriented programs that prioritize resilience and genetic stewardship alongside yield [31,55,56,58,148].
Collectively, the loss of tomato biodiversity is not merely a conservation concern; it directly shapes what breeders can achieve under climatic and disease uncertainties. Strategies that integrate landraces, heirlooms, and wild relatives supported by participatory selection, pre-breeding, and active conservation expand the trait “toolbox” available to breeders and reduce systemic risk in tomato production [31,58,83,145].
To enhance climate resilience in organic tomato systems effectively, breeding strategies must move beyond the limitations of short-term, controlled environmental trials and embrace long-term, ecologically relevant approaches. Multi-environmental and participatory breeding programs provide a more context-specific and socially responsive framework for cultivar development, especially in organic farming, where variability in soil, pest pressure, and climate is the norm rather than the exception [11,31,84,106,152]. Participatory plant breeding (PPB), which directly involves farmers in the selection process, has emerged as an effective plant breeding strategy. Rather than treating genotype × environment (G × E) interactions as statistical noise, PPB leverages them to identify genotypes with stable performance, local adaptation, and farmer-preferred traits under real-world organic conditions [11,60,81,101,125,117]. This approach not only improves agronomic relevance but also fosters farmer empowerment and knowledge exchange.
The decentralized and collaborative nature of the PPB also supports the creation of regionally adapted seed systems that are essential for escalating climate variability [6,11,91,125,142]. In organic agriculture, where commercial seed options are often limited and poorly matched to organic conditions, locally adapted seed systems promote genetic diversity, agroecological fit, and seed sovereignty [120,141,142].Open-source breeding initiatives and publicly accessible seed networks, such as those promoted by the Open-Source Seed Initiative (OSSI), ensure that improved germplasm remains in the public domain, free from restrictive intellectual property claims [141]. This is particularly important for organic systems that frequently operate with smaller market shares and are guided by strong ethical commitments to equity, biodiversity, and public goods. Strengthening community-led and open-access breeding models is therefore vital for aligning seed systems with the core values of organic agriculture [81,141,142].
Organic breeding benefits from decentralized and participatory approaches that enable direct selection in organic environments. These methods support the selection of genotype-by-environment (G × E) interactions and enhance local adaptation to diverse soil types, climates, and management practices. Participatory breeding produces cultivars with improved yield stability and enhanced tolerance to multiple stresses [11,60,81–83,102]. As climate change increases the frequency and severity of abiotic and biotic stress events, resilience traits prioritized in organic breeding may become increasingly valuable across both organic and conventional systems, thereby contributing to the development of more robust and climate-resilient agriculture.
Addressing the breeding needs of organic tomato systems requires deliberate policy interventions that realign funding priorities, enhance legal protection for farmer-managed seed systems, and modernize certification standards. Historically, public agricultural research funding has overwhelmingly favored high-input conventional systems, leaving organic-focused breeding under-resourced despite growing consumer demand. According to the Organic Farming Research Foundation [153] and related policy analyses, organic agriculture receives less than 2% of the USDA research funding, even though the organic sector accounts for more than 6% of total U.S. food sales and an even larger share (~15%) of produce sales [153]. While targeted programs, such as the USDA’s Organic Agriculture Research and Extension Initiative (OREI) and the EU’s Horizon Europe framework, provide some support, long-term and coordinated investments in organic-compliant breeding strategies remain fragmented. Dedicated funding streams are essential for building climate-resilient, socially embedded seed systems that serve organic producers and their communities.
In tandem with funding, policies that protect and promote seed sovereignty are critical for enabling farmers to maintain control over their genetic resources. National laws such as India's Protection of Plant Varieties and Farmers’ Rights Act (2001) and related legal and policy frameworks in Ethiopia and Nepal recognize farmers' rights to save, exchange, and breed seeds [154–156]. However, enforcement remains inconsistent and the corporate consolidation of seed markets continues to threaten local autonomy. Initiatives such as OSSI and community-based seed networks in the Global South provide viable alternatives by safeguarding access, innovation, and biodiversity in the seed sector [141,144,157]. These models are aligned with organic principles that prioritize decentralization, transparency, and long-term sustainability. Seed sovereignty and the rights of farmers and communities to save, use, exchange and breed seeds are particularly important in organic agriculture. Dependence on proprietary centralized breeding systems can erode local resilience and farmer autonomy, undermining organic value [141,142,157]. Thus, even when advanced breeding knowledge is generated, its relevance to organic tomato improvement depends on embedding innovation in inclusive governance models that support public research institutions, seed networks, and farmer cooperatives engaged in co-development and distribution of improved cultivars [139,141].
Decentralized seed systems play a crucial role in supporting resilient, equitable, and agroecologically aligned crop development, especially in regions where formal breeding and seed supply systems do not adequately serve smallholders or organic farmers. These systems emphasize local adaptation, farmer participation, and genetic diversity, aligning well with the goals of organic agriculture, which seeks to strengthen agroecosystem health and social equity. Unlike centralized commercial breeding pipelines, decentralized seed systems are often embedded within local knowledge networks and enable farmers to select and conserve varieties directly under real-field conditions, thereby enhancing relevance and ownership.
One widely cited example is from Syria, where the International Center for Agricultural Research in Dry Areas (ICARDA) implemented a participatory barley breeding program in collaboration with smallholder farmers [11,158]. In this approach, farmers select diverse genotypes in their own fields across multiple agroecological zones, leading to the identification of high-performing varieties under low input and stress-prone conditions. These decentralized selections not only outperformed centrally bred varieties in marginal environments but also empowered farmers as co-developers of genetic resources [11,158]. The success of this model has been replicated in other regions, particularly where organic and low-external-input agriculture is practiced.
Another compelling example is the network of community seed banks (CSBs) in Nepal, many of which are supported by the NGO LI-BIRD [144,159]. These CSBs serve as decentralized repositories for traditional and improved seeds, particularly for rice, maize, and millet landraces. They enable seed exchange among farmers and serve as vital sources of climate-resilient germplasm. Following the 2015 earthquake in Nepal, CSBs proved essential for recovery by quickly providing adapted seeds to affected farming communities, demonstrating the flexibility and resilience of farmer-managed systems [144,159]. Furthermore, CSBs in Nepal are often integrated with participatory plant breeding and biodiversity conservation initiatives, reinforcing their value not only for seed access, but also for long-term agroecological sustainability and seed sovereignty [144,159].
These case studies illustrate how decentralized seed systems can serve as a functional, locally adapted breeding infrastructure that aligns closely with organic values. They support a model of innovation that is collaborative rather than proprietary, evolutionary rather than prescriptive, and grounded in knowledge coproduction between farmers and researchers. Therefore, they offer both a practical and ethical framework for organic plant breeding in diverse agroecological contexts.
Integrating predictive modeling and data-driven tools offers transformative potential for breeding climate-resilient tomato cultivars, particularly in organic and low-input systems. One critical strategy involves coupling crops and climate models with genotype-by-environment (G × E) interaction analyses to forecast the impacts of future stress scenarios, such as elevated temperatures, irregular water availability, and increasing soil salinity. These models enable researchers to simulate varietal performance across diverse agroecological zones and under projected climate extremes, thereby guiding targeted selection and breeding priorities [37,61,126].
Advances in data science, remote sensing, and machine learning have reshaped the measurement and interpretation of complex traits. The integration of big data platforms with high-throughput phenotyping, such as drone-based multispectral imaging and hyperspectral analysis, allows for nondestructive, real-time monitoring of plant physiological responses to stress. When combined with environmental monitoring systems and detailed genotypic data, these approaches enhance the precision and speed of trait evaluation even under highly variable field conditions [29,37,129,115].
Artificial intelligence (AI)-enabled decision-support tools further improve the ability to model trait-environment interactions, optimize selection indices, and identify candidate genotypes with desirable trait combinations. Such systems are particularly valuable for addressing the unpredictable and nonlinear nature of climate change impacts on plant development and productivity [115,116,119,129].
The convergence of smart farming technologies with organic production offers new pathways for enhancing sustainability, resilience, and resource efficiency. Precision irrigation, IoT-based soil moisture monitoring, and machine-learning-based decision support systems can help optimize water use in tomato cultivation. A previous study [116] showed that deficit irrigation controlled by AI reduced water use by approximately 33% in processing tomatoes without compromising yield. Similarly, field trials using low-cost sensors, subsurface drip irrigation, and IoT-enabled controls demonstrated ~30% water savings with no yield penalty [117–119]. Integrating these technologies with drought-tolerant cultivars, genomics and agroecological practices (Table 3) can significantly strengthen the adaptive capacity of organic tomato systems [29,37,115–119,143].
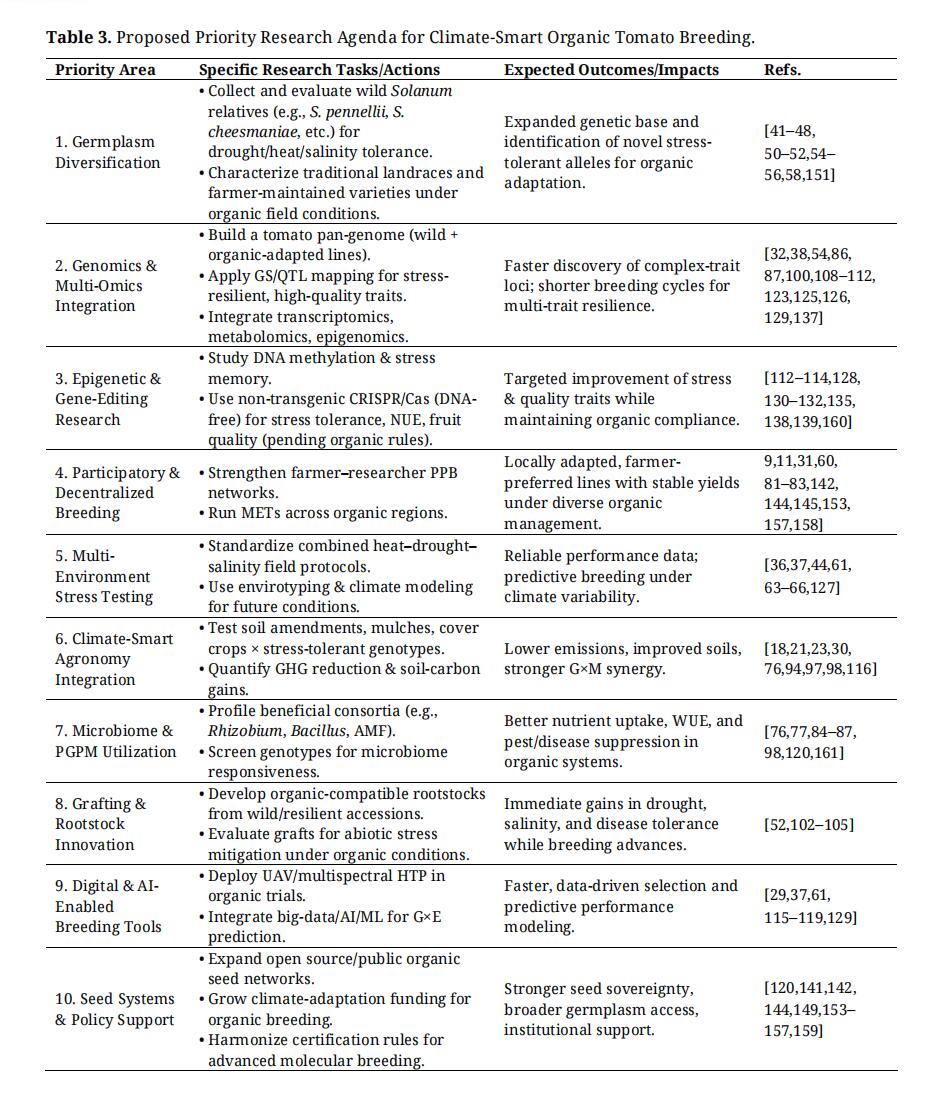 Table 3. Proposed Priority Research Agenda for Climate-Smart Organic Tomato Breeding.
In conclusion, organic tomato breeding is well positioned to become a model for climate-resilient agriculture more broadly because it is designed around whole-system performance: soil function, biological regulation, and stable yields under low-input, high-variability conditions, rather than relying on input substitution to buffer stress. As climate risks intensify, the organic emphasis on locally adapted genetics, on-farm evaluation, participatory innovation, and microbiome- and root-focused traits offers a scalable blueprint for resilience that can inform both organic and conventional breeding pipelines [6,11,76,81,86,87,98,100–102]. If these system-health priorities continue to guide cultivar development alongside organic-compatible genomic tools and agroecological management, organic tomato breeding can help define the next generation of climate-ready agriculture: productive, regenerative, and resilient by design, not by inputs.
No data were generated from the study.
The authors declare that they have no conflicts of interest.
This review was supported by USDA, subaward: A24-1314-S003.
The authors used ChatGPT (OpenAI, San Francisco, CA, USA) a generative artificial intelligence (GenAI) tool during manuscript preparation to assist with language editing and improving readability.
1.
2.
3.
4.
5.
6.
7.
8.
9.
10.
11.
12.
13.
14.
15.
16.
17.
18.
19.
20.
21.
22.
23.
24.
25.
26.
27.
28.
29.
30.
31.
32.
33.
34.
35.
36.
37.
38.
39.
40.
41.
42.
43.
44.
45.
46.
47.
48.
49.
50.
51.
52.
53.
54.
55.
56.
57.
58.
59.
60.
61.
62.
63.
64.
65.
66.
67.
68.
69.
70.
71.
72.
73.
74.
75.
76.
77.
78.
79.
80.
81.
82.
83.
84.
85.
86.
87.
88.
89.
90.
91.
92.
93.
94.
95.
96.
97.
98.
99.
100.
101.
102.
103.
104.
105.
106.
107.
108.
109.
110.
111.
112.
113.
114.
115.
116.
117.
118.
119.
120.
121.
122.
123.
124.
125.
126.
127.
128.
129.
130.
131.
132.
133.
134.
135.
136.
137.
138.
139.
140.
141.
142.
143.
144.
145.
146.
147.
148.
149.
150.
151.
152.
153.
154.
155.
156.
157.
158.
159.
160.
161.
Saxena P, Kidder KJ, Weeks JH, Wall A. Breeding Organic Tomatoes for Climate Resilience: Challenges, Adaptation, and Opportunities. Crop Breed Genet Genom. 2026;8(2):e260011. https://doi.org/10.20900/cbgg20260011.

Copyright © Hapres Co., Ltd. Privacy Policy | Terms and Conditions


