Location: Home >> Detail
J Psychiatry Brain Sci. 2026;11(3):e260006. https://doi.org/10.20900/jpbs.20260006

1 University Hospital of Psychiatry and Psychotherapy, University of Bern, 3008 Bern, Switzerland
2 Translational Research Center, University Hospital of Psychiatry and Psychotherapy, University of Bern, 3008 Bern, Switzerland
Major depressive disorder (MDD) has a complex pathophysiology and is one of the leading causes of disability worldwide. Treatment resistant depression (TRD) is associated with significant functional impairment, higher rates of suicidal behavior, and a higher risk of general and psychiatric comorbidities. It is well established that MDD is often associated with elevated levels of peripheral inflammatory markers, leading to neuroinflammation. There is frequent comorbidity of MDD with metabolic disorders, such as obesity and type 2 diabetes. Mounting evidence suggests that obesity is a risk factor for both inflammation and depression, and that white adipose tissue is a potential source of pro-inflammatory cytokines. The development of novel drugs with dual effects on both depression and inflammation would be of great interest for more efficacious and personalized treatment of MDD with underlying inflammatory and metabolic processes. This narrative review aimed to elucidate the impact of neuroinflammation and metabolic abnormalities on MDD pathophysiology. It provides insights into agents targeting inflammatory mechanisms related to MDD, such as nonsteroidal anti-inflammatory pathways, cytokine antagonism, N-methyl-D-aspartate receptor antagonism, modulation of the kynurenine pathway, and glucagon-like peptide-1 receptors. Moreover, this review illustrates the role of potential inflammatory biomarkers in improving TRD prevention and treatment.
ACh, Acetylcholine; BBB, Blood-brain barrier; BMI, Body mass index; CNS, Central nervous system; CRP, C-reactive protein; BDNF, Brain-derived neurotrophic factor; CVD, Cardiovascular disease; ECT, Electroconvulsive therapy; FDA, Food and Drug Administration; GIPR, Glucose-dependent insulinotropic polypeptide receptor; GLP-1RAs, Glucagon-like peptide-1 receptor agonists; IDO, Indoleamine-2,3-dioxygenase; IFN-γ, Interferon-γ; IL-6, Interleukin-6; HPA-axis, Hypothalamic-pituitary adrenal-axis; LAT-1, Large amino acid transporter-1; MDD, Major depressive disorder; MRI, Magnetic resonance imaging; NMDA, N-methyl-D-aspartate; NSAID, Nonsteroidal anti-inflammatory drug; NF-kB, Nuclear factor-kappa B; PCOS, Polycystic ovarial syndrome; RCT, Randomized controlled trial; SSRI, Selective-serotonin reuptake inhibitor; TAU, Treatment as usual; ta-VNS, Transcutaneous auricular-vagus nerve stimulation; TCA, Tricyclic antidepressant; TNF-α, Tumor necrosis factor-α; TRD, Treatment-resistant depression; T2D, Type 2 diabetes; VNS, Vagus nerve stimulation; 5-HT, Serotonin
Treatment-resistant depression (TRD) represents a significant treatment challenge, affecting 30%–50% of individuals with major depressive disorder (MDD) who do not respond sufficiently to at least 2 different classes of antidepressants at an effective dose for a sufficient treatment duration [1–3]. It is well established that TRD is associated with higher depression severity, increased disability, higher risk of suicidal behavior, increased prevalence of general and psychiatric comorbidities, and consequently, higher mortality rates [3–5]. An extensive investigation of the pathophysiology of MDD and the factors underlying treatment resistance may improve the prediction of treatment response and prognosis for selecting optimal antidepressant treatments.
The pathophysiology of MDD is complex and involves a wide range of biological, psychological, genetic, environmental, and social factors. The association between inflammation, MDD, and treatment resistance has been widely examined [6–11]. Several meta-analyses have indicated that elevated levels of pro-inflammatory markers, such as interleukin (IL)-6, IL-1β, tumor necrosis factor (TNF)-α, interferon (IFN)-γ, and C-reactive protein (CRP), may correlate with the severity of depression and treatment resistance [12–14]. IL-10 is an immunoregulatory, primarily anti-inflammatory cytokine and also has pro-inflammatory properties [15,16]. There is evidence that IL-10 alterations are associated with MDD [17].
Inflammation of the central nervous system (CNS) is crucial for brain functions. There is evidence that peripheral inflammation may affect the CNS by disrupting the blood-brain barrier (BBB) and activating microglia, the primary resident immune cells of the brain [14]. Microglia are crucial for neurogenesis, immune defense, and regulation of neuroinflammation. They can be activated by various stimuli, such as stress, brain injury, infection, and chronic systemic inflammation [18,19]. Microglial activation triggers the overproduction of pro-inflammatory cytokines, leading to the activation of the enzyme indoleamine-2,3-dioxygenase (IDO), which stimulates the kynurenine pathway, the primary route for tryptophan metabolism. IDO is the first enzyme in the kynurenine pathway and catalyzes the conversion of tryptophan to kynurenine [20–22]. Furthermore, kynurenine can be converted by other enzymes to different metabolites, such as neuroprotective kynurenic acid and neurotoxic quinolinic acid, which can bind to the N-methyl-D-aspartate (NMDA) receptor [23,24]. Glutamate acts as an excitatory neurotransmitter at the NMDA receptor and plays a central role in memory, mood regulation, and healthy brain functioning, whereas quinolinic acid can be considered a neurotoxin that leads to neuronal damage [25,26]. Quinolinic acid can induce overstimulation of NMDA receptors by increasing the release of glutamate and decreasing its reuptake by astrocytes [25,26]. Elevated levels of pro-inflammatory cytokines may also trigger the release of glutamate, resulting in a reduction in brain-derived neurotrophic factor (BDNF) production [24]. These pathophysiological mechanisms may lead to neurotransmitter imbalances and contribute to the development of MDD [27]. Elevated levels of pro-inflammatory cytokines can stimulate the activation of the hypothalamic-pituitary adrenal (HPA) axis, which plays a crucial role in the stress response and triggers glucocorticoid release [28–30]. Hypersecretion of glucocorticoids induces desensitization of central glucocorticoid receptors to the negative feedback inhibition of the HPA axis, resulting in excessive production of pro-inflammatory cytokines and dysregulation of the immune system [29,30]. Chronic activation of the HPA axis and consistently high cortisol levels may have metabolic effects, including increased appetite and insulin resistance, contributing to the development of obesity and type 2 diabetes (T2D) [31].
Dysfunction of the HPA axis and altered cortisol secretion may lead to dysregulation of inflammatory responses and generation of oxidative stress, resulting in cellular damage and neuroinflammation [32,33]. The effect of activated microglia on neurogenesis is disrupted by triggering neuronal apoptosis and suppressing neural stem cell proliferation [34]. Numerous magnetic resonance imaging (MRI) studies have indicated that chronic peripheral inflammation and HPA axis dysfunction are associated with a reduction in cortical gray matter and subcortical volumes, as well as decreased white matter integrity within neural circuits related to MDD [35]. A growing body of evidence has demonstrated an association between MDD and reduced hippocampal volumes due to inflammatory abnormalities and immune dysfunction [32,33,36,37].
Thus, neuroinflammation and immune dysfunction are important factors in the pathophysiology of MDD, particularly in the development of TRD. Efficacious and long-term treatment is only possible by tackling MDD at its root cause and resolving immune and inflammatory dysregulation [38]. The development of novel drugs with dual effects on both depression and inflammation would be of great interest for more efficacious and personalized treatment of TRD with underlying inflammatory processes.
This review aimed to provide insights into agents targeting inflammatory mechanisms related to MDD and elucidate the role of potential biomarkers of treatment response to improve TRD prevention and treatment strategies.
To the best of our knowledge, MDD is often associated with metabolic illnesses [39–41]. Insulin resistance and dyslipidemia may affect the development and course of MDD [42]. Several medical illnesses, such as obesity, T2D, cardiovascular disease, steatohepatitis, and cancer, are associated with poor responses to traditional antidepressants and the development of treatment resistance [43–45]. All these medical conditions are associated with elevated inflammation [43–45].
It is well established that lipid accumulation in the body leads to the activation of immune mechanisms. Lipid accumulation can trigger the secretion of pro-inflammatory cytokines, such as IL-6 and TNF-α, leading to chronic inflammation [46]. White adipose tissue is a key component of the endocrine and immune systems of the body. It plays an important role in the regulation of insulin resistance and the secretion of a large variety of proteins and hormones, such as leptin, chemokines, and pro-inflammatory cytokines [47,48].
Mounting evidence suggests that MDD is accompanied by elevated levels of inflammation and that white adipose tissue is a potential source of pro-inflammatory cytokines [46,48]. Meta-analyses have indicated a bidirectional relationship between depression and obesity and a complex interplay with inflammation [39,49]. However, other studies have not found a causal link between these factors [50]. Obesity may be a causal factor contributing to the association between inflammation and depression, but not in all affected individuals.
A recent study that examined the effect of body mass index (BMI) on cytokine levels in drug-naïve individuals with first-episode MDD revealed that overweight and MDD patients had significantly higher levels of IL-1α, IL-1RA, IL-3, and TNF-α than those with normal weight [51]. Furthermore, a positive correlation exists between BMI and serum levels of IL-1α, IL-3, IL-6, IL-10, IL-12, IL-15, and TNF-α in patients with MDD [51].
Obesity is a state of chronic, low-grade inflammation. The first pro-inflammatory cytokine identified to be overexpressed in the adipose tissue of obese mice was TNF-α in the early 1990s [52]. TNF-α levels may be correlated with the degree of obesity and insulin resistance. Therefore, TNF-α has been proposed as a potential treatment target for insulin resistance and T2D [52,53].
A recent study examining 135 antidepressant-naïve adolescents with MDD showed that overweight and obese adolescents had higher levels of IL-6, IL-1β, TNF-α, and IFN-γ than adolescents with MDD and normal weight [54]. Furthermore, adolescents who were overweight or obese had a more severe form of depression and a higher suicide risk than adolescents with normal weight. Therefore, the comorbidity of overweight and obesity may enhance the inflammatory status, contributing to treatment resistance, more severe depressive symptoms, and a higher suicide risk [54].
Selective serotonin reuptake inhibitors (SSRIs) are often prescribed as first-line treatments for MDD. They exert antidepressant effects primarily by blocking serotonin reuptake at the serotonin transporter and inducing downstream adaptive neurobiological changes, including receptor desensitization and increased neuroplasticity. Mounting evidence suggests that SSRIs have anti-inflammatory properties because the serotonin system is also involved in inflammation regulation [55–57]. Pro-inflammatory cytokines are known to lead to an increase in pre-synaptic serotonin reuptake by elevating the expression and activation of monoamine transporters [43]. In particular, the pro-inflammatory cytokine TNF-α regulates the activity and expression of antidepressant-sensitive serotonin transporters. A decrease in TNF-α levels is related to the reduced activity of serotonin transporters, influencing antidepressant efficacy [58,59]. Furthermore, there is evidence that pro-inflammatory cytokines lead to a decrease in serotonin synthesis by influencing the activity of enzymes such as IDO, which are responsible for monoamine production [43].
Mirtazapine is a noradrenergic and serotonergic antidepressant with an exceptional pharmacological profile. There is evidence that mirtazapine has anti-inflammatory properties and decreases TNF-α [60,61]. Mirtazapine is effective in treating MDD and depression associated with other illnesses, such as epilepsy, Alzheimer’s disease, stroke, and cardiovascular diseases [62]. It is assumed that the antioxidant and anti-inflammatory effects may mediate the promising effects of mirtazapine in different situations associated with MDD [62].
Tricyclic antidepressants (TCAs) exert stronger anti-inflammatory effects than SSRIs by affecting various inflammatory pathways. There is evidence that TCAs lead to modulation of toll-like receptor signaling, reduction of oxidative stress, and production of pro-inflammatory cytokines, including IL-6, TNF-α, IL-1β, and IL-18 [63–65]. However, TCAs also have side effects, including serious anticholinergic and cardiovascular effects. Their prescription requires caution and close monitoring, particularly in individuals with known cardiovascular diseases [66].
The pro-inflammatory cytokine TNF-α is considered a key player in the development and course of MDD and in the mechanism of antidepressant therapy. Mounting evidence indicates that a majority of individuals with MDD have elevated TNF-α levels and that antidepressants lead to a decrease [67,68]. Central administration of TNF-α leads to sickness behavior, and TNF-α blockade induces an improvement in depressive symptoms, as shown in previous animal models and clinical studies [67]. A recent study showed that after 2 and 12 weeks of antidepressant treatment, a significant improvement in depressive symptoms correlated with a significant decrease in TNF-α levels [68]. Thus, TNF-α may be a potential predictor of antidepressant treatment response in patients with MDD.
There is growing evidence that antidepressants affect the levels of inflammatory markers in the body. A study that examined the relationship between plasma cytokine levels and response to SSRIs showed that higher levels of TNF-α, IL-1β, and IL-6 predicted non-response to fluoxetine, and that a decrease in TNF-α levels correlated with an improvement in depressive symptoms after treatment with fluoxetine [69]. Yin et al. (2025) [70] indicated that SSRIs led to a decrease in IL-6, TNF-α, IL-1, IL-10, and CRP levels, which are associated with clinical improvement [70]. A recent meta-analysis demonstrated that antidepressant treatment led to a significant reduction in TNF-α levels, correlating with clinical improvement in depressive symptoms, and that responders had a significantly higher reduction in TNF-α levels than non-responders [13]. Mounting evidence suggests that TNF-α may be a promising biomarker for distinguishing patients with TRD from healthy controls and patients with MDD who respond to treatment [71,72]. Table 1 provides an overview of the influence of different antidepressant treatments on inflammatory marker levels.
However, the influence of antidepressants on cytokine activity is not always consistent, and cytokine levels can change independently of a patient’s response to treatment. A recent study that examined the effect of sertraline in adolescents with first-episode MDD revealed only a weak correlation between the decrease in IL-6 levels and depression severity and insufficient support to consider it a potential predictor of treatment response [73]. This study showed no significant relationship between baseline IL-1β and TNF-α levels and clinical response [73]. Many studies have shown a significant reduction in IL-6 levels with antidepressant treatment and no significant correlation with depression severity [12,74,75]. A meta-analysis of 22 studies revealed that some antidepressants reduce depressive symptoms without affecting cytokine levels [76]. This finding may be related to the large heterogeneity between the included studies that measured pro-inflammatory cytokine levels. In particular, different classes of antidepressants may have affected cytokine levels differently [76]. Treatment with certain antidepressants leads to a decrease in pro-inflammatory cytokine levels, whereas some other antidepressants have been reported to increase their levels or may not have any impact on their levels [77,78]. In patients with higher baseline peripheral inflammation, which is often associated with higher depression severity and longer duration of illness, pro-inflammatory cytokine levels may not decrease despite antidepressant treatment response [79,80]. Even if depressive symptoms partially improve after treatment with antidepressants, immune activation may still persist. Thus, persistently elevated inflammation may be a cause of depression recurrence, suggesting that targeting the underlying immune dysregulation through anti-inflammatory medications may be necessary for treatment.
Electroconvulsive TherapyMounting evidence has shown that electroconvulsive therapy (ECT) is a highly effective and fast-acting treatment for various mental disorders, including MDD. ECT is mainly used to treat patients with severe depression and treatment resistance, with response rates of 50–70% [81,82]. A recent network meta-analysis of randomized controlled trials (RCTs) indicated that ECT is the most effective therapy for TRD [83]. To the best of our knowledge, ECT modulates neurotransmitter levels, promotes neurogenesis, and reduces neuroinflammation by downregulating inflammatory markers and activating microglia [84,85].
A single ECT session induces rapid immune activation, leading to increased levels of pro-inflammatory cytokines such as IL-6, TNF-α, and IL-1β [86–90]. The acute release of cytokines following a single ECT session triggers the release of BDNF and stimulates neurogenesis, leading to an improvement in depressive symptoms [85,91]. Repetitive ECT sessions may cause long-term downregulation of the immune system [86–90].
Emerging evidence suggests that patients with MDD and an elevated immunoinflammatory profile are more likely to show resistance to traditional antidepressants and benefit more from anti-inflammatory medication and ECT [12,92,93]. Several studies have examined whether the levels of inflammatory markers before treatment can predict clinical improvement in response to ECT.
A recent meta-analysis showed that higher IL-6 and CRP levels were significantly associated with greater improvement in depressive symptoms over the course of ECT [94]. Kruse et al. (2018) [89] showed that higher pre-treatment levels of IL-6 were associated with a greater improvement in depressive symptoms, identifying patients with MDD most likely to benefit from ECT. A growing body of evidence suggests that ECT may have an acute effect on inflammatory cytokine levels, especially IL-6 levels, leading to a rapid increase after the first session, as well as a long-term effect, causing a decrease over the course of treatment in ECT responders [88–90,95]. The long-term effect of ECT on IL-6 levels may correlate with treatment outcomes, highlighting its potential as a biomarker of treatment response in patients with MDD [88–90]. Freire et al. (2017) [96] demonstrated that the combination of ECT with pharmacological treatment in patients with MDD led to a significant decrease in IL-6, highlighting its potential as a useful marker in depression, particularly if ECT is used.
ECT affects the levels of various cytokines. Sorri et al. (2018) [97] indicated a decrease in TNF-α levels after the first ECT session, which predicted a reduction in depressive symptoms at the end of ECT treatment. Another study showed elevated TNF-α levels in individuals with severe MDD and that clinical improvement post-ECT was associated with a significant reduction in TNF-α levels [98]. Falhani et al. (2025) [99] indicated that ECT induced an increase in TNF-α levels until week 4, which decreased after the end of treatment and was correlated with improvement in depressive symptoms. A recent study that examined the effect of ECT in adolescents with MDD revealed that a post-treatment decrease in IL-6 and IL-1β levels correlated with an improvement in depressive symptoms [100]. Kruse et al. (2020) [101] showed that lower baseline IL-8 levels and an increase in IL-8 concentration during ECT were related to an improvement in depressive symptoms in women, but not in men. Furthermore, increased kynurenine metabolite and IL-8 levels during ECT are associated with a reduction in depressive symptoms [94]. There is evidence of the involvement of the kynurenine pathway in the ECT response. ECT may suppress the neurotoxic branch of the kynurenine pathway by reducing quinolinic acid and shifting tryptophan catabolism towards compounds with neuroprotective effects, such as kynurenic acid, in patients with TRD [102,103]. Table 2 provides an overview of the different inflammatory markers as predictors of response to ECT and other antidepressant treatments.
Vagus Nerve StimulationThe effects of vagus nerve stimulation (VNS) have been investigated in numerous diseases, including neurodegenerative, psychiatric, inflammatory, and cardiovascular disorders. VNS has been approved for the treatment of refractory epilepsy and TRD.
Traditional VNS involves the surgical implantation of a device under the skin of the chest, which sends electrical impulses to the left cervical vagus nerve and transmits signals to the nucleus tractus solitarius in the brainstem with secondary projections to mood-regulating areas [104,105] VNS modulates the release of neurotransmitters, especially by activating neurons in the locus coeruleus to release norepinephrine [106]. VNS affects the gut-brain axis and promotes neuroplasticity [105,107]. Moreover, VNS exerts anti-inflammatory effects through different pathways that may contribute to its antidepressant action [107–109]. It stimulates the HPA axis via vagal afferent fibers, leading to the release of cortisol, which has anti-inflammatory effects [110]. Furthermore, the cholinergic anti-inflammatory pathway is activated by vagal efferent fibers, leading to the release of acetylcholine (ACh). The primary vagal neurotransmitter ACh inhibits macrophages from releasing pro-inflammatory cytokines, thereby reducing inflammation [110,111]. Mounting evidence indicates that VNS added to treatment as usual (TAU) for TRD has greater response and remission rates and longer-lasting effects than TAU alone [112–116]. A recent study showed that VNS has long-term efficacy in TRD by increasing BBB integrity and reducing the levels of inflammatory markers [108]. The use of VNS led to long-lasting improvement in depressive symptoms and a significant reduction in IL-7 and several chemokine levels [108]. Kavakbasi et al. (2024) [117] showed that after 6 months of VNS, the levels of IL-6, IL-8, IL-1β, TNF-α, IFN-α2, and IL-33 were lower than the baseline levels and were lower in VNS responders than in non-responders. However, this difference was not statistically significant [117]. A meta-analysis of 26 studies revealed that VNS decreased the levels of most pro-inflammatory cytokines without reaching statistical significance [118]. A subgroup analysis of 4 long-term studies investigating acute inflammation demonstrated that VNS led to a significant decrease in CRP levels compared to sham stimulation [118]. A recent meta-analysis indicated that VNS modulates inflammatory markers, and different VNS techniques may affect specific cytokines [119]. Transcutaneous auricular (ta)-VNS affects IL-1β and IL-10 levels, whereas invasive cervical VNS affects IL-6 levels [119].
Due to the high costs and invasiveness of device implantation, an innovative and less invasive method using ta-VNS was developed, which stimulates the vagal nerve branch in the earlobe. There is evidence of a significant antidepressant effect of ta-VNS in patients with TRD [120,121]. However, data on the effectiveness of ta-VNS in TRD are still limited, and further RCTs are needed to confirm these findings.
VNS is effective against many illnesses, such as rheumatoid arthritis, cardiovascular disease, stroke recovery, Alzheimer’s disease, and Parkinson’s disease [122–125]. There is evidence for the effectiveness of VNS in the treatment of post-stroke depression [126], and it holds promise as a potential therapy for motor and non-motor symptoms, such as depression, in Parkinson’s disease [127].
VNS has a broad spectrum of clinical applications based on multifactorial mechanisms of action, including the modulation of neurotransmitters, neural plasticity enhancement, brain metabolism regulation, and the cholinergic anti-inflammatory pathway [128,129]. The anti-inflammatory properties of VNS are not considered the primary mechanism of action, but they may contribute to its overall antidepressant potential, particularly in patients with MDD and underlying chronic inflammation [108].
KetamineThe NMDA receptor antagonist ketamine is a dissociative anesthetic agent with analgesic and anti-inflammatory properties that primarily acts by blocking glutamate transmission at the NMDA receptor. Mounting evidence indicates rapid antidepressant and anti-suicidal effects, underlining its promising role in the emergency treatment of severe depression and acute suicidality [38,83,130–134]. Ketamine has various properties, such as therapeutic effects through anti-inflammatory actions on the HPA axis and the kynurenine pathway [135]. To the best of our knowledge, ketamine decreases the enzyme IDO and reduces microglial quinolinic acid production, which is part of the neurotoxic branch of the kynurenine pathway [130,136]. Ketamine induces a rapid increase in BDNF release, thereby enhancing neural plasticity [137]. Moreover, ketamine exerts modulatory effects on inflammatory blood marker levels [131,138]. Adipokines, such as adiponectin and leptin, may play a role in these therapeutic effects [139,140]. The higher the BMI, the better the response to ketamine in patients with TRD [141].
A growing body of research indicates that ketamine leads to a rapid reduction in depressive symptoms associated with changes in cytokine levels in patients with TRD [131,138,142]. Just 30 minutes after administration, ketamine can trigger antidepressant and anti-suicidal effects in patients with TRD, lasting for up to 7 days [38]. According to a recent meta-analysis, a strong ketamine effect was observed within 4 h after the administration of the first infusion, which peaked at 24 h in patients with TRD [134]. Szalach et al. (2025) [143] demonstrated that ketamine led to a transient increase in IL-6 levels 4 hours after its first administration and a significant reduction 24 h later, while levels of the anti-inflammatory cytokine IL-10 decreased after 4 h and increased 24 h post-administration. The levels of IL-8 decreased 4- and 24 h post-ketamine administration, and this reduction was maintained throughout the treatment [143]. A double-blind RCT revealed that the decrease in TNF-α levels 40 min post-infusion correlated positively with a reduction in depressive symptoms [142]. Furthermore, there was a significant association between alterations in IL-6 levels and clinical response, and a higher baseline inflammatory state was associated with a better response to ketamine [142]. Another recent study indicated the downregulation of several inflammatory markers during ketamine treatment and that changes in IL-6 and IL-17A levels were related to a reduction in depressive symptoms [138]. Zhou et al. (2021) [144] showed that patients with TRD and chronic pain had a better ketamine response and remission rate than patients without pain and that alterations in IL-6 levels correlated with an improvement in depressive symptoms and pain intensity. Baseline IL-8 levels may be associated with the response to ketamine administration. Increased IL-8 levels correlate with a decrease in depressive symptoms in females and the opposite in males [145].
Ketamine consists of equal amounts of 2 enantiomers, (S)-ketamine (esketamine) and (R)-ketamine (arketamine), which exhibit different pharmacological profiles [146]. Esketamine has a much higher affinity for the NMDA receptor and can be administered as a nasal spray. In 2019, the FDA approved esketamine as a nasal spray with the brand name Spravato® in conjunction with an oral antidepressant for the treatment of TRD. The study by d``Andrea et al. (2025) [147] demonstrated that esketamine leads to significant improvements in anhedonia in patients with treatment resistant bipolar and unipolar depression. Both ketamine and esketamine have a significant effect on depressive symptoms and suicidality [148]; however, remission can be achieved significantly faster with intravenous ketamine [149]. Similar to ketamine, esketamine exerts anti-inflammatory effects. There is evidence from a mouse model that esketamine treatment can reduce chronic viable stress-induced depression-like and anxiety-like behaviors by normalizing the expression of pro-inflammatory cytokines [150]. A recent study that investigated the inflammatory response to esketamine in patients with TRD revealed significant CRP reductions and that the inflammation group had a greater reduction in depressive symptoms that was not statistically significant [151]. Arketamine has less clinical evidence compared to esketamine and is primarily in preclinical and clinical research. There is evidence from animal studies that arketamine may have stronger and longer lasting antidepressant effects and lower side effects than esketamine [152,153]. A recent clinical study showed that a single intravenous infusion of arketamine caused a rapid reduction in depressive symptoms in 7 patients with TRD 24 h after administration [154]. A more recent RCT with 10 participants indicated that arketamine was not superior to placebo for TRD [155]. There is a need for RCTs with larger sample sizes to confirm these findings. There is evidence from animal models that arketamine may have a modulating effect on demyelination and activated microglia, suggesting its potential to treat multiple sclerosis [146,156]. Furthermore, arketamine has shown beneficial effects in animal models of different neurological disorders, including stroke, Parkinson’s disease, and Alzheimer’s disease [146]. Arketamine is a weaker NMDA receptor antagonist than esketamine and may provide antidepressant effects primarily by stimulating BDNF expression and anti-inflammatory properties [146,157]. However, the exact molecular mechanisms underlying the antidepressant effects of arketamine remain unclear [146,153].
PsychedelicsIn recent years, psychedelics have gained increasing importance as a treatment for mental disorders. Emerging evidence suggests that psychedelics exert rapid and long-lasting antidepressant effects and induce neuroplasticity [38,158]. Psychedelics exert agonistic effects on serotonin (5-HT) receptors and exhibit a very high affinity for the 5-HT2A receptor. They modulate microglial activity, regulate the production of pro-inflammatory cytokines, and enhance neuroplasticity by interacting with 5-HT2A receptors [158,159].
The 5-HT2A receptor is the most prevalent serotonin receptor in the body and brain, with a high concentration in the neocortex [160,161]. Its activation has a modulatory effect on mood, cognition, perception, memory, and various mental disorders [162]. In vivo and in vitro studies have shown that activation of the 5-HT2A receptor by psychedelics may induce a potent blockade of TNF-α-induced inflammation, inhibit IL-1β and IL-6 activity, and suppress nuclear factor-kappa B (NF-kB), which is responsible for the transcription of pro-inflammatory cytokines [162,163].
Psilocybin is a naturally occurring psychedelic compound produced by certain types of mushrooms worldwide. It is the most widely used psychedelic drug in humans for therapeutic purposes. Psilocybin has been recognized as a “breakthrough therapy” by the U.S. Food and Drug Administration (FDA) for the treatment of MDD and TRD [164]. A growing body of evidence indicates that psilocybin has the potential to improve depressive symptoms in patients with TRD [164–166]. It is fast-acting and has an extended treatment effect that may last from 6 months to one year [164–166]. A double-blind RCT that examined the effect of psilocybin in patients with advanced or terminal cancer indicated that high-dose psilocybin led to improvements in depressive symptoms, death anxiety, and quality of life [167]. There is evidence that psilocybin may have the potential to treat chronic pain conditions, such as phantom limb pain, cluster headache, fibromyalgia [168], cancer-related pain, and psychological distress [169]. A recent clinical trial that examined the effect of psilocybin on the immune status of healthy individuals compared to placebo showed an immediate reduction in TNF-α levels, whereas the levels of other inflammatory markers remained the same [170]. Seven days later, IL-6 and CRP levels decreased persistently, and TNF-α levels returned to baseline in the psilocybin group. Moreover, the reduction in IL-6 and CRP levels positively correlated with beneficial effects on mood and social activity [170]. DiRenzo et al. (2024) [171] showed that treatment with psilocybin for ≤ 1-week led to increased levels of IL-8. At ≥ 4-weeks after treatment onset, no changes in cytokine levels were found [171]. Lysergic acid, diethylamide, and dimethyltryptamine also modulate neuroinflammation by interacting with 5-HT2A receptors [159]. A double-blind RCT showed that treatment with the psychedelic ayahuasca, containing the compound dimethyltryptamine, led to a significant improvement in depressive symptoms, correlating with a decrease in CRP levels in patients with TRD compared to placebo 48 hours after administration [172]. A current review measuring the impact of psychedelics on inflammatory markers revealed a reduction in the levels of at least one inflammatory cytokine in 29 of 36 studies [166]. However, some studies have indicated no significant changes in inflammation biomarkers after the administration of psychedelics in patients with MDD [166,173].
Mounting evidence suggests that anti-inflammatory agents, such as nonsteroidal anti-inflammatory drugs (NSAIDs), may exert antidepressant effects. NSAIDs exert anti-inflammatory properties by inhibiting cyclooxygenase, which prevents the production of pro-inflammatory lipid prostaglandins. Several meta-analyses have indicated the antidepressant effect of NSAIDs, such as celecoxib, as an adjunctive treatment, especially in patients with high levels of baseline inflammation [174–176]. A recent meta-analysis has shown that celecoxib used for 6 weeks as an add-on treatment exerts antidepressant effects in patients with MDD. However, celecoxib has shown no significant antidepressant effects in bipolar depression [177]. Another meta-analysis showed that add-on treatment with celecoxib may improve the effects of major treatment in patients with bipolar disorder [178]. Moreover, celecoxib has been shown to be effective as an adjuvant therapy for the treatment of manic episodes in bipolar disorder [179]. The mood-stabilizing effect of celecoxib may be mediated by its anti-inflammatory properties [179]. To the best of our knowledge, NSAIDs inhibit general inflammatory mediators but do not affect CNS-specific pathways. Therefore, their antidepressant effects may be limited. Long-term studies with large sample sizes are lacking to prove their efficacy as monotherapies in patients with severe MDD or TRD.
Anti-Cytokine DrugsAnti-cytokine drugs, such as monoclonal antibodies, also termed “biologics,” represent the class of anti-inflammatory agents with the most promising antidepressant effect, specifically targeting key cytokines and inflammatory pathways involved in the development of MDD [74]. The RCT by Raison et al. (2013) [180] did not show a generalized antidepressant effect of the TNF-α antagonist infliximab in patients with TRD. However, in a subgroup of patients with TRD and higher baseline inflammation (CRP > 5 mg/L), infliximab had a superior effect on depressive symptoms compared to placebo [180]. A more recent RCT revealed that infliximab had no superior antidepressant effect compared to placebo, whereas secondary analyses indicated that depressed patients with childhood trauma experienced a significant improvement in depressive symptoms compared to the placebo group [181]. Monoclonal antibodies against IL-6 and IL-17 also exert antidepressant effects [74]. A study by Sun et al. (2017) [182] revealed that the administration of IL-6 monoclonal antibodies, sirukumab and siltuximab, led to a significantly greater improvement in depressive symptoms than placebo in patients with inflammatory illnesses. The reduction in depressive symptoms by sirukumab correlated positively with IL-6 levels, suggesting that IL-6 may be a promising target for the treatment of MDD [182]. Moreover, it should be considered that improvements in depressive symptoms in patients with inflammatory diseases may be partially mediated by the amelioration of physical symptoms following anti-inflammatory treatment. The resolution of disability, fatigue, and chronic pain from inflammatory disorders may directly impact mental health and lead to relief, increased well-being, and a better quality of life.
Mental disorders, especially MDD, are common in patients with cardiovascular diseases (CVD). There is evidence that CVD and MDD may have a bidirectional relationship, and that comorbid MDD may increase the risk of cardiac mortality [183]. To the best of our knowledge, statins are cardioprotective mainly because of their cholesterol-lowering, anti-inflammatory, and antioxidant properties [184,185]. Furthermore, statins may exert antidepressant and neuroprotective effects owing to their anti-inflammatory properties and modulation of the serotonergic system [185,186]. Statin-mediated cholesterol depletion is associated with serotonergic transmission [187]. Animal models have shown that statin administration affects microglial activity in the CNS and reduces the secretion of TNF-α, IL-6, and IL-1β [187]. In humans with MDD after acute coronary syndrome and one year of statin treatment, IL-6 and IL-18 levels were significantly lower than in patients without statin treatment, suggesting that levels of pro-inflammatory cytokines may predict the course of depression in patients undergoing statin treatment [188]. There is evidence from human and animal studies that statin monotherapy does not lead to an improvement in depressive symptoms compared to any control condition [186,187]. Several meta-analyses have indicated that statins have a superior antidepressant effect as an adjuvant treatment compared to that of placebo [187,189,190]. The improvement in depressive symptoms after statin treatment in addition to SSRI treatment correlated with a reduction in CRP and lipid levels [190]. More lipophilic statins, particularly simvastatin and atorvastatin, showed better antidepressant effects than less lipophilic or hydrophilic statins, such as rosuvastatin [187]. Animal models have demonstrated that atorvastatin may exert an antidepressant effect by reducing TNF-α levels and modulating oxidative stress and BDNF levels [191]. A recent network meta-analysis identified atorvastatin as the optimal statin for treating MDD [192]. However, some studies have shown no superior antidepressant effect of the addition of statins to antidepressants compared to placebo [193–195]. A recent double-blind, placebo-controlled, multicenter RCT indicated no significant antidepressant effect of simvastatin as an add-on to escitalopram in patients with MDD and comorbid obesity [195]. This study excluded participants with an established indication for statin treatment, and it cannot be excluded that statins may have more significant antidepressant effects in patients with an indication for statin treatment [195]. An RCT by Berk et al. (2020) [194] showed that rosuvastatin had no superior antidepressant effects compared to placebo in young patients with moderate to severe MDD. Based on previous studies, the lipophilicity of statins and their ability to cross the BBB are crucial factors for their antidepressant efficacy. While lipophilic statins, such as atorvastatin, cross the BBB more easily, hydrophilic statins, such as rosuvastatin, have low BBB permeability [187,194]. Another recent RCT revealed that adjunctive simvastatin provided no additional antidepressant effect compared to placebo in patients with TRD [193]. A recent meta-analysis that addressed these inconsistent findings on the effect of adjunctive statins on depressive symptoms demonstrated that treatment with statins could reduce the risk of depression, despite considerable heterogeneity among the included studies [196]. Statins may reduce depression risk, particularly in disease-specific subgroups, such as individuals suffering from comorbid CVD or T2D and under certain lifestyle and dietary conditions [196].
MetforminMetformin is a synthetic derivative of guanidine, which lowers blood sugar levels by decreasing glucose production in the liver, increasing insulin sensitivity, and reducing intestinal glucose absorption. Metformin is the first-line treatment for T2D [197] and is used to treat obesity in diabetes [198] and polycystic ovary syndrome (PCOS) [199]. Emerging evidence suggests that metformin has anti-inflammatory effects [200]. Numerous studies have shown that metformin not only reduces inflammation by improving metabolic parameters but also exerts direct anti-inflammatory effects by inhibiting NF-kB, a major transcription factor involved in the regulation of inflammation [201–204]. There is also evidence that metformin reduces inflammatory markers [200,203,205]. A meta-analysis of RCTs including 1776 participants with T2D indicated that metformin treatment led to a significant decrease in CRP levels [200]. No significant changes were observed in TNF-α and IL-6 levels following metformin treatment [200]. Another meta-analysis showed a significant reduction in CRP levels in obese women with PCOS, but no significant changes in IL-6 levels following metformin treatment [206]. Emerging evidence indicates that metformin has antidepressant effects by modulating the levels of inflammatory markers, BDNF, and insulin-like growth factor-1, and may have the potential to treat comorbid depression in patients with diabetes [207–209]. A recent study showed that 24 weeks of metformin treatment led to a significant reduction in anxiety and depressive symptoms in patients with T2D [210]. Data from the Midlife in the United States Study showed that metformin had a mitigating effect on the association between depressive symptoms and levels of CRP and IL-6, while no significant association was found with TNF-α [211]. However, to date, there is no robust evidence linking the reduction in specific inflammatory markers to the improvement of depressive symptoms following metformin treatment. A study examining the antidepressant effects of metformin in women with PCOS revealed that women taking metformin had 70% lower odds of having MDD than those who were prescribed lifestyle modifications only [212]. A recent cohort study showed that metformin was associated with a lower risk of MDD than other antihyperglycemic agents, including sulfonylureas, α-glucosidase inhibitors, and glinides [208]. However, a meta-analysis showed that metformin had no consistent antidepressant effects, whereas pioglitazone significantly improved depressive symptoms in patients with MDD [213]. Thus, it can be concluded that metformin may be a promising agent to treat MDD in individuals with diabetes, particularly in women with comorbid overweight or obesity and PCOS. Larger clinical trials are needed to investigate the overall antidepressant effects of metformin and to test different classes of diabetes treatment as potential antidepressants.
Glucagon-Like Peptide-1 Receptor AgonistsAgonists of the glucagon-like peptide-1 receptor (GLP-1RAs) are a novel class of antidiabetic agents that have shown promise in reducing body weight and cardiovascular risk. Some GLP-1RAs, such as liraglutide and semaglutide, have been approved by the FDA for the treatment of obesity. Semaglutide is an optimized long-acting GLP-1RA with better stability, higher receptor affinity, and longer duration of action [214,215]. The high weight loss may be due to the activation of specific receptors in the brain regions involved in appetite control and reward [214].
GLP-1RAs can cross the BBB and directly affect brain function and neurogenesis. Preclinical studies have indicated that GLP-1RAs modulate serotonin signaling by acting on GLP-1Rs in brain regions important for mood regulation and appetite control. Anderberg et al. (2017) [216] demonstrated that GLP-1RAs can activate GLP-1Rs in serotonin-producing neurons in the dorsal raphe nucleus, altering serotonin release, and leading to reduced food intake and weight loss in animal models. They may also affect serotonin signaling in other brain regions important for mood regulation, such as the hypothalamus and amygdala [216–218]. Emerging evidence from in vitro and in vivo studies suggests that GLP-1RAs have anti-inflammatory properties [219–221]. GLP-1RAs reduce microglial activation, resulting in decreased production of pro-inflammatory cytokines and increased anti-inflammatory markers [222]. GLP-1RAs may also affect NF-kB [223,224]. Moreover, GLP-1RAs may affect the kynurenine pathway and balance of neuroprotective and neurotoxic metabolites. A recent meta-analysis revealed that GLP-1RAs significantly reduced CRP and TNF-α levels compared with standard diabetes therapy and placebo [225]. Another recent meta-analysis indicated significant anti-inflammatory effects of GLP-1RAs, significantly decreasing TNF-α and CRP levels in patients with T2D. The type of GLP-1RA and a longer treatment duration were associated with a greater reduction in inflammatory markers [226]. Owing to their effects on serotonin signaling and anti-inflammatory properties, GLP-1RAs may have great therapeutic potential with broad clinical implications.
Observational studies have shown that GLP-1RAs have beneficial effects on mental illness outcomes and quality of life in individuals with major and bipolar affective disorders [227–231]. Moulton et al. (2016) [231] demonstrated that treatment with GLP-1RAs led to an improvement in depressive symptoms, which was associated with a significant reduction in CRP levels. A recent meta-analysis indicated that patients treated with GLP-1RAs showed significant reductions in depression rating scale scores compared to those treated with placebo or other antidiabetic therapies [230]. However, patients included in these studies did not suffer from severe depression and the assessment of depression severity was not the primary outcome [230]. The safety and effectiveness of GLP-1RAs in MDD have only been evaluated in a few studies with small sample sizes, involving patients with mild or moderate MDD. Further clinical trials with larger sample sizes and longer treatment durations are needed to evaluate the antidepressant effects of GLP-1RAs as primary outcomes in individuals with more severe MDD.
This review underlines the importance of inflammation and metabolic disturbances in the pathophysiology and course of MDD. Treatment resistance in MDD is multifactorial, involving social, environmental, genetic, and biological factors, such as dysregulation of the immune system and increased levels of pro-inflammatory cytokines. Inflammatory dysregulation affects monoamine systems and brain structures, leading to profound and long-term neuronal damage and dysfunction. Therefore, it is crucial to identify patients with MDD and inflammatory abnormalities early in the course of the illness and to apply appropriate treatment to tackle the illness at its origin.
This review focuses on the importance of inflammatory dysregulation, which characterizes a biologically distinct subgroup of patients with MDD who may specifically benefit from antidepressant treatments targeting inflammation. The use of inflammatory biomarkers is highly beneficial for selecting appropriate therapeutic interventions and achieving optimal treatment responses. Figure 1 illustrates the antidepressant treatment strategies and potential inflammatory biomarkers for MDD with different inflammatory conditions and comorbid disorders.
A diverse profile of inflammatory markers and metabolic conditions may reflect biological differences among individuals with MDD and lead to different courses, severity of illness, and therapeutic responses [12,13,232]. This subgroup of patients with MDD may be considered an inflammatory cytokine-associated subtype with a higher risk of metabolic comorbidities and resistance to treatment. To the best of our knowledge, patients with elevated levels of pro-inflammatory cytokines respond poorly to traditional antidepressants [12,69,233].
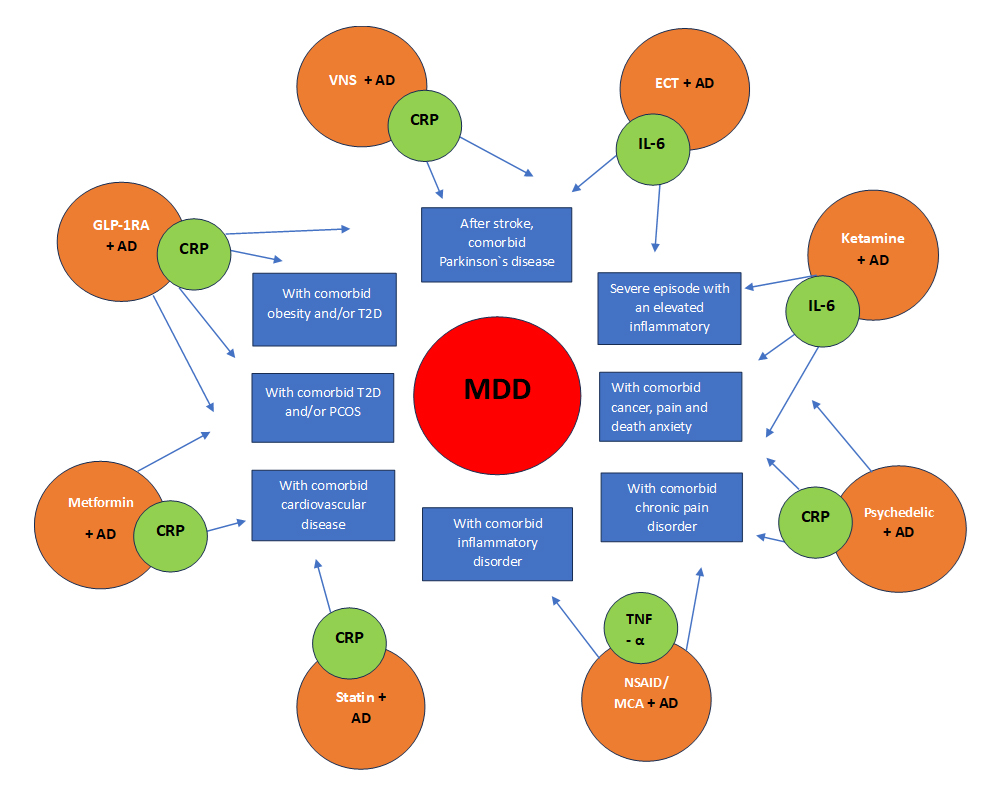 Figure 1. Antidepressant treatment strategies and potential inflammatory biomarkers for MDD with different inflammatory conditions.
Mounting evidence suggests that changes in pro-inflammatory cytokine levels may drive treatment response in a subset of patients with MDD. Anti-inflammatory treatments caused a reduction in cytokine levels that correlated with an improvement in depressive symptoms [182]. An overproduction of pro-inflammatory cytokines can cause depressive symptoms by disrupting neuroendocrine systems and inducing neurotransmitter imbalances [21,22]. The high rates of MDD in individuals with inflammatory disorders [234,235] and the triggering of depressive symptoms through immune treatments [236,237] underline the causal role of pro-inflammatory cytokines in the specific inflammatory subtype of depression. Currently, there are no official diagnostic criteria for the inflammatory cytokine-associated subtype of MDD. Researchers often identify this subtype of MDD using clinical indicators such as elevated pro-inflammatory cytokines and CRP levels, comorbid metabolic or inflammatory conditions, motivational anhedonia, and treatment resistance [238,239]. In literature low-grade inflammation is defined as serum CRP level > 3 mg/L [238,240]. As approximately 27% of patients with MDD suffer from low-grade inflammation, CRP with a cut-off > 3 mg/L may be a promising indicator of the inflammatory subtype of depression [238,241]. This CRP level may be used to identify patients who do not respond to traditional antidepressants but may respond to anti-inflammatory treatment.
An important aspect of peripheral cytokine measurements in clinical studies is their high sensitivity to pre-analytical factors [242]. Therefore, the standardization of the major factors affecting stability is essential. There is a need for strict protocols to control for such factors, including circadian rhythms, fasting status, smoking, BMI-driven inflammation, dietary intake, and other comorbidities. Cytokine measurements should be performed in the morning, in a fasted state, from rested individuals [243].
Despite growing evidence of the relationship between TRD and elevated pro-inflammatory cytokine and CRP levels, there are currently no approved blood tests or official clinical guidelines for diagnosing or guiding treatment choices according to inflammatory marker levels [244]. A deeper understanding of the causal mechanism of MDD and the association between antidepressant treatment and alterations in inflammatory markers in MDD is required to develop treatment guidelines related to inflammatory blood markers (Tables 1 and 2) [244,245]. Thus, the inflammatory cytokine-associated subtype of MDD is currently not actionable in routine clinical practice and requires further validation studies. While it is recognized as a valid subtype in research and literature, large-scale clinical trials are needed to standardize its use in routine clinical practice.
A growing body of evidence indicates that patients with the inflammatory subtype of MDD may benefit more from alternative treatments with anti-inflammatory components [27]. The effectiveness of anti-inflammatory agents may be closely related to the target of the drug, degree of specificity, and accuracy of the personalized treatment [74]. NSAIDs are known to inhibit general inflammatory mediators but not CNS-specific pathways. Monoclonal antibodies exert a more significant antidepressant effect by specifically targeting key cytokines and inflammatory pathways involved in the pathophysiology of MDD [74]. Owing to the increased risk of opportunistic infections and a higher lymphoma risk, particularly when taken simultaneously with immunosuppressants, safety problems should always be considered when using monoclonal antibodies [24].
Treatment with ECT and ketamine leads to a rapid reduction in depressive symptoms associated with changes in cytokine levels in patients with TRD [95,131,138,142]. The pro-inflammatory cytokine IL-6 is the most promising biomarker of the antidepressant response to ECT [88–90,100] and ketamine [138,144,246]. Both ECT and ketamine are outstanding because of their rapid administration and high effectiveness in patients with TRD. However, both treatments require inpatient stays, cannot be administered independently, and often do not have long-lasting effects.
Ketamine represents a breakthrough in the treatment of TRD, and its high and rapid effectiveness is crucial for the emergency treatment of severe depression and acute suicidality. However, clinicians should also consider the risks and side effects of ketamine, including high blood pressure, perceptual abnormalities, transient dissociative effects, and craving behavior, when prescribing it. Therefore, long-term treatment with ketamine requires strict safety measures.
Mounting evidence suggests that VNS is effective in treating TRD and may exert long-lasting effects. Some animal studies have indicated a modulatory effect of VNS on inflammatory markers. To date, it has not been confirmed whether VNS has a significant impact on inflammatory cytokine levels in humans [118]. However, VNS may have beneficial effects in acute inflammatory conditions [118]. The anti-inflammatory properties of VNS are considered to contribute to its antidepressant potential.
Both VNS and ECT are neurostimulation techniques used for the treatment of TRD. However, they have different mechanisms of action and effects on inflammation. ECT has a broader impact on the inflammatory system, acts faster, and has a stronger antidepressant effect, whereas VNS has a slower, more targeted and direct impact on inflammation through the cholinergic anti-inflammatory pathway, inducing a longer-lasting antidepressant effect in patients with TRD [85,111,114–116].
Psychedelics have demonstrated antidepressant effects, along with a reduction in inflammatory markers. In particular, psilocybin has proven to be a breakthrough treatment for MDD, as it reduces neuroinflammation and depression and anxiety symptoms in the long term [165,166,246]. However, the use of psychedelics remains controversial because of their potential for abuse. It is important for prescribing clinicians to adhere to high safety and ethical standards when using psychedelics.
A crucial aspect of MDD is its highly frequent comorbidity with metabolic and cardiovascular disorders [41,247]. Emerging evidence indicates that obesity is a risk factor for both inflammation and depression, and that white adipose tissue is a potential source of pro-inflammatory cytokines [46,48,248].
Meta-analyses have shown that statins as an adjuvant treatment to antidepressants lead to an improvement in depressive symptoms and a reduction in inflammatory markers in patients with CVD and MDD [187,188,190]. More lipophilic statins, such as simvastatin and atorvastatin, may have the best antidepressant effects among all statins [187,192].
Metformin may be a promising agent for treating MDD in patients with T2D, especially in women with comorbid obesity and PCOS [207,212]. Although metformin has anti-inflammatory properties, evidence that its potential antidepressant effects are directly driven by a decrease in inflammatory markers has not yet been established. GLP-1RAs provide multifactorial benefits to patients with T2D and obesity, with effects that go beyond their glycemic actions. They represent a significant breakthrough in anti-inflammatory treatments by modulating microglial and NF-kB activation, leading to a reduction in the production of pro-inflammatory cytokines [222,223]. Due to their anti-inflammatory properties, GLP-1RAs may also affect the kynurenine pathway and the balance of neuroprotective and neurotoxic metabolites. A growing body of evidence suggests the beneficial effects of GLP-1RAs on well-being and quality of life [228–230]. However, the antidepressant effect has not yet been proven, and there is a pressing need for further RCTs to examine the effects of GLP-1RAs in the treatment of depression [249]. Given that MDD and metabolic disorders share several underlying pathophysiological mechanisms and that a metabolic subtype of MDD is increasingly recognized, GLP-1RAs may offer a new treatment avenue for MDD by targeting these complex biological processes, especially in patients with known metabolic disorders. A multidisciplinary approach and coordination between psychiatry and endocrinology specialists are required to determine the optimal use and safe integration of GLP-1RAs into clinical practice and to achieve more personalized and effective treatment for MDD.
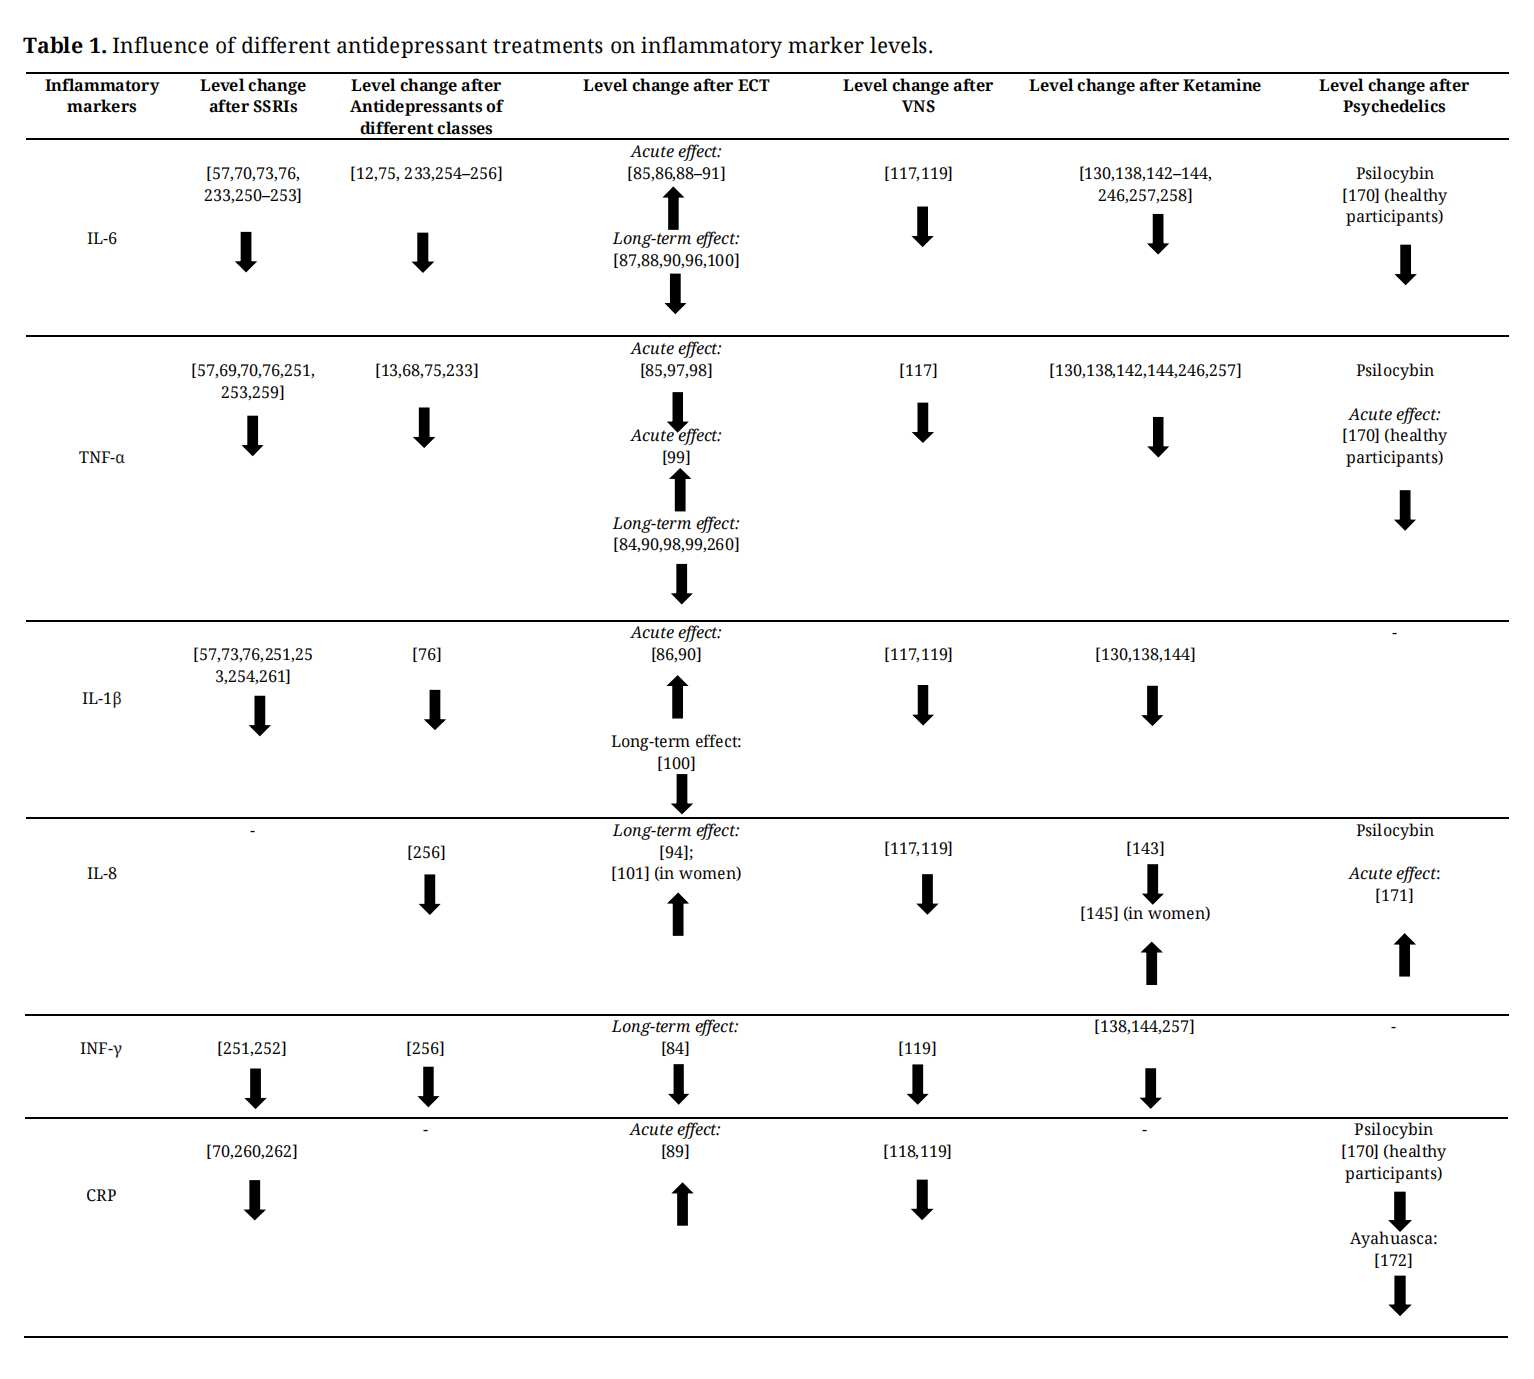 Table 1. Influence of different antidepressant treatments on inflammatory marker levels.
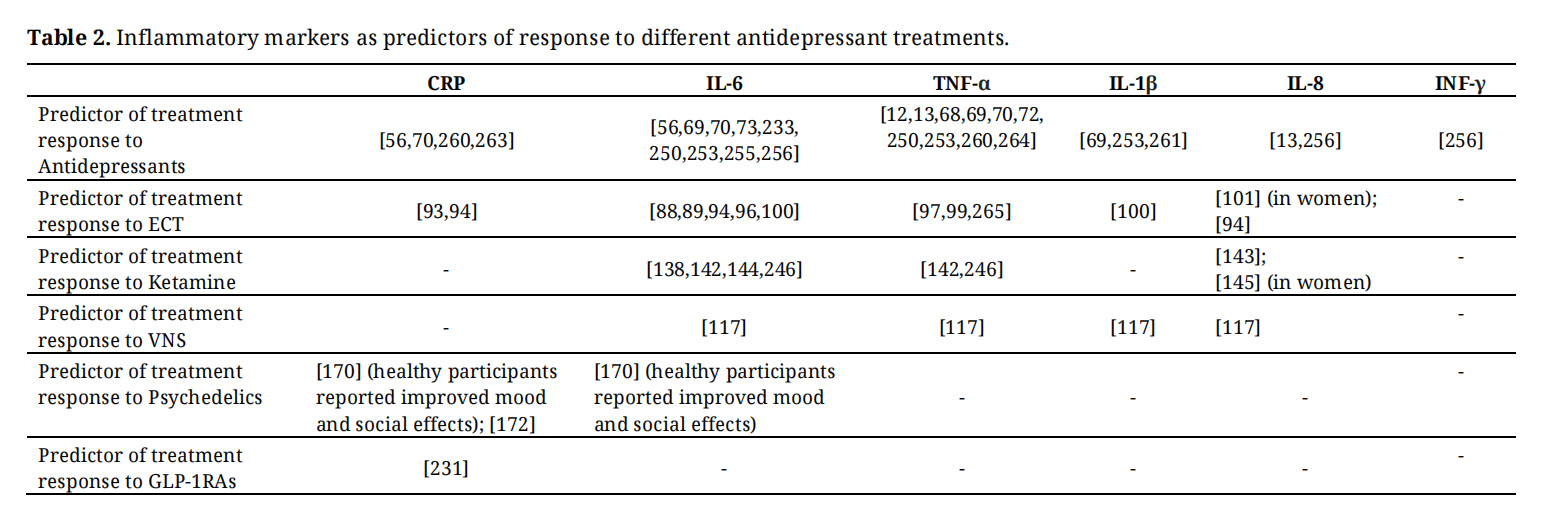 Table 2. Inflammatory markers as predictors of response to different antidepressant treatments.
In conclusion, inflammatory biomarkers may be valuable tools for patient stratification, enabling appropriate and effective treatment at an early stage of the illness. Antidepressant treatments targeting inflammation and metabolic dysfunction may be particularly effective in patients with metabolic and inflammatory subtypes of MDD and may prevent the development of TRD. Therefore, there is an urgent need to identify potential inflammatory biomarkers for personalizing antidepressant treatment selection. Inflammatory markers are useful targets for both personalized antidepressant treatment selection and the development of novel antidepressants.
Future treatment strategies should include the use of anti-inflammatory treatments to tackle and combat depression of neuroinflammatory origin in patients with MDD and immune system alterations. For patients with MDD and comorbid metabolic disorders, the use of GLP-1RAs may be of great interest and subject to future investigation.
Not applicable.
Declaration of Helsinki STROBE Reporting GuidelineThis review article adhered to the Helsinki Declaration.
All data generated from the review are available in the manuscript.
The author declares no conflicts of interest.
The author received no specific funding for this study.
1.
2.
3.
4.
5.
6.
7.
8.
9.
10.
11.
12.
13.
14.
15.
16.
17.
18.
19.
20.
21.
22.
23.
24.
25.
26.
27.
28.
29.
30.
31.
32.
33.
34.
35.
36.
37.
38.
39.
40.
41.
42.
43.
44.
45.
46.
47.
48.
49.
50.
51.
52.
53.
54.
55.
56.
57.
58.
59.
60.
61.
62.
63.
64.
65.
66.
67.
68.
69.
70.
71.
72.
73.
74.
75.
76.
77.
78.
79.
80.
81.
82.
83.
84.
85.
86.
87.
88.
89.
90.
91.
92.
93.
94.
95.
96.
97.
98.
99.
100.
101.
102.
103.
104.
105.
106.
107.
108.
109.
110.
111.
112.
113.
114.
115.
116.
117.
118.
119.
120.
121.
122.
123.
124.
125.
126.
127.
128.
129.
130.
131.
132.
133.
134.
135.
136.
137.
138.
139.
140.
141.
142.
143.
144.
145.
146.
147.
148.
149.
150.
151.
152.
153.
154.
155.
156.
157.
158.
159.
160.
161.
162.
163.
164.
165.
166.
167.
168.
169.
170.
171.
172.
173.
174.
175.
176.
177.
178.
179.
180.
181.
182.
183.
184.
185.
186.
187.
188.
189.
190.
191.
192.
193.
194.
195.
196.
197.
198.
199.
200.
201.
202.
203.
204.
205.
206.
207.
208.
209.
210.
211.
212.
213.
214.
215.
216.
217.
218.
219.
220.
221.
222.
223.
224.
225.
226.
227.
228.
229.
230.
231.
232.
233.
234.
235.
236.
237.
238.
239.
240.
241.
242.
243.
244.
245.
246.
247.
248.
249.
250.
251.
252.
253.
254.
255.
256.
257.
258.
259.
260.
261.
262.
263.
264.
265.
Breit S. Anti-Inflammatory Effects of Antidepressant Treatments and the Use of Inflammatory Biomarkers in Major Depressive Disorder: A Narrative Review. J Psychiatry Brain Sci. 2026;11(3):e260006. https://doi.org/10.20900/jpbs.20260006.

Copyright © Hapres Co., Ltd. Privacy Policy | Terms and Conditions


