Location: Home >> Detail
Crop Breed Genet Genom. 2026;8(4):e260025. https://doi.org/10.20900/cbgg20260025
 ,
Jorge Luis Luna Melendez 2 ,
Jhon Larry Moreno Alzate 2 ,
Maria Alejandra Ospina 2 ,
Luis Londoño 2 ,
Sandra Milena Salazar 2 ,
Nelson Morante 2 ,
Bunmi Olasanmi 3 ,
Winnie Gimode 2
1
2
3
*
Cassava (Manihot esculenta Crantz) is a major staple crop globally, valued for its storage roots, which serve as a key source of food, feed, and industrial products such as starch and flour. Consequently, root quality traits are central to the cassava value chain. This study aimed to identify genomic regions associated with five important root quality traits: dry matter content (DMC), total carotenoid content (TCC), beta-carotene content (BCC), hydrogen cyanide content (HCN), and water absorption during boiling for 20 and 30 min (WAB_20min, WAB_30min). A panel of 300 cassava accessions was phenotyped for these traits and genotyped using genotyping-by-sequencing (GBS: 30,046 SNPs) and DArTag (2526 SNPs) platforms for genome-wide association analysis. Correlation analysis revealed generally low to moderate relationships among traits, except for a strong positive association between TCC and BCC, and between the WAB measurements, indicating relative independence among most root quality traits. Under the GBS platform, 10 significant SNPs were detected for each of HCN and BCC, 4 for TCC, and 2 for each of DMC and WAB_20min. Under the DArTag platform, 9 significant SNPs were identified for HCN, 5 for TCC, 5 for BCC, 1 for DMC, and 1 for WAB_20min. Across both marker platforms, no significant SNP was detected for WAB_30min. Overall, these findings provide insights into the genetic architecture of cassava root quality traits and highlight the potential of integrating genomic tools to enhance selection efficiency in cassava breeding programs.
Cassava (Manihot esculenta Crantz) is a crucial staple crop in tropical and subtropical regions, serving as a primary caloric source for millions, particularly in sub-Saharan Africa [1,2]. Its adaptability to diverse environments underpins its significance for global food security [2]. Although cassava leaves are consumed by humans or used as animal feed in some parts of the world [3], the crop is mainly cultivated for its storage roots, which are the most economically important part of the plant [4]. The economic and nutritional value of cassava roots are determined by inter-related quality parameters, among which are starch content, dry matter content (DMC), total carotenoid content (TCC), beta-carotene content (BCC), hydrogen cyanide content (HCN), and water absorption during boiling (WAB) [5–8].
Dry matter content is a critical determinant of dry root yield which determines the product yield, with a strong correlation to starch content [6,9]. High DMC is generally preferred by the industrial sector [10]. Studies have shown that DMC can vary significantly, ranging from 14.1% to 51.0% across different root sections and genotypes [11]. Efforts to biofortify cassava with provitamin A carotenoids, such as beta-carotene, have sometimes resulted in a negative correlation with DMC, posing a challenge for breeding programs aiming to improve both traits simultaneously [1,2,7,12]. This negative correlation implies that increasing provitamin A content might inadvertently reduce the dry matter, affecting overall yield and product quality.
Total carotenoid content and beta-carotene content are essential nutritional attributes, as beta-carotene is a precursor to vitamin A, crucial for addressing vitamin A deficiency, a prevalent micronutrient deficiency in populations reliant on cassava [1,13,14]. Research has focused on enhancing these contents through conventional breeding and genetic engineering, with some genotypes accumulating up to 16.6 µg/g beta-carotene on fresh-weight basis [1,5,15]. Due to its nutritional importance, the inheritance of carotenoid content in cassava and its genetic basis have received significant research attention [12,14,16,17].
The presence of cyanogenic glycosides, which can yield hydrogen cyanide (HCN) when broken down by linamarase, is a significant safety concern in cassava [6,18]. Hydrogen cyanide is toxic and contributes to the bitter taste of some cassava cultivars [6]. Various processing techniques are employed to reduce HCN levels, including fermentation, drying, and heat processing (boiling or roasting) which can decrease cyanide content by up to 95% in roots and significantly in leaves [18–20]. The effectiveness of HCN reduction is critical for ensuring the safety of cassava-based foods [21].
Cassava root water absorption (WAB) is another important factor, particularly in the context of food product development and material science [8]. It is a key determinant of cooking quality in cassava roots and is directly linked to the mealiness and texture that consumers prioritize. Boiling is one of the simplest and most common modes of cassava consumption across Latin America, Africa, and Asia, where consumers prefer varieties that cook rapidly and soften during boiling, making mealiness and texture of boiled roots a high-priority trait for breeders [22]. Water absorption is the main parameter determining the quality of cassava cultivars during cooking, with mealy cooking types absorbing significantly more water than hard cooking types [23]. Mealiness in cassava is closely related to firmness, cell cohesiveness, and water uptake during boiling, and at the molecular level, pectins and cell wall characteristics have been linked to this trait [22]. Water absorption has been validated as a suitable instrumental method for evaluating mealiness and hardness of boiled cassava, and consumer preference scores have been translated into acceptability thresholds based on this measure, underscoring its practical utility in breeding programs [24]. Despite its importance as a sensory attribute, root mealiness has received comparatively little research attention in cassava relative to other crops, partly due to the predominant focus on yield and disease resistance in breeding programs [25].
Genome-wide association studies (GWAS) have elucidated the genetic architecture of several cassava root quality traits. For HCN, two major loci, S14_6050078 and S16_773999, on chromosomes 14 and 16 respectively were identified encoding an ATPase and a MATE transporter, which collectively contribute up to 37% of root HCN variation, with the MATE protein playing a dominant role in vacuolar cyanide transport [26].
Regarding DMC, a major QTL explaining ~37% of the phenotypic variance has been mapped to approximately 24.1 Mbp on chromosome 1 that co-localizes with major locus controlling TCC [12]. Linkage mapping also identified six additional DMC loci across four linkage groups, one of which co-localized with an HCN QTL on linkage group 10, suggesting pleiotropy or tight linkage [27].
For carotenoid traits, GWAS was used to identify a major QTL on chromosome 1 (23.4–24.7 Mbp) associated with TCC and beta-carotene, encompassing the candidate gene Manes.01G124200 (phytoene synthase, PSY), which catalyzes beta-carotene accumulation [28,29]. Additional carotenoid-associated regions were found on chromosomes 2, 4, 13, 14, and 15 [29]. In a recent study, six significant SNPs consistently associated with both carotenoids and DMC were detected. They were mapped to candidate genes involved in ABA signaling, hydrolase activity, fatty-acid biosynthesis, cell-wall remodeling, and glycolytic metabolism, jointly explaining 75%–76% of the phenotypic variance [30].
While the genomic basis of water absorption during boiling (WAB) remains far less characterized than that of other root quality traits, SNPs associated with mealiness have been reported on chromosomes 6 and 13 in previous studies [25]. The identified SNPs on chromosome 13 are located in the vicinity of the candidate gene Manes.13G026900 which is annotated as a plant invertase/pectin methylesterase inhibitor superfamily protein responsible for cell adhesion and the mealiness or crispness of various fruits and vegetables. Similar pectin-related gene activity has been observed to impact the texture of cooked potatoes [31–33]. Although WAB is reported to have limited genetic variation among cassava genotypes, most of the observed phenotypic variation was attributed to genotype-by-environment (G × E) interactions rather than additive genetic effects, suggesting a strong environmental influence on the trait [22]. Nevertheless, WAB is a critical post-harvest quality attribute that directly affects the cooking quality and consumer acceptance of boiled cassava and yam [23]. Therefore, improving WAB remains essential for increasing the adoption of improved cassava varieties in fresh consumption markets.
In this study, a genome wide association analysis was performed for five cassava root quality traits—DMC, TCC, BCC, HCN, and WAB using a multi-parental panel across three growing seasons with two genotyping platforms; genotyping by sequencing (GBS) and DArTag markers. Compared with biparental populations, multi-parental panels capture greater allelic diversity and more historical recombination, providing higher mapping resolution, stronger statistical power, and more broadly transferable marker–trait associations across diverse genetic backgrounds [34]. Identifying genetic markers associated with economically important traits provides valuable resources for marker-assisted selection (MAS) [35,36]. We hypothesized that integrating complementary genotyping platforms would improve the identification and validation of genomic regions controlling root quality traits while providing robust marker-trait associations for marker-assisted selection. The identified loci contribute to a better understanding of the genetic architecture of cassava root quality and provide valuable genomic resources to accelerate the development of cassava varieties with improved nutritional quality, processing characteristics, and consumer-preferred cooking attributes.
A field trial involving a multi-parental mapping population of 300 genotypes was conducted at Palmira, Colombia, using a partially replicated experimental design with two replications for the replicated entries. Each genotype was established in a single-row plot consisting of six plants, with 0.8 m spacing between plants within rows and 1.2 m spacing between adjacent plots. The population was evaluated over three consecutive growing seasons: 2023/2024, 2024/2025, and 2025/2026. Roots were harvested 11 months after planting in each season. All evaluations were maintained under comparable management conditions. The average temperature, relative humidity, and mean daily precipitation recorded during the 2023/2024 season were 32.75 °C, 80.32%, 2.43 mm respectively. In the 2024/2025 season, the corresponding values were 27.07 °C, 80.88%, and 0.07 mm, respectively, while in 2025/2026 season, the average values of 24.34 °C, 78.15%, and 2.87 mm.
Trait PhenotypingThe dry matter content (DMC), total carotenoid content (TCC), and beta-carotene content (BCC) were estimated using near infrared spectroscopy (NIRS) as described by Belalcazar et al. (2016) [37]. At least three representative roots from each genotype were peeled and thoroughly washed to remove adhering soil. The roots were gently wiped dry to eliminate excess moisture which could affect the accuracy of data collected by the NIRS equipment. Using the SKYMSEN food processor (model PAEI) fitted with the smallest grating disc, the roots were grated until a homogenous paste was obtained. Approximately 8 g of the paste was transferred to a FOSS NIRS ring cup, ensuring complete and uniform coverage of the quartz window without exceeding the rim of the cup. The lid was secured so that it sat flush with the cup, and the sample was scanned using a FOSS NIRS DS2500 instrument (FOSS, Hillerød, Denmark). Two independently prepared ring cups were analyzed for each cassava genotype as technical replicates, and the mean predicted value was used for statistical analysis. The DMC, TCC, and BCC were predicted on fresh-weight basis using the corresponding NIRS calibration models.
Hydrogen cyanide content (HCN) was determined using the colorimetric method described by Essers et al. (1993) [38]. Fresh cassava root samples (40 g, fresh weight) were homogenized in 50 mL of extraction solution containing 0.1 M orthophosphoric acid in 25% (v/v) ethanol and 75% (v/v) distilled water. The homogenate was centrifuged at 6000 rpm for 10 min at 25 °C, after which 0.1 mL of the supernatant was mixed with 0.4 mL of 0.1 M phosphate buffer (pH 7.0) and 0.1 mL of linamarase enzyme. The mixture was incubated at 30 °C for 15 min to hydrolyze cyanogenic glucosides, followed by the addition of 0.6 mL of 0.2 M sodium hydroxide. After standing for 5 min at room temperature, 2.8 mL of 0.1 M phosphate buffer (pH 6.0), 0.1 mL of chloramine-T, and 0.6 mL of isonicotinate-1,3-dimethylbarbituric acid reagent were added sequentially, with incubation for 5 and 10 min, respectively. Absorbance was measured at 605 nm using a spectrophotometer, and HCN concentration was determined from a standard calibration curve and expressed as mg/kg dry-weight.
To determine water absorption at 20 and 30 min (WAB_20min and WAB_30min), eight roots of each genotype were peeled, cut into proximal, central, and distal parts. These were then weighed and submerged in boiling water for the respective durations. The weight increase following immersion was recorded and expressed as a percentage of the initial weight [22].
Extracting BLUPs for Each TraitFor all traits, the three-year data were collapsed into a single best linear unbiased prediction (BLUPs) using a linear mixed model Yijk = μ + βj + gi + (gβ)ij + rk(j) + εijk within the lme4 package in RStudio [39,40]. Where Yijk = observed trait value for the i-th genotype, in the j-th year, and k-th rep. μ = overall intercept (grand mean). βj = fixed effect of the j-th year (Year is fixed). gi = random effect of the i-th genotype. (gβ)ij = genotype × environment interaction. rk(j) = random effect of the k-th replication nested within the j-th year. εijk = residual error.
Trait Association Analysis Using Pearson CorrelationTo evaluate the relationships among measured traits, pairwise correlations were computed using the Pearson correlation coefficient, which measures the strength and direction of linear associations between continuous variables. Prior to analysis, missing values were handled using complete case analysis, whereby only observations with no missing values across the selected traits were retained. This approach ensured that correlation estimates were not biased by incomplete data. Statistical significance of the pairwise correlations were assessed using two-tailed tests, with (p < 0.05), (p < 0.01), and (p < 0.001) considered statistically significant. The resulting correlation matrix was visualized using the corrplot package in R [40].
Extraction of Variance Components and Heritability EstimationVariance components were estimated for all traits using linear mixed-effects models fitted in R with the lme4 package. For the combined analysis across years, the observed phenotypic value was modeled as a function of the overall mean, random genotypic effect, random year effect, random genotype × year interaction effect, random replication effect, and residual error. The general model was expressed as:
where Yijk is the observed trait value of the ith genotype in the j-th year and k-th replication; μ is the overall mean; Gi is the random genotypic effect; Ej is the random environmental (year) effect; (G × E)ij is the random genotype × environment interaction effect; Rk(j) is the random replication effect nested within year; and εijk is the residual error. The coefficient of variation (CV) for each year was calculated independently using a year-specific linear mixed-effects model with genotype and replication fitted as random effects. The CV was calculated as the ratio of the residual standard deviation to the corresponding year-specific trait mean and expressed as a percentage:
where σε,y is the residual standard deviation estimated for year y, and is the corresponding year-specific trait mean.
The broad-sense heritability across environment was calculated as
where H2 is the broad-sense heritability, is genotypic variance, is genotype × environment interaction variance, is Residual (error) variance, e is number of environments (years), r is number of replications per environment (year).
Genotyping, SNP Calling, and Quality ControlThe SNP datasets used in this study were previously generated using DArTag and genotyping-by-sequencing (GBS) platforms in an earlier study involving the same cassava population [40]. Marker positions for the GBS dataset were aligned to the cassava reference genome assembly version 8.1 (v8.1), whereas the DArTag marker positions were based on the cassava mid-density panel, which was originally mapped to version 7.1 (v7.1). The SNP filtering was performed based on missing data and minor allele frequency (MAF) thresholds, resulting in 2526 high-quality SNPs for the DArTag dataset and 30,046 SNPs for the GBS dataset. Detailed procedures for SNP calling, sequence alignment, variant discovery, and marker filtering are described in Dankwa et al. (2026) [41].
Marker Distribution, Linkage Disequilibrium, and Population StructureGenome-wide marker distribution, SNP density, linkage disequilibrium (LD) decay, principal component analysis (PCA), and kinship estimation for the DArTag and GBS datasets were previously assessed and reported for the same germplasm population [41]. The smoothed LD decay curves reached the background threshold (r2 ≈ 0.10) at approximately 685,090 bp for the DArTag markers and 625,262 bp for the GBS markers. Furthermore, PCA demonstrated a high degree of concordance between the two marker platforms; the first two principal components explained 21.3% and 22.2% of the total genetic variation for the DArTag and GBS datasets, respectively, reflecting comparable large-scale population structure. Both platforms consistently resolved the same major genetic clusters, with accessions grouping according to shared parental backgrounds. Consequently, these previously generated kinship matrices and population structure covariates were incorporated into the downstream GWAS model to account for genetic relatedness and minimize confounding population stratification.
Association AnalysesThe phenotypic (BLUP values) and genotypic data were integrated to identify marker–trait associations using the Genomic Association and Prediction Integrated Tool (GAPIT) package version 3.4.0 in R, employing the BLINK model [42]. The model BLINK has been demonstrated to provide greater statistical power than several widely used GWAS models, while substantially reducing computational time for large-scale genomic analyses. In addition, it is highly robust for complex genetic architectures, effectively controlling for p value inflation arising from population structure and cryptic relatedness [43,44]. Notably, BLINK performs comparably to, or outperforms traditional mixed linear models in minimizing false-positive associations while improving the detection of true genetic signals [44]. Significant marker–trait associations were identified using a Bonferroni-corrected significance threshold (p < 0.05/m), where m represents the total number of SNPs tested.
Significant Marker Distribution AnalysisSignificant marker distribution analysis was performed to evaluate the phenotypic effects of allelic variation at loci identified through genome-wide association analysis. Significant SNPs detected using the BLINK model in GAPIT were extracted and integrated with corresponding phenotypic and genotypic data in R within RStudio. For each significant SNP, individuals were grouped according to allelic classes, and the distribution of phenotypic values for DMC, HCN, TCC, BCC, and WAB_20min was visualized using violin plots generated with the ggplot2 package.
Local Linkage Disequilibrium AnalysisLocal linkage disequilibrium (LD) was evaluated around the major genome-wide association signals for total carotenoid content (TCC), beta-carotene content (BCC), and hydrogen cyanide content (HCN) identified from the GBS and DArTag datasets. For each lead SNP, pairwise LD was calculated between the lead marker and neighboring SNPs within a ±500-kb physical window using PLINK v1.9 [45]. LD was measured as the squared correlation coefficient (r2) between marker genotypes. An r2 threshold of 0.20 was used to identify neighboring markers showing LD above the defined threshold with the lead SNP, consistent with the threshold used to characterize genome-wide LD decay. The extent of local LD support was assessed based on the physical distance between the lead SNP and neighboring markers with r2 ≥ 0.20. Local LD patterns were compared between GBS and DArTag to assess whether major associations occurred within shared LD-supported genomic regions across marker platforms.
Conversion of Significant SNP Coordinates between Cassava Genome AssembliesSignificant SNP markers identified from DArTag were converted from the Manihot esculenta v7.1 reference genome (https://phytozome-next.jgi.doe.gov/info/Mesculenta_v7_1) to Manihot esculenta v8.1 reference genome (https://phytozome-next.jgi.doe.gov/info/Mesculenta_v8_1) using a BLAST-based workflow. For each marker, a 2001 bp sequence centered on its v7.1 coordinate, comprising 1 kb upstream and 1 kb downstream, was extracted and aligned against the v8.1 reference genome using BLASTn. Alignments were required to have at least 95% sequence identity and an E-value ≤ 1 × 10⁻²⁰. When multiple alignments were recovered, the best supported position was selected based primarily on the highest bit score and, in the event of a tie, the longest alignment. After selecting the highest-ranking alignment, the v8.1 marker coordinate was assigned to the genomic position corresponding to the central nucleotide of the aligned flanking sequence, taking the alignment orientation into account.
The distribution of best linear unbiased prediction (BLUP) values for the evaluated cassava root quality traits revealed substantial phenotypic variation among genotypes (Figure 1). The DMC exhibited an approximately normal distribution with moderate variation around a mean of 40.21%, ranging from 33.48% to 45.41%. HCN showed a positively skewed distribution with a mean of 62.90 µg/g and values spanning 1.40 to 209.18 µg/g. The carotenoids, TCC and BCC displayed similarly skewed distributions, with mean values of 1.23 µg/g and 0.88 µg/g, respectively. TCC ranged from 0.14 to 4.23 µg/g, whereas BCC varied from 0.06 to 2.47 µg/g, with most genotypes concentrated at lower values and only a few exhibiting markedly elevated carotenoid levels. The low carotenoid levels were expected as most of the genotypes in the population were white-fleshed. WAB_20min and WAB_30min also showed continuous variation among genotypes. WAB_20min displayed moderate positive skewness with a mean of 8.36% and values ranging from 3.39% to 17.04%, while WAB_30min approached a near-normal distribution with a mean of 20.19% and a range of 5.57% to 33.04%.
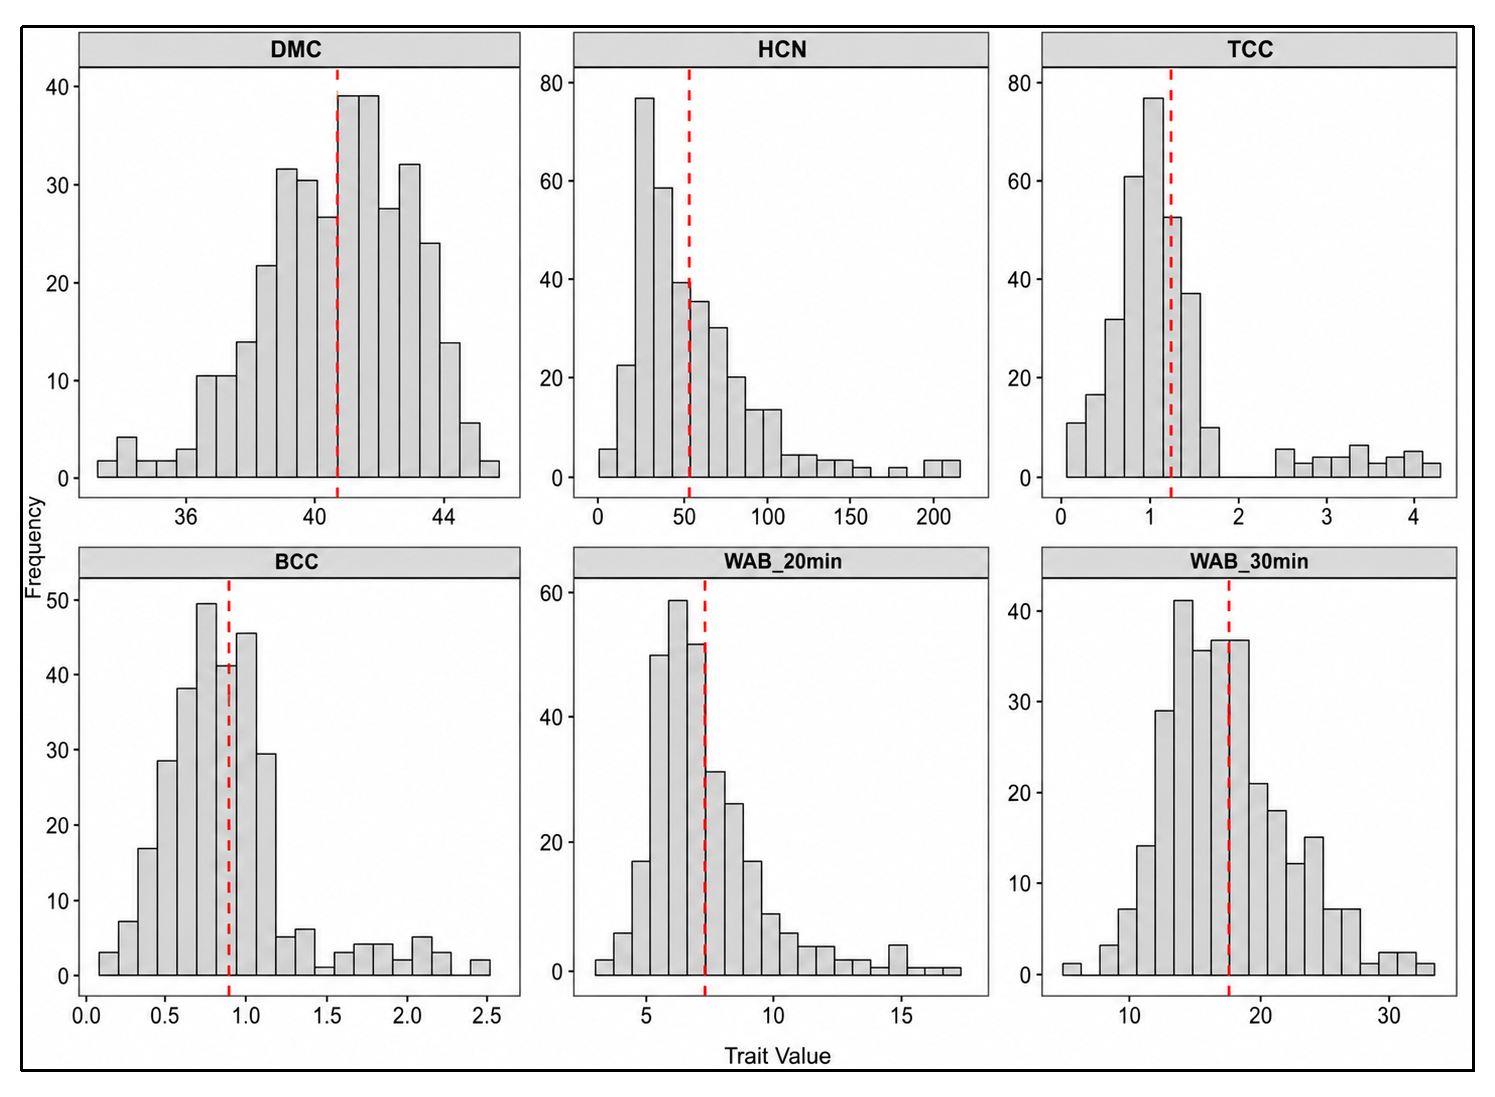 Figure 1. Phenotypic distribution of best linear unbiased predictors (BLUPs) for five cassava root quality traits. The dashed red vertical line in each panel indicates the population mean. DMC: dry matter content (%); HCN: hydrogen cyanide content (µg/g); TCC: total carotenoid content (µg/g); BCC: beta-carotene content (µg/g); WAB_20min and WAB_30min: water absorption at 20 and 30 min (%), respectively.
Pairwise correlation analysis among the evaluated cassava root quality traits revealed distinct patterns of association (Figure 2). A strong and positive correlation was observed between water absorption measured at 20 min and 30 min (r = 0.80), indicating consistency between the two time points. Water absorption traits showed weak to moderate negative correlations with both dry matter content (DMC) (r = −0.18 for WAB_20min; r = −0.27 for WAB_30min) and hydrogen cyanide content (HCN) (r = −0.14 for WAB_20min; r = −0.16 for WAB_30min).
Total carotenoid content (TCC) exhibited a very strong positive correlation with beta-carotene content (BCC) (r = 0.95). In contrast, carotenoid traits (TCC and BCC) displayed negligible correlations with DMC (r = −0.05 and 0.04, respectively), HCN (r = 0.04 and 0.03, respectively), and water absorption metrics (r ≤ 0.03).
Additionally, DMC showed a weak positive correlation with HCN (r = 0.27), pointing to a slight trend where genotypes with higher dry matter also possess increased cyanide content. Overall, most trait pairs exhibited low-to-moderate correlations with the notable exceptions of the TCC–BCC and WAB_20–WAB_30min associations.
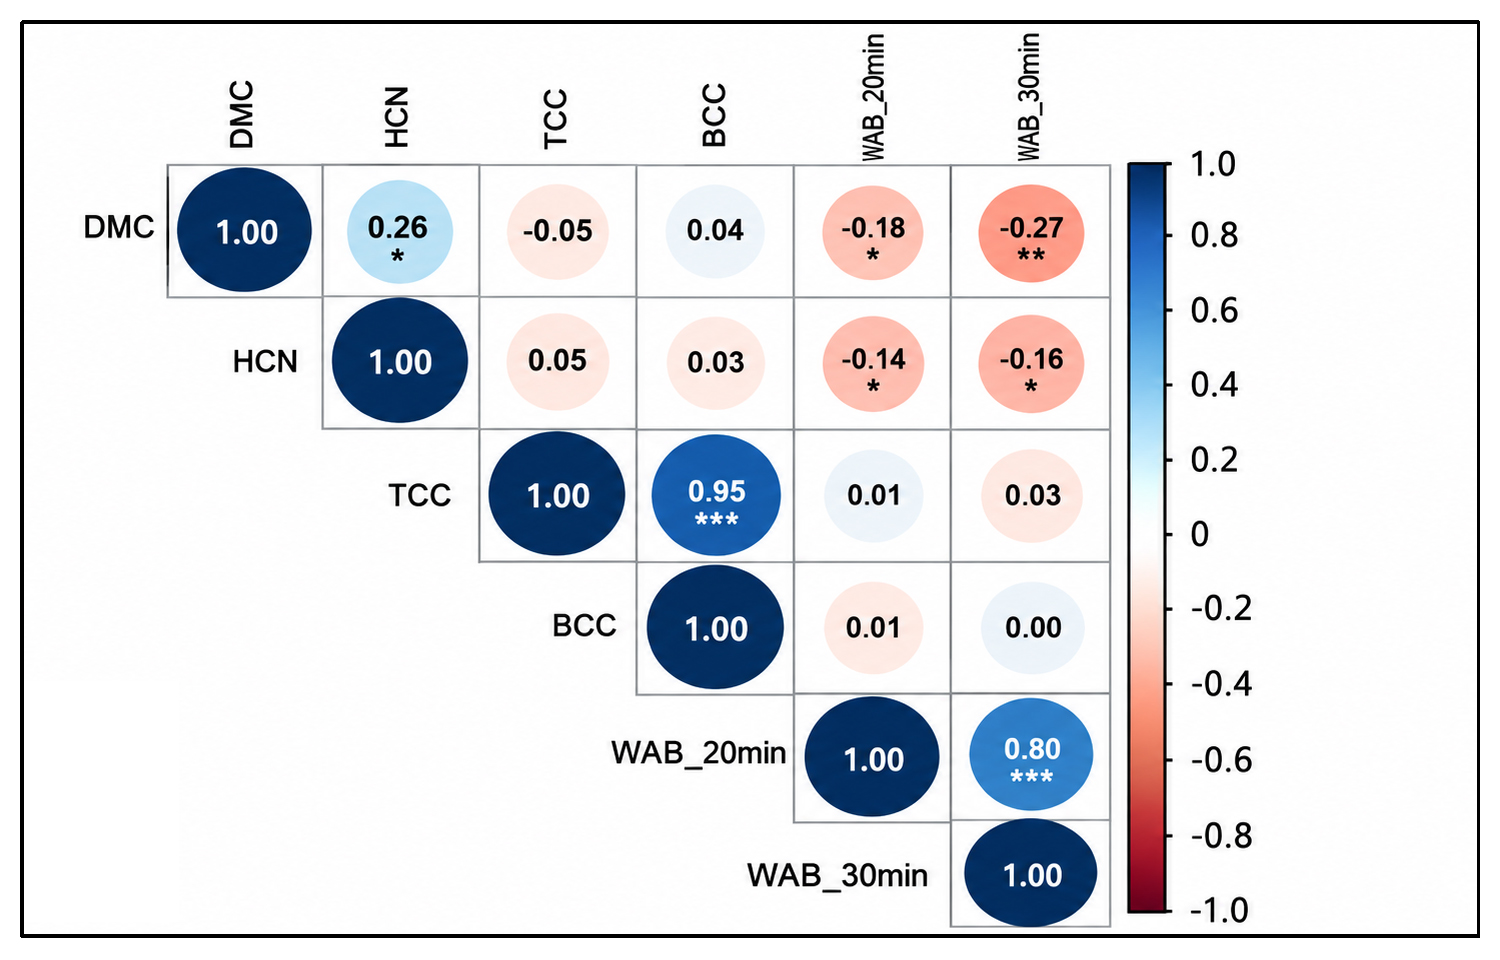 Figure 2. Correlation matrix of best linear unbiased predictors (BLUPs) among cassava root quality traits. Values within cells represent Pearson correlation coefficients (r), with blue indicating positive correlations and red indicating negative correlations. DMC: dry matter content; HCN: hydrogen cyanide content; TCC: total carotenoid content; BCC, beta-carotene content; WAB_20min and WAB_30min: water absorption at 20 and 30 min, respectively. Statistical significance is indicated as blank (p ≥ 0.05), * (p < 0.05), ** (p < 0.01), *** (p < 0.001).
The filtered DArTag and GBS marker datasets provided comprehensive genome-wide coverage suitable for association mapping. Detailed information on SNP density and chromosomal distribution across the cassava genome has been reported previously [43]. Likewise, the linkage disequilibrium (LD) decay analyses for both marker platforms demonstrated sufficient mapping resolution for genome-wide association studies (GWAS) and were used to define candidate genomic intervals surrounding significant marker–trait associations [43]. Population structure analysis of the germplasm panel also revealed moderate genetic stratification among the evaluated genotypes [43]. To account for this underlying structure and the relatedness among individuals, both population structure and kinship were incorporated into the GWAS model, thereby reducing the likelihood of spurious marker–trait associations.
Quantitative Genetic ParametersThe quantitative genetic parameters for all evaluated traits are summarized in Table 1. Genotypic variance (σ2G) exceeded both genotype-by-environment interaction variance (σ2GE) and residual variance (σ2E) for most traits, particularly for HCN, TCC, and BCC, indicating substantial genetic contribution to phenotypic variation. The WAB components, WAB_20min and WAB_30min exhibited σ2GE values (11.04 and 27.41, respectively) that exceeded or approached their respective genotypic variances.
Broad-sense heritability (H2) estimates were generally high, ranging from 0.58 to 0.96. TCC exhibited the highest heritability (0.96), closely followed by BCC (0.95), HCN (0.92), and DMC (0.90), indicating strong genetic control of these traits. Lower heritability estimates were observed for WAB_20min (0.58) and WAB_30min (0.70).
The coefficient of variation (CV) varied across traits and seasons. DMC consistently exhibited the lowest CV values across seasons (3.05%–5.46%). In contrast, HCN and water absorption traits displayed comparatively higher CV values, particularly HCN in Season 3 (38.70%) and WAB_20min in Season 2 (42.40%). TCC and BCC showed moderate CV values across seasons, ranging from 14.30% to 28.50%.
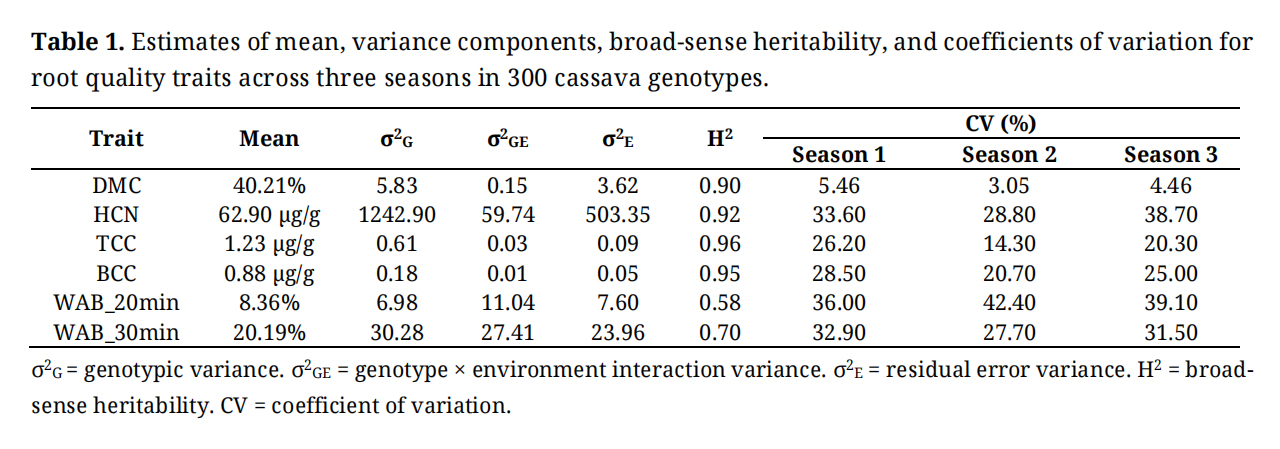 Table 1. Estimates of mean, variance components, broad-sense heritability, and coefficients of variation for root quality traits across three seasons in 300 cassava genotypes.
Genome-wide association analysis utilizing both GBS and DArTag markers identified significant loci associated with cassava root quality traits under the BLINK model (Tables 2 and 3). The two marker platforms demonstrated good agreement especially in chromosomes associated with the studied traits. Both datasets identified significant associations for DMC, HCN, TCC, BCC, and WAB_20min, whereas no significant loci were detected for WAB_30min.
For the carotenoid-related traits, both GBS and DArTag detected a major genomic region on chromosome 1, demonstrating strong concordance between the two marker systems. In the GBS dataset, SNPs S01_25897096 and S01_31747016 were consistently associated with both TCC and BCC. Notably, S01_31747016 exhibited highly significant associations, explaining 48.11% and 49.56% of the phenotypic variance for TCC and BCC, respectively. Similarly, DArTag analysis detected regions on chromosome 1 for TCC and BCC via the marker CassV7_chr01_27813884, which was also consistently associated with both traits and accounted for over 80% of the phenotypic variance.
Similarly, both marker platforms identified chromosome 16 as the primary genomic region associated with hydrogen cyanide (HCN) content. Specifically, GBS detected marker S16_810004, whereas DArTag identified CassV7_chr16_693845. The DArTag marker explained up to 36.31% of the phenotypic variance.
For dry matter content (DMC), GBS detected significant loci on chromosomes 1 and 4, whereas DArTag detected significant associations on chromosome 14. For WAB_20min, GBS markers showed association on chromosomes 11 and 18 (S11_11002934, S18_7289602) whileDArTag identified a single peak on chromosome 7 (CassV7_chr07_29527635).
The identified positions associated with TCC and BCC on chromosome 1 and HCN on chromosome 16 showed concordance between the two genotyping platforms, whereas the major associations detected for DMC and WAB_20min differed between GBS and DArTag. For TCC and BCC, the significant positions identified (v8.1) using GBS and DArTag were located at 31.75 Mb and 31.96 Mb, respectively, corresponding to a physical distance of approximately 0.21 Mb (210 kb). Similarly, the HCN-associated positions on chromosome 16 were located at 0.810 Mb and 0.699 Mb in GBS and DArTag, respectively, with a distance of approximately 0.111 Mb (111 kb).
The local LD analysis showed that the major TCC, BCC, and HCN associations were generally supported by neighboring markers, although the extent of LD support differed between platforms. The TCC/BCC-associated SNP S01_31747016 on chromosome 1 showed moderate LD with nearby markers, with the strongest neighboring associations reaching r2 = 0.31 within 91–365 kb. A second chromosome 1 signal, S01_31747046, showed stronger local LD, with several neighboring markers exhibiting r2 > 0.20 and values up to 0.61 within approximately 475 kb. In the DArTag dataset, the corresponding chromosome 1 signal (CassV7_chr01_31974032) showed strong LD with a neighboring marker 290 kb away (r2 = 0.71). For HCN, the chromosome 16 GBS-associated SNP (S16_810004) exhibited extensive local LD, with several neighboring markers showing r2 > 0.20 and maximum values of approximately 0.80 within 500 kb. Similarly, the DArTag-associated SNP (CassV7_chr16_693845) showed strong LD with neighboring markers, including a marker 89 kb away with r2 = 1.00 and another approximately 496 kb away with r2 = 0.34. Overall, these results indicate that the major TCC, BCC, and HCN associations occurred within LD-supported genomic regions rather than representing completely isolated markers, with stronger and more extensively characterized local LD observed in the higher-density GBS dataset.
The Manhattan plots displayed distinct association peaks corresponding to these significant loci across traits, and Q–Q plots indicated adequate control of population structure with minimal false-positive inflation (Figure 3).
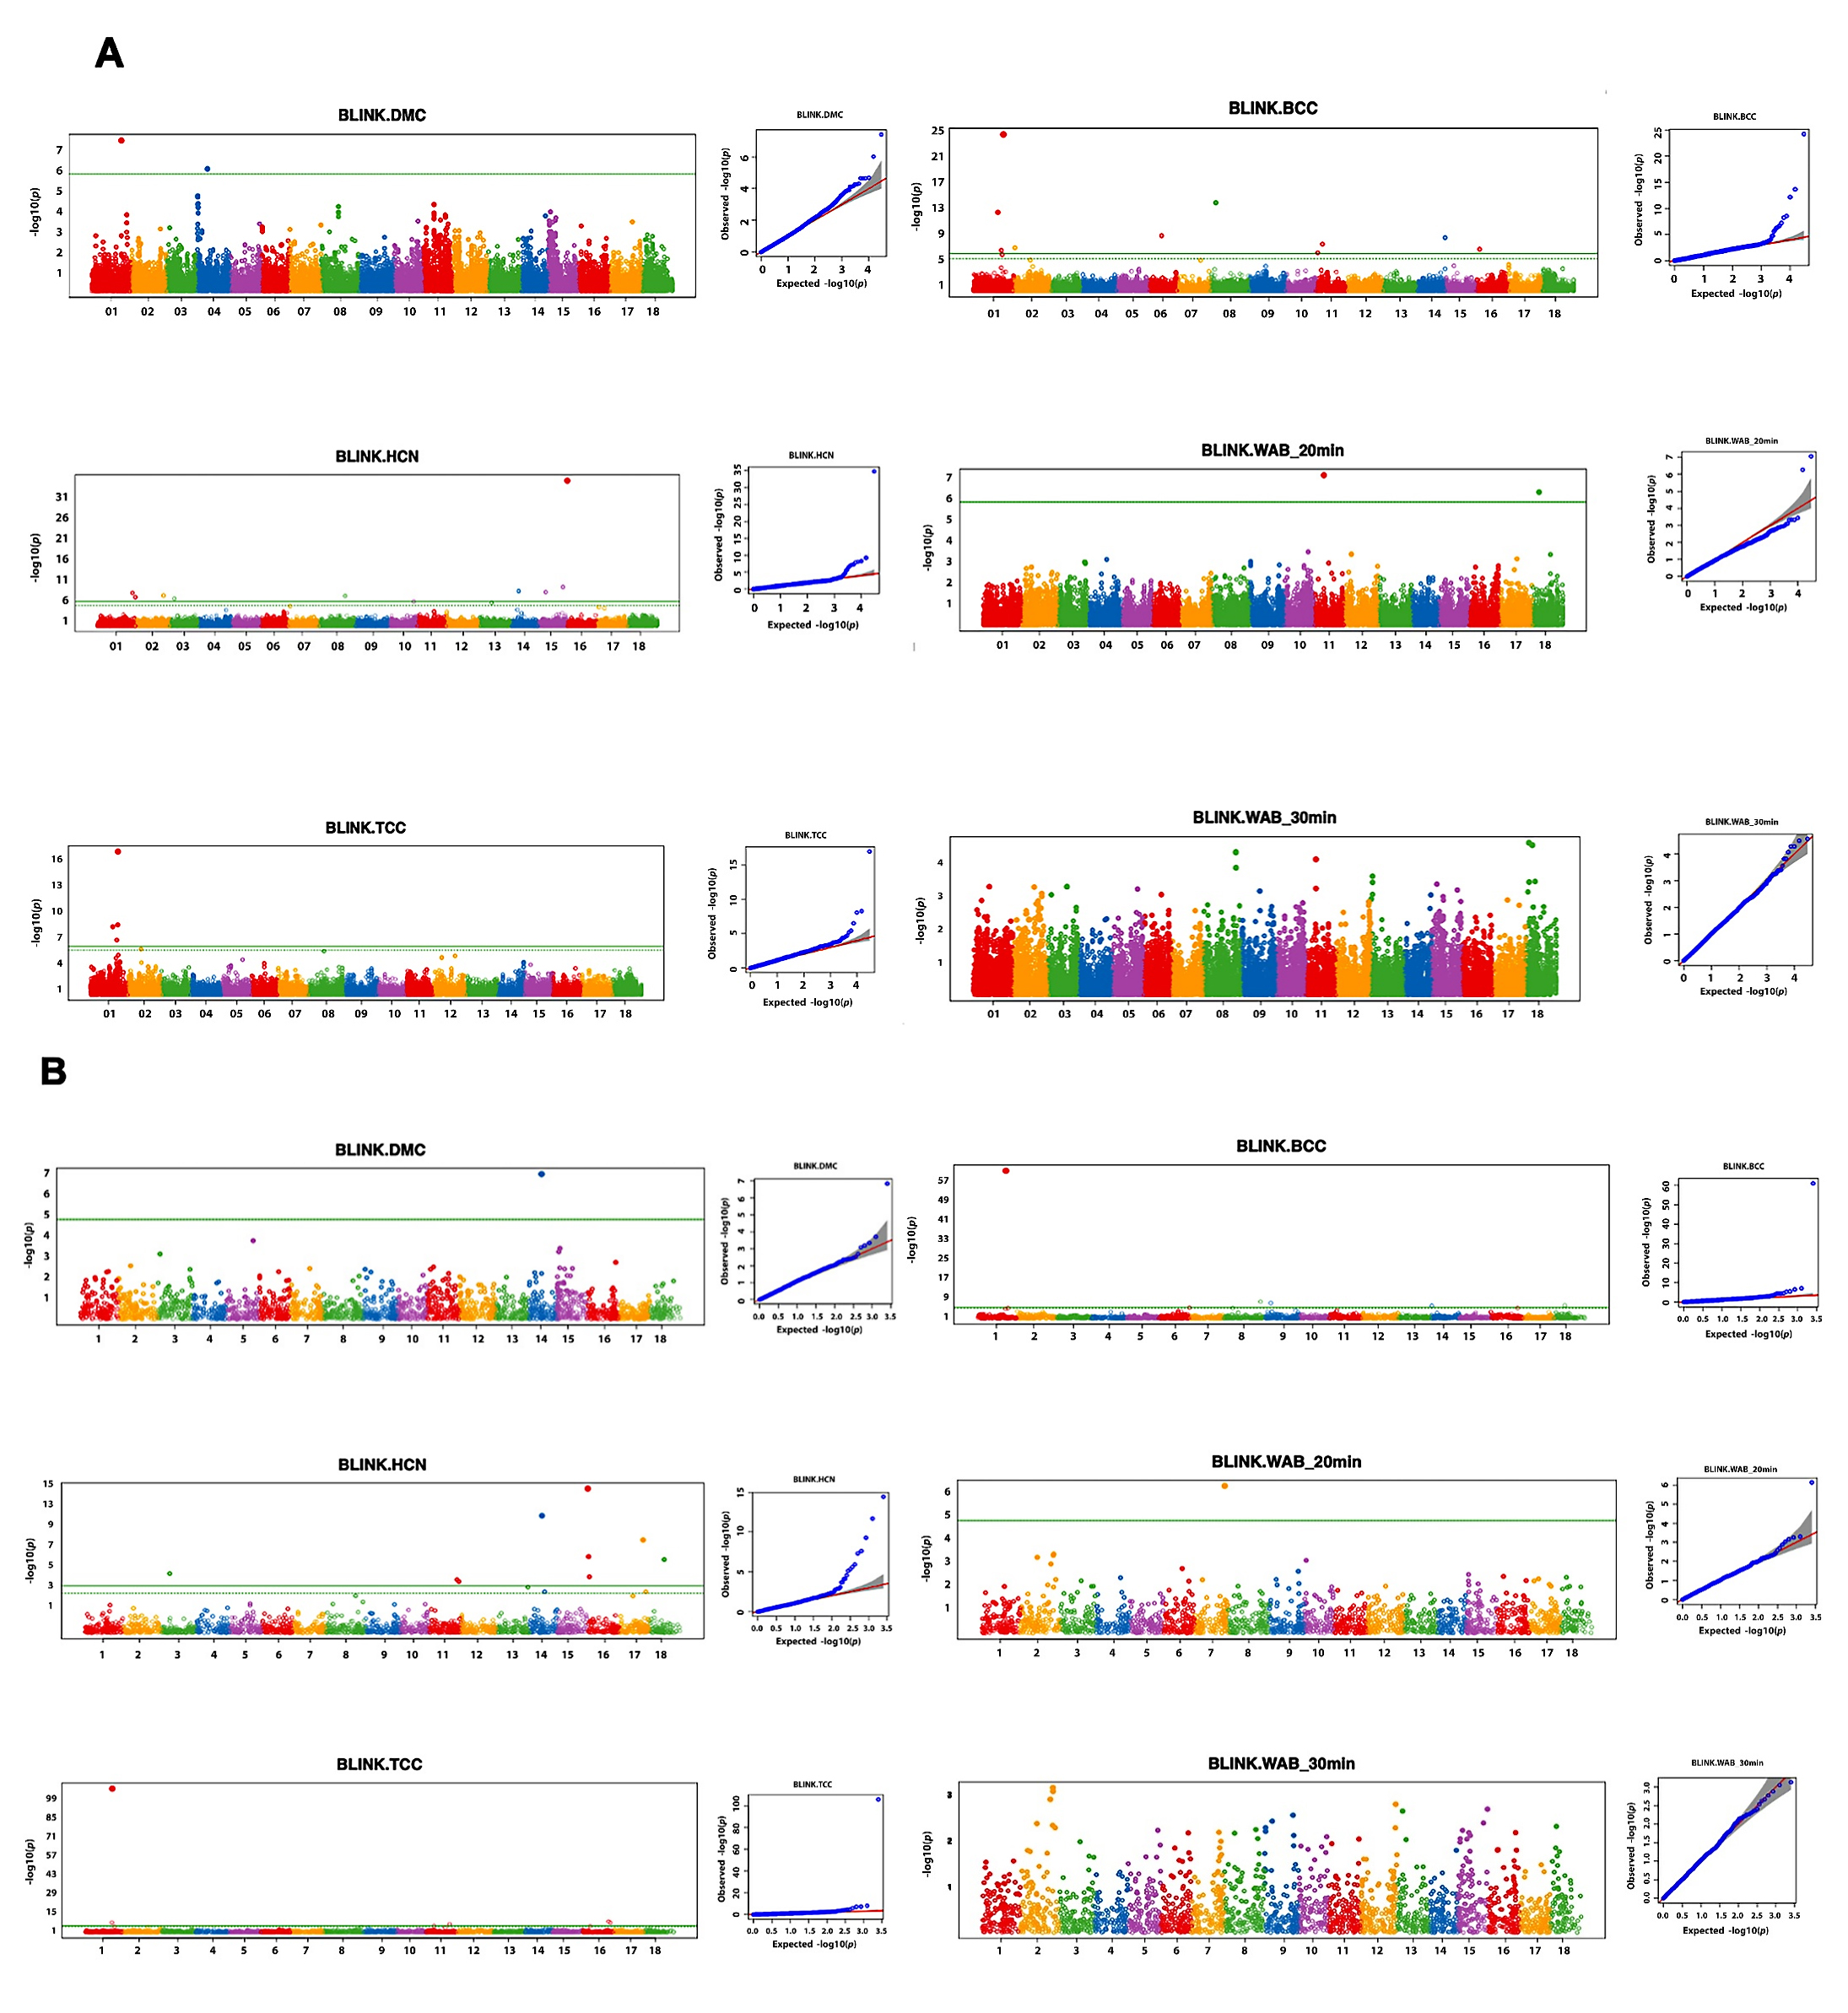 Figure 3. Manhattan and quantile–quantile (Q–Q) plots from genome-wide association studies (GWAS) for cassava root quality traits using the BLINK model in 300 cassava accessions: (A) GBS markers and (B) DArTag markers. DMC: dry matter content; HCN: hydrogen cyanide content; TCC: total carotenoid content; BCC, beta-carotene content; WAB_20min and WAB_30min: water absorption at 20 and 30 min, respectively. Horizontal green lines indicate the significance threshold.
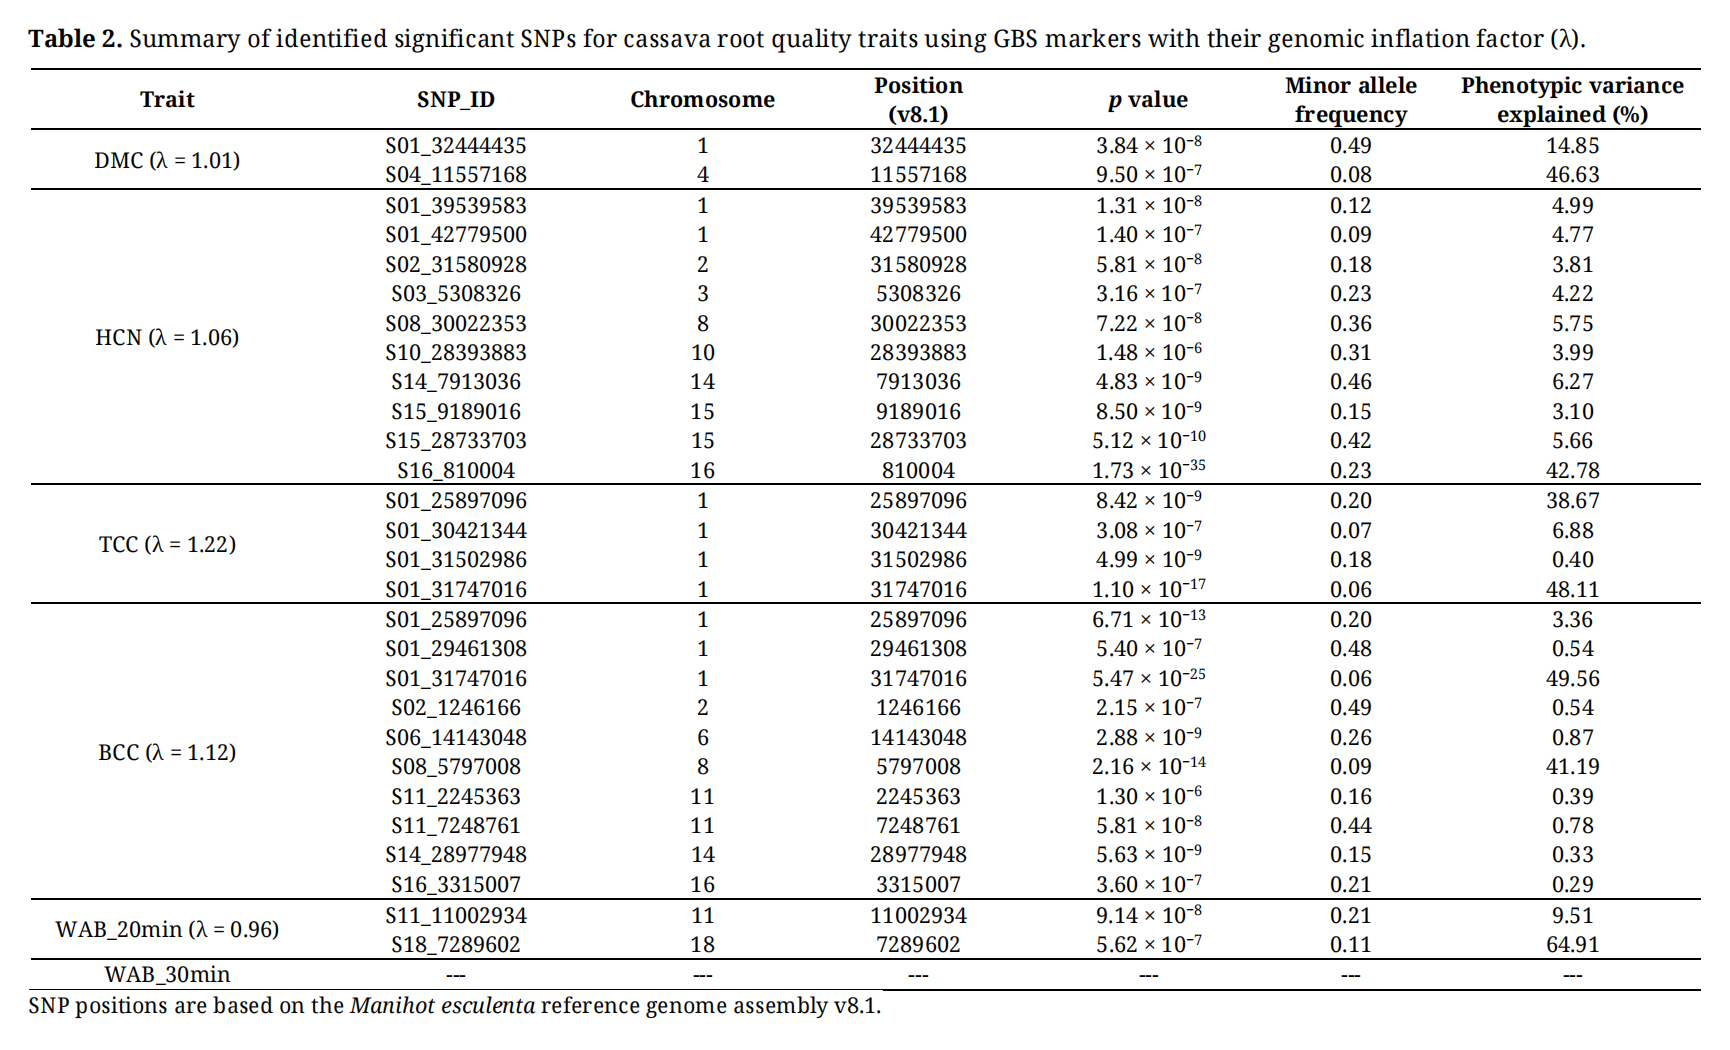 Table 2. Summary of identified significant SNPs for cassava root quality traits using GBS markers with their genomic inflation factor (λ).
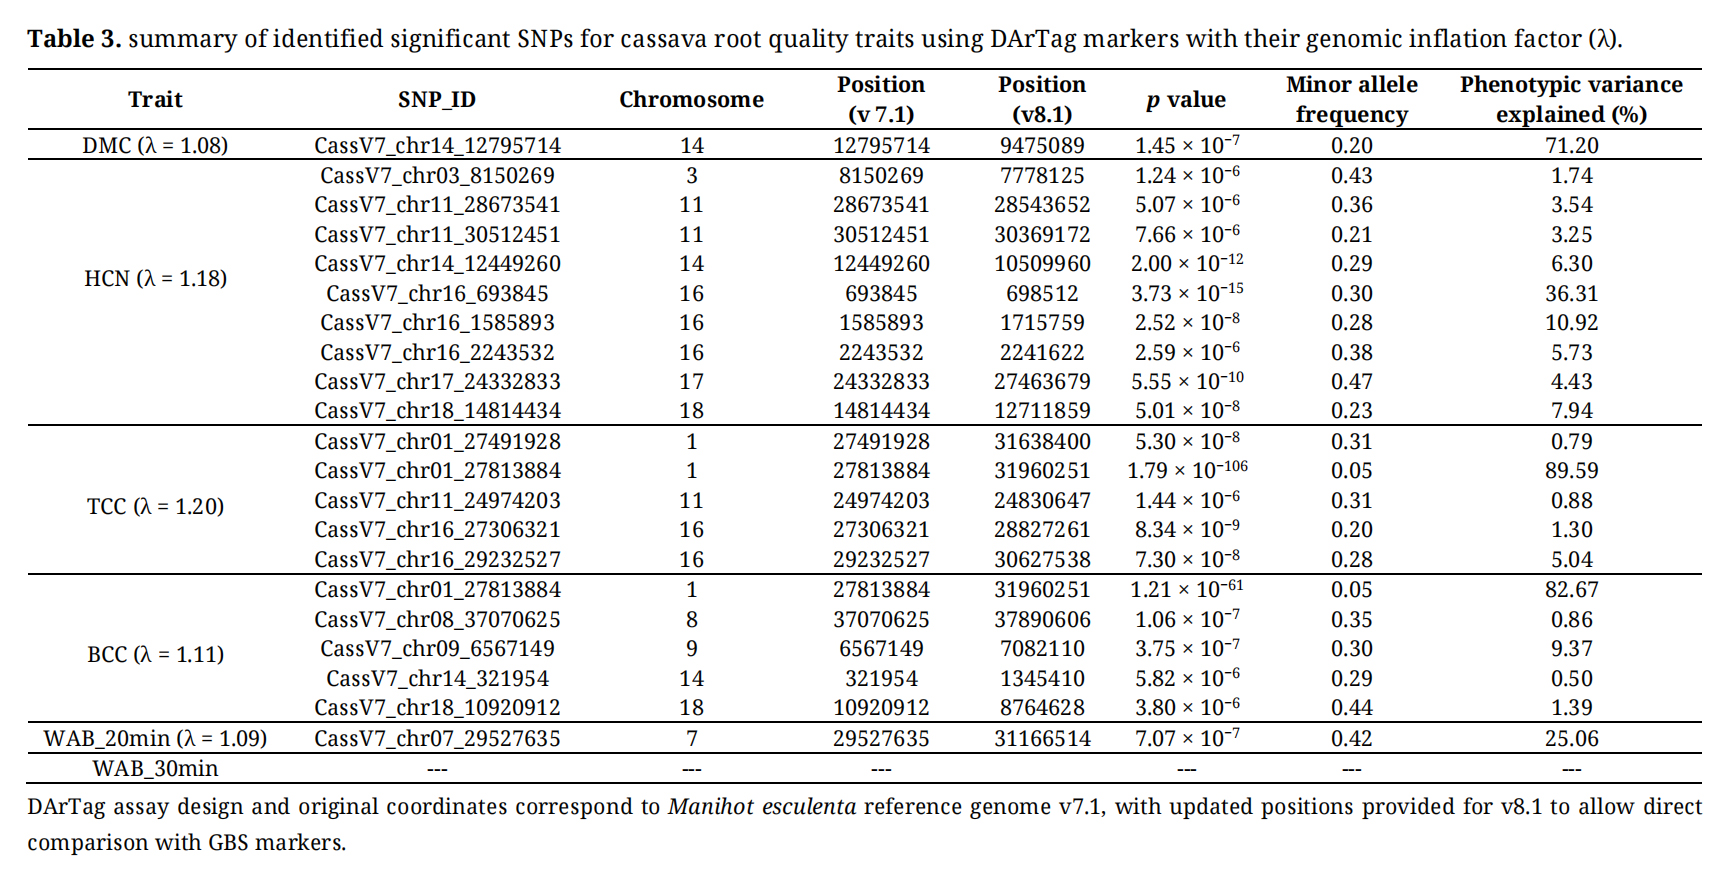 Table 3. summary of identified significant SNPs for cassava root quality traits using DArTag markers with their genomic inflation factor (λ).
Marker-trait association analyses of the significant SNPs revealed distinct allelic effects on root quality traits, though the magnitude, direction and distribution varied among loci and traits (Figure 4; Figure S1). Figure 4 illustrates markers explaining the highest phenotypic variance (PVE) for each trait (Tables 2 and 3). For GBS markers (Figure 4A), the DMC-associated marker S04_11557168 (PVE = 46.63%) displayed two allelic classes (A/A and A/G), with the homozygous A/A class dominating the population (p < 0.0001).
TCC and BCC marker S01_31747016 (PVE = 48.11% and 49.56% respectively) showed three allelic classes (A/A, A/G, and G/G) with the G/G class sparsely populated, as evidenced by the narrow and compressed violin shape. This could drive the high PVE at this locus.
The HCN marker S16_810004 (PVE = 42.78%) showed a progressive increase in cyanogenic potential from C/C to T/T (p < 0.001). However, the T/T class was underrepresented and exhibited a wide phenotypic spread (up to >300 mg/kg), contributing to within-class heterogeneity. Finally, for WAB_20min, marker S18_7289602 (PVE = 64.91%) showed that the T/T homozygous class exhibited the highest median water absorption.
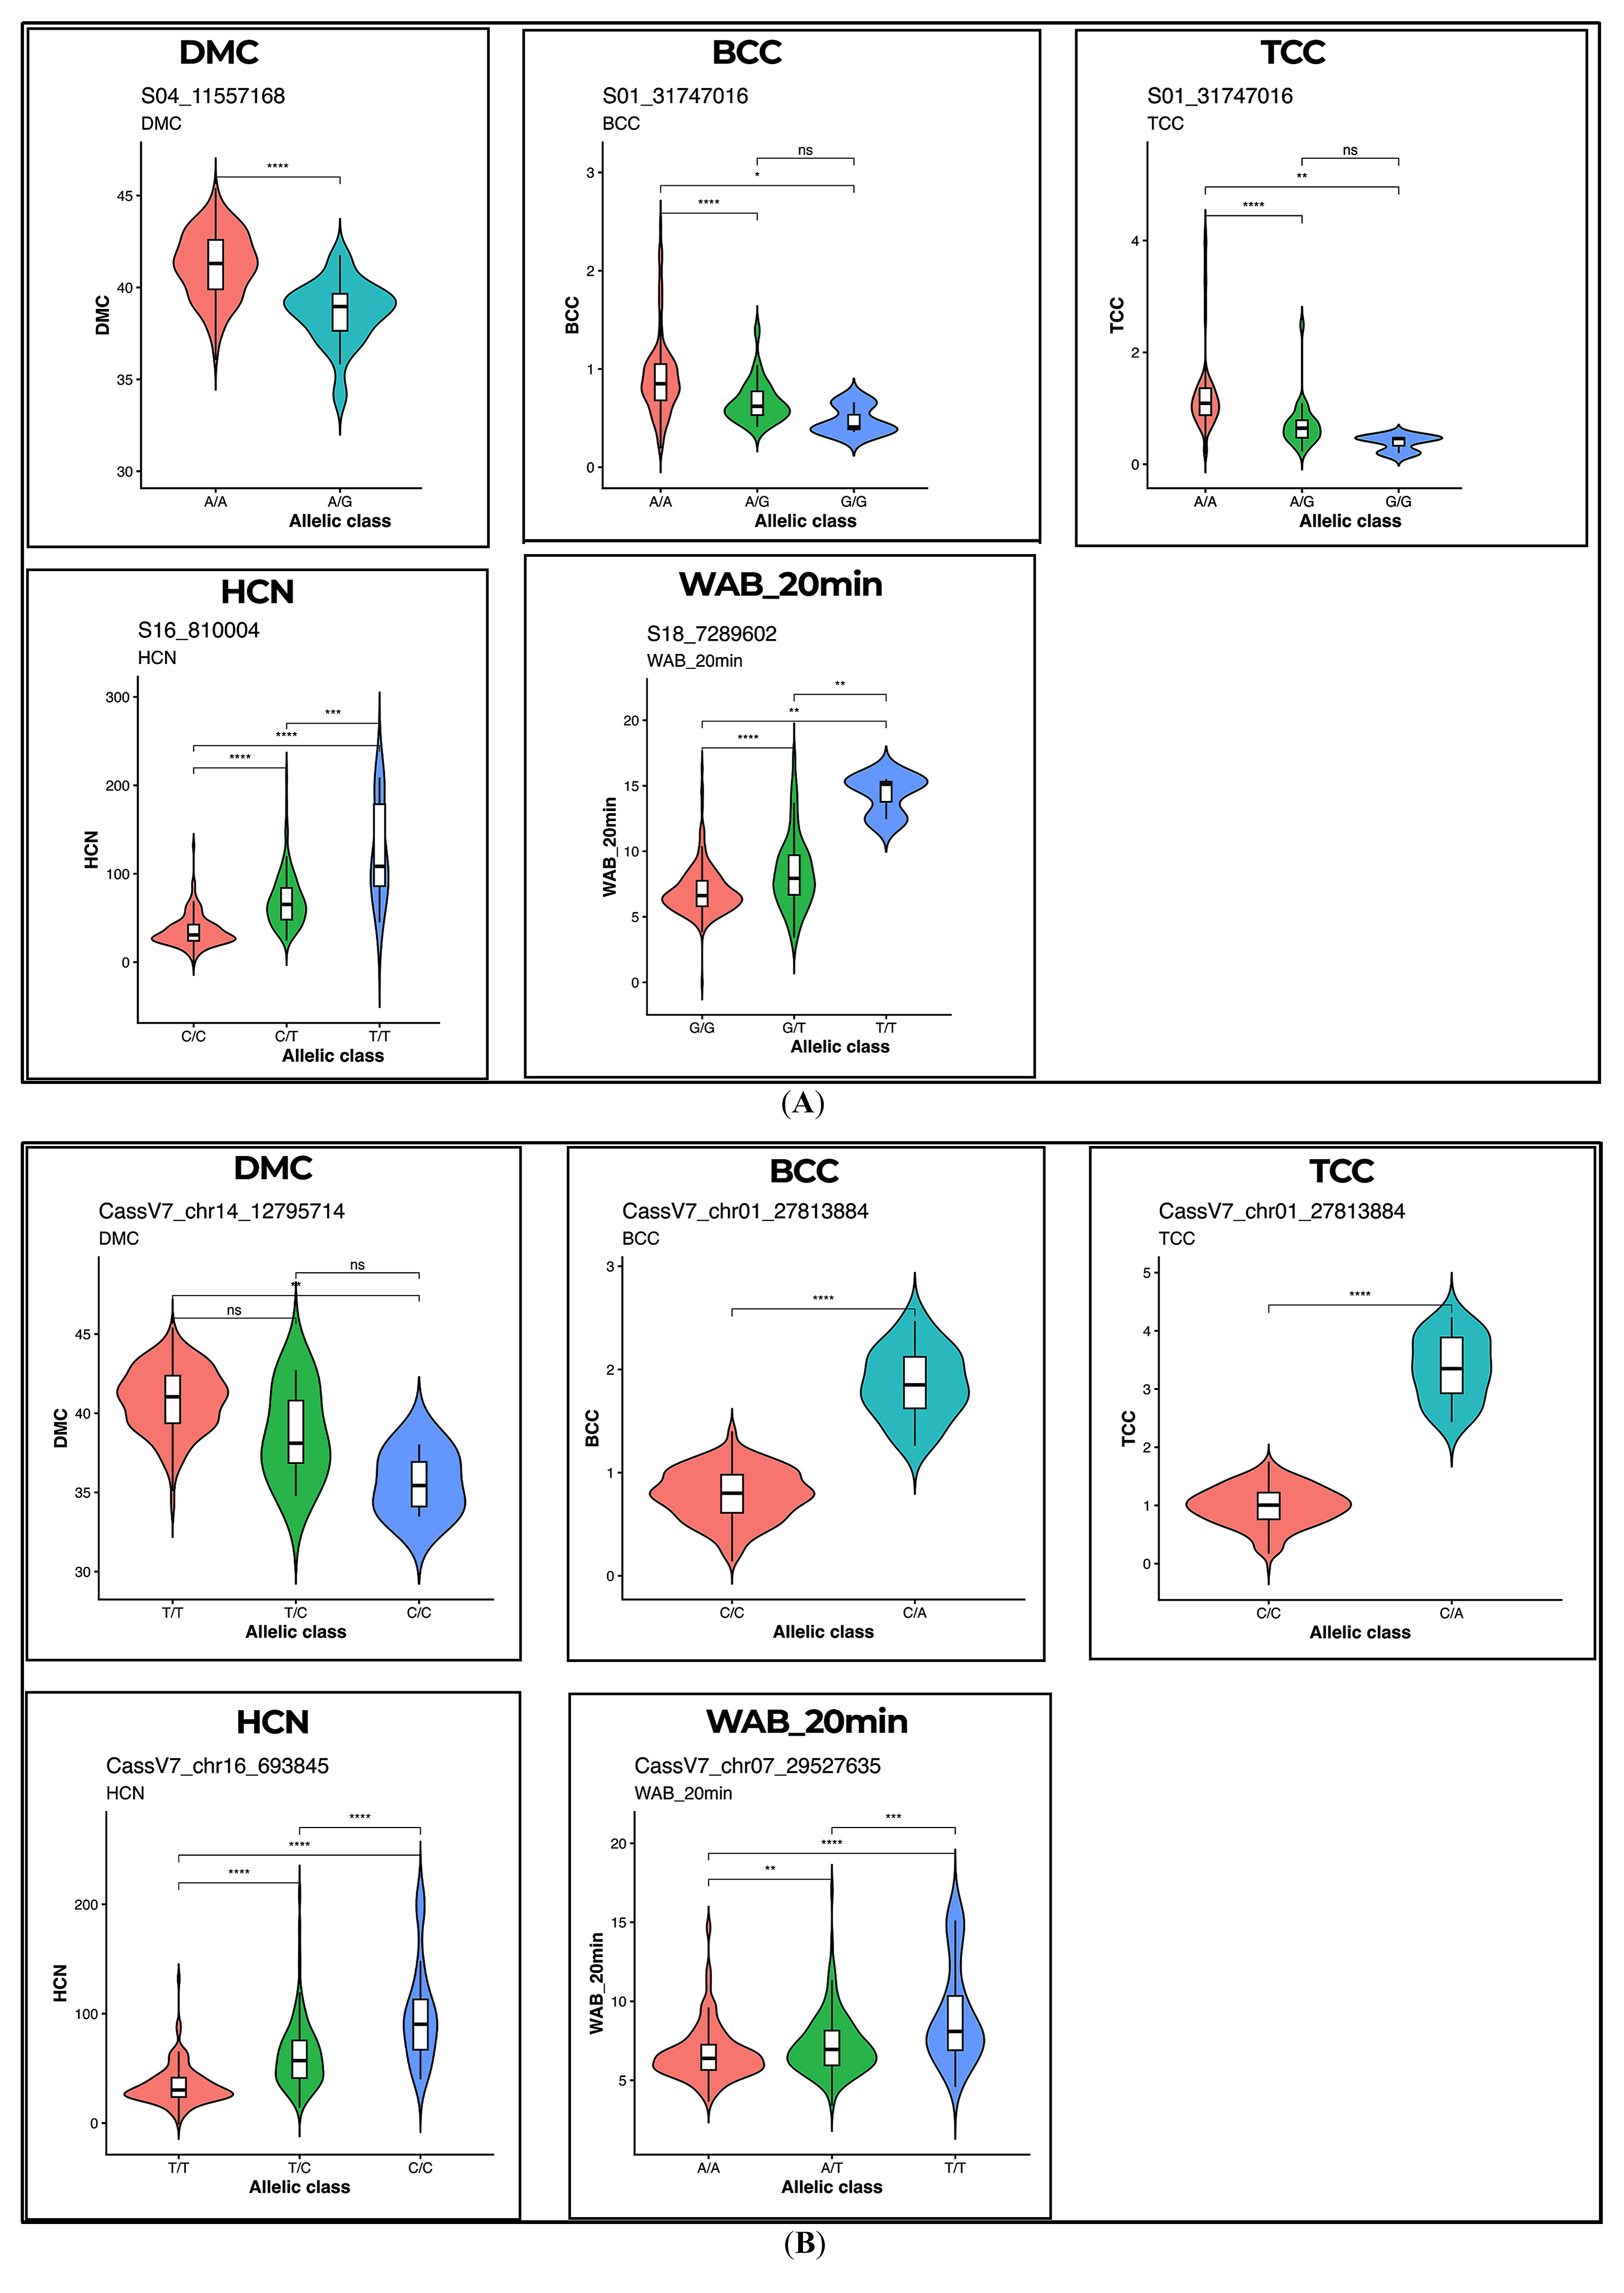 Figure 4. Representative violin plots for the significant SNP markers with the highest phenotypic variance explained (PVE) identified for each trait for (A) GBS markers and (B) DArTag markers. Each panel represents a significant marker locus, with violin shapes illustrating phenotype distribution, embedded boxplots indicating the median and interquartile range. DMC: dry matter content; HCN: hydrogen cyanide content; TCC: total carotenoid content; BCC, beta-carotene content; WAB_20min and WAB_30min water absorption at 20 min. Statistical significance is indicated as ns (p ≥ 0.05), * (p < 0.05), ** (p < 0.01), *** (p < 0.001), and **** (p < 0.0001).
For the DArTag markers (Figure 4B), the DMC marker CassV7_chr14_12795714 (PVE = 71.20%) displayed three allelic classes (T/T, T/C, and C/C). The non-significant difference (ns) between T/T and T/C, alongside a significant reduction in DMC for C/C (p < 0.01), suggests a dominant gene action for the T allele in driving high dry matter content. The HCN marker CassV7_chr16_693845 (PVE = 36.31%) displayed a highly significant stepwise increase in HCN from T/T to C/C (p < 0.0001), though the low-HCN T/T class was notably low in frequency. TCC and BCC—both mapping to the same locus, CassV7_chr01_27813884 (PVE = 89.59% and 82.67%, respectively), showed only two allelic classes. This fixed state concentrates the variance into a single pairwise contrast, yielding exceptionally high PVE estimates (>80%). For the WAB_20min, marker (CassV7_chr07_29527635) (PVE = 25.06%) showed a clear dosage-dependent increase in water absorption capacity from A/A to T/T (p < 0.0001).
Cassava root is widely considered the most economically important part of the plant, accounting for roughly 50% of the mature plant’s biomass and serving as the primary storage organ for starch, which is the basis of its economic value [46]. In this study, the identified loci for all evaluated root quality traits were distributed across different chromosomes, underscoring the polygenic nature and broad genomic control underlying cassava root quality.
High dry matter content (DMC), which is directly linked to starch yield in cassava, is a critical quality characteristic that benefits both industrial processors and subsistence farmers [47,48]. Higher DMC increases economic value per unit mass for industrial applications (such as starch and ethanol extraction) and provides higher caloric content with lower water weight for subsistence farm households [49,50]. Previous studies [12] identified a major locus for DMC on chromosome 1 that co-localized with a peak for provitamin A carotenoids, demonstrating a genetic association between high dry matter and root carotenoid accumulation. Consistent with these findings, the present study identified a significant GBS marker associated with DMC at position 32,444,435 bp on chromosome 1, while another marker at 31,747,016 bp on the same chromosome was significantly associated with both TCC and BCC.
The proportion of phenotypic variance explained by the GBS-associated SNPs varied widely across traits, with DMC and carotenoid-related traits consistently showing the largest individual locus effects—suggesting that these quality traits may be influenced by a few major-effect genes. Identifying multiple significant SNPs associated with the same root quality trait across the genotyping platforms (GBS and DArTag) confirms the polygenic nature of these traits [11,51]. The varying proportions of phenotypic variance explained by the identified significant SNPs suggests the presence of both major- and minor-effect loci influencing root quality. Marker effects observed across different chromosomes, demonstrates broad genome-wide control of these traits. The high phenotypic variance explained (PVE) by several markers in this study may be inflated due to the Beavis effect, whereby effect sizes of significant loci are often overestimated in studies with limited population sizes [52,53]. In our empirical observations of allelic distributions (Figure 4), this bias was exacerbated by rare or underrepresented genotypic classes. For instance, at marker CassV7_chr01_27813884, the complete absence of the alternative homozygous class (A/A) restricted variance partitioning to a single pairwise contrast, slightly elevating the PVE. Similarly, lower minor allele frequencies may have disproportionately inflated between-group variance components [54]. Previous studies have shown that PVE inflation decreases with increasing sample size, and larger populations of approximately 1000 individuals may be required to obtain precise estimates for polygenic traits [55,56]. Some of the PVE estimates reported here, may represent upper-bound values that require validation in larger, independently sampled populations with more balanced allele frequencies. However, the relatively elevated genomic inflation factor (λ) observed for some traits does not necessarily indicate poor model fit or the presence of bias and may arise from genuine polygenic signals rather than confounding effects. Complex traits are often influenced by numerous loci distributed across the genome, and the cumulative effects of these loci can legitimately inflate test statistics, resulting in higher λ values even when population structure and relatedness are adequately controlled [57].
Although a negative phenotypic correlation between DMC and carotenoid content has been widely reported in cassava breeding populations [17,58,59] the phenotypic correlation observed in the present panel was negligible (r = −0.05 for TCC, r = 0.04 for BCC; Figure 2). This apparent discrepancy may reflect differences in population composition. Most genotypes in this panel were white- or cream-fleshed with low carotenoid content, restricting the phenotypic range over which a trade-off between DMC and carotenoids could be detected. Alternatively, it may indicate that the previously reported trade-off is population-specific rather than a general genetic constraint. Some studies suggest that this relationship may result from physical linkage, particularly megabase-scale linkage disequilibrium on chromosome 1 [12,14], whereas others have proposed pleiotropy as the underlying cause [17]. The identification of distinct but close genomic positions on chromosome 1 for DMC and TCC in this present study may support the hypothesis that the association between these traits is driven by physical linkage rather than pleiotropy. However, the genetic basis of this relationship remains unresolved and warrants further investigation.
The shared detection of loci for TCC and BCC (Tables 2 and 3) is also biologically plausible because beta-carotene constitutes a major component of total carotenoids in cassava storage roots [60,61]. Consequently, genomic regions controlling beta-carotene biosynthesis are expected to substantially influence total carotenoid levels. The close proximity of the TCC and BCC associations detected by GBS (31.75 Mb) and DArTag (31.96 Mb) on v8.1 reference assembly suggests a common underlying genomic region, providing evidence of cross-platform replication and supporting the robustness of this genomic region for TCC and BCC.
Consumer acceptability is a key breeding objective. While dry matter and water absorption are very important traits for acceptability by consumers who boil or process the roots [62], high levels of carotenoids and beta-carotene is essential for improving the nutritional value of diets in regions where cassava is a staple food [62,63].
Several positions were identified for HCN on chromosome 16 across genotyping platforms and models. This confirms several reports that primarily associate cassava HCN to chromosomes 16 and 14 [26,64]. The genetic architecture underlying HCN levels in cassava differs markedly between chromosomes 14 and 16. Loci on chromosome 16 exhibit an additive pattern of inheritance, contributing substantially to the natural variation in HCN content. In contrast, chromosome 14 displays a dominance pattern of inheritance, with a much smaller contribution to the observed natural variation in HCN levels [64]. Besides these, this study identified novel positions on chromosomes 2, 6, 7, 8, and 13 for HCN.
For the GBS markers, the SNP S01_32444435 on chromosome 1, which was associated with DMC, is located within the putative gene Manes.01G131400. This gene has been reported to be involved in shaping tubular endoplasmic reticulum (ER) membranes and regulating localized membrane tension. Given that the tubular ER is an important site for the synthesis of proteins and lipids involved in cellular growth and storage, Manes.01G131400 represents a positional candidate gene that may be relevant to DMC variation. However, the observed marker–trait association does not establish a causal role for this gene, and its potential contribution to dry matter accumulation requires further functional validation [65,66]. The TCC-associated SNP S01_25897096 on chromosome 1 is located near the putative gene Manes.01G061900, annotated as a Bromo-Adjacent Homology (BAH) domain-containing protein. BAH domain-containing proteins are associated with chromatin recognition and epigenetic regulation of gene expression, making Manes.01G061900 a positional candidate for TCC variation. However, a direct role of this gene in regulating carotenoid biosynthesis or degradation has not been established, and its potential contribution to carotenoid accumulation requires experimental validation [67]. The DArTag marker CassV7_chr01_27813884, which was associated with both TCC and BCC, was located within the putative MePSY1 gene (Manes.01G124200) on chromosome 1 at approximately 27.81 Mb on the v7.1 reference assembly. The MePSY1 gene encodes phytoene synthase (PSY), a key enzyme in the carotenoid biosynthetic pathway. PSY catalyzes the first committed step of carotenoid biosynthesis by converting geranylgeranyl diphosphate to phytoene and a naturally occurring functional variant in PSY has been shown to increase enzymatic activity and carotenoid accumulation in yellow-fleshed cassava roots [68,69]. The detection of a marker associated with both TCC and BCC within PSY1 therefore identifies this gene as a biologically plausible candidate contributing to variation in these carotenoid-related traits.
Previous GWAS based on the Cassava v6.1 reference assembly identified a major region on chromosome 1 around 24.1 Mb that was associated with variation in both carotenoid and DMC [12]. In the present study, the DMC-associated SNP S01_32444435 was located at 32.44 Mb on the v8.1 assembly, while the TCC-associated DArTag marker CassV7_chr01_27491928 corresponded to 31.64 Mb after coordinate conversion to v8.1. These two associations are separated by approximately 0.81 Mb (806 kb), placing them within a relatively close genomic interval on chromosome 1. Their physical proximity raises the possibility that the DMC and TCC associations may reflect linkage disequilibrium among neighboring loci rather than necessarily resulting from pleiotropic effects of a single gene [12]. Among the DArTag markers, CassV7_chr07_29527635, associated with WAB_20, was located within the putative gene Manes.07G105500, annotated as a GTPase-activating protein GYP2. GYP2 proteins have been reported to participate in vesicle trafficking and intracellular transport processes, which may influence the distribution of starches, proteins, and other storage compounds within plant cells. Given the potential role of these processes in cellular turgor, tissue texture, and mealiness, Manes.07G105500 represents a positional candidate gene for variation in water absorption during boiling. However, the marker–trait association alone does not establish a causal relationship, and the potential contribution of this gene to cooking quality traits requires further functional validation [70]. The comparatively weak genetic signal observed for water absorption traits in this study—reflected in fewer significant loci and the complete absence of significant associations for WAB_30min aligns with previous reports describing water absorption and cassava cooking quality as traits strongly influenced by environmental and genotype × location effects [22]. Similar patterns have been reported in other root and tuber crops, where cooking-related textural traits such as mealiness are governed by complex, multigene pathways involving cell wall and pectin metabolism, rather than single major-effect loci [31–33].
Although some significant SNPs appeared isolated in the Manhattan plots, local LD analysis showed that the major TCC, BCC, and HCN associations were supported by neighboring markers. This was particularly evident for the higher density GBS loci, whereas the lower marker density of the DArTag platform provided fewer markers for characterizing local LD. These findings suggest that the apparent isolation of some associations in the Manhattan plots does not necessarily indicate unreliable signals [35]. Cross-platform concordance varied among traits: while the TCC and BCC associations on chromosome 1 and the HCN association on chromosome 16 were consistent across both platforms, major associations for DMC and WAB_20min mapped to different chromosomes. These discrepancies are likely driven by differences in marker density and genomic distribution between the platforms, as well as distinct local LD patterns and the underlying genetic architecture of traits governed by multiple loci.
Collectively, while these loci represent genuinely significant genomic regions controlling cassava root quality traits, high PVE values in markers with rare or underrepresented allelic classes should be interpreted with caution. Validation in independent, larger biparental or diversity populations will be essential to refine these variance components.
This study provides key insights into the genetic architecture of five cassava root quality traits. In addition to confirming previously reported chromosomal regions associated with these traits, the study identified novel association signals, thereby expanding current knowledge and offering new perspectives on the underlying genetic basis of cassava root quality. Collectively, these findings contribute to a more comprehensive understanding of cassava trait inheritance and provide a valuable foundation for future genetic improvement efforts in cassava breeding.
The phenotypic data (PPD BLUPs) and genotypic datasets (DArTag and GBS) used to run the GWAS have been uploaded as supplementary files. The following supplementary materials are available online, Sheet S1: Geno_GBS_markers, Sheet S2: Geno_DArTag_markers, Sheet S3: Pheno_BLUPs_GBS_all traits, Sheet S4: Pheno_BLUPs_DArTAG_all traits, Figure S1: Violin plots showing the distribution of root quality traits across allelic classes for the remaining significant SNP markers identified using (A) GBS and (B) DArTag markers. Each panel represents a significant marker locus, with violin plots illustrating the distribution of phenotypic values and embedded boxplots indicating the median and interquartile range. DMC, dry matter content; HCN, hydrogen cyanide content; TCC, total carotenoid content; BCC, beta-carotene content; and WAB_20min, water absorption after 20 min. Statistical significance is indicated as ns (p ≥ 0.05), * (p < 0.05), ** (p < 0.01), *** (p < 0.001), and **** (p < 0.0001).
Field trial details are uploaded at www.cassavabase.org under trial names 202379PDF1C_ciat, 202440PDEPR_ciat, and 202517PDEPR_ciat for seasons 1, 2, and 3 respectively.
KOD, BO, and WG conceptualized the study. JLLM, JLMA, MAO, and LL collected and organized all data. SMS and NM designed and established experimental field. NM developed plant populations. KOD analysed the data and wrote the paper with inputs from all authors.
The authors declare that they have no conflicts of interest.
The authors declare financial support was received for the research and/or publication of this article. This research was fully funded by the Gates Foundation at CIAT, under the Project Number: INV-054653. The PhD studies of the lead author in Plant breeding at the Pan African University, Life and Earth Sciences Institute (Including Health and Agriculture), Ibadan, Nigeria was sponsored by the African Union Commission (AUC) scholarship.
The authors are grateful to the staff of CIAT cassava program for their support and effort.
1.
2.
3.
4.
5.
6.
7.
8.
9.
10.
11.
12.
13.
14.
15.
16.
17.
18.
19.
20.
21.
22.
23.
24.
25.
26.
27.
28.
29.
30.
31.
32.
33.
34.
35.
36.
37.
38.
39.
40.
41.
42.
43.
44.
45.
46.
47.

Copyright © Hapres Co., Ltd. Privacy Policy | Terms and Conditions


